. 2016 Jun 15;90(6):1174-1188.
doi: 10.1016/j.neuron.2016.05.005. Epub 2016 Jun 2.

A Primate lncRNA Mediates Notch Signaling during Neuronal Development by Sequestering miRNA

Affiliations

A Primate lncRNA Mediates Notch Signaling during Neuronal Development by Sequestering miRNA

Neha Rani et al. Neuron. .

Abstract

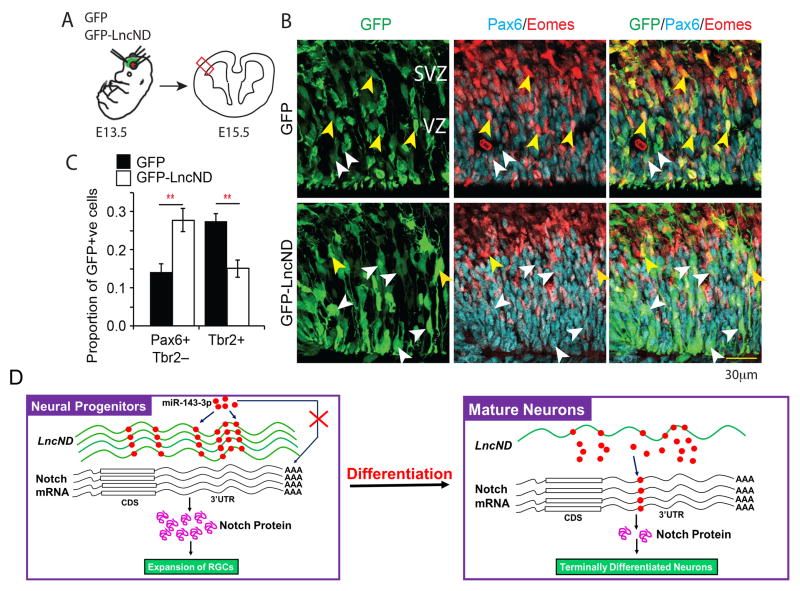
Long non-coding RNAs (lncRNAs) are a diverse and poorly conserved category of transcripts that have expanded greatly in primates, particularly in the brain. We identified an lncRNA, which has acquired 16 microRNA response elements for miR-143-3p in the Catarrhini branch of primates. This lncRNA, termed LncND (neurodevelopment), is expressed in neural progenitor cells and then declines in neurons. Binding and release of miR-143-3p by LncND control the expression of Notch receptors. LncND expression is enriched in radial glia cells (RGCs) in the ventricular and subventricular zones of developing human brain. Downregulation in neuroblastoma cells reduced cell proliferation and induced neuronal differentiation, an effect phenocopied by miR-143-3p overexpression. Gain of function of LncND in developing mouse cortex led to an expansion of PAX6+ RGCs. These findings support a role for LncND in miRNA-mediated regulation of Notch signaling within the neural progenitor pool in primates that may have contributed to the expansion of cerebral cortex.


Conflict of interest statement

The authors declare no competing financial interests.

Figures

Figure 1
Figure 1. Identification, Characterization and Conservation of LncND transcript
(A) Computational prediction (using TargetScan) of all the MREs of brain-expressed miRNAs on all the brain-expressed human lncRNAs (from Human Body Map LincRNAs). The graph represents the total lncRNAs having MREs ranging from 1–12. (B) Diagrammatic representation of LncND transcript of 2710 bp length as annotated on UCSC Genome browser showing the MREs located in the 5′ end. Region between 1–1971 bp of LncND transcript is zoomed-in to show the MREs for miR-143-3p, miR-4330, miR-1912 and miR-4286. (C) in-situ hybridization using probes specific for either sense (left) or antisense (right) strand. Brown dots represent the positive signal for LncND and blue staining shows the haematoxylin nuclear stain. Black and red arrows represent the cytoplasmic and nuclear expression of LncND, respectively. The experiment was repeated twice with the same outcome in neural progenitor cells (top) and SHSY5Y cells (bottom). Scale: 50 μm. (D) Multiz Alignment showing the conservation of LncND across some representative species. Red bar represents the 5′ end of human LncND enriched in MREs for several miRNAs. (E) Phylogenetic relationship of LncND among primates. Branch lengths are based on an approximation of the standard likelihood ratio test representing the number of substitutions per site calculated by PhyML. Numbers represented in red are branch support values. The tree was created using phylogeny.fr platform. The numbers of MREs for miR-143-3p are shown in green in parenthesis.
Figure 2
Figure 2. Expression of LncND and binding of miR-143-3p to LncND transcript
(A) H9 cells differentiated into neurons using the dual SMAD inhibition protocol. Expression of LncND at different time points during neuronal differentiation by RT-qPCR. (B) H9 cells differentiated into mesendoderm using BMP4 and FGF2. Expression of LncND during different time points of mesendoderm differentiation. (C) Table showing representative miRNAs with high number of MREs in LncND transcript as predicted by PITA algorithm. (D) Thermodynamic energy prediction for the association of LncND and miR-143-3p by RNAHybrid program. (E) RNA immunoprecipitation with either IgG or Ago2-specific antibody in SHSY5Y cells. Western blot showing Ago2 protein marked by red arrow. Asterisk (*) indicates the heavy and light chain of anti-Ago2 antibody. (F) RNA was extracted from the immunoprecipitates and analyzed by RT-qPCR. The values are represented as fold enrichment compared to the IgG control. GAPDH was used as a negative control and H19 as a positive control. (G) HEK293T cells were treated with miRNA mimics and the luciferase activity of LncND after 72 h was detected. Reduced luciferase activity of LncND was observed in the presence of the miR-143-3p mimic. (H) Increase in the luciferase activity of LncND after the addition of LNA inhibitor for miR-143-3p in SHSY5Y cells. Firefly luciferase activity was normalized to renilla luciferase activity. (I) The endogenous RNA expression of LncND after the overexpression of miR-143-3p in SHSY5Y cells by RT-qPCR. All the experiments (A-B and E-I) were performed in triplicates. Error bars represent standard deviation. p-values indicated were calculated by Student’s t-test (unpaired). ns: p>0.05, *: p≤0.05, **: p≤0.01, ***: p≤0.001, ****: p≤0.0001.
Figure 3
Figure 3. NOTCH-1 and NOTCH-2 are the targets of miR-143-3p
(A) The binding site of miR-143-3p in NOTCH-1 and -2 3′UTR as predicted by PITA algorithm. (B) Validation of miRNA-binding to the 3′UTR of NOTCH-1 and NOTCH-2 by luciferase activity assay. Reduction in the luciferase activity demonstrated the binding of miR-143-3p to the 3′UTR of NOTCH-1 and NOTCH-2. (C) Increase in the luciferase activity of LncND after the addition of LNA inhibitor for miR-143-3p in SHSY5Y cells. (D) Effect of miRNA overexpression on the endogenous RNA expression of NOTCH-1, NOTCH-2 and LncND in SHSY5Y cells by RT-qPCR. (E) Down-regulation of HES1 and HEY1 mRNA after the overexpression of miR-143-3p in SHSY5Y cells after 48 h. (F) Immuno-blotting (left panel) and quantification (right panel) showing the reduction in the endogenous protein expression of NOTCH-1 and NOTCH-2 at 72 h following the transfection of the miR-143-3p mimic in SHSY5Y cells (G) Immuno-blotting (left panel) and quantification (right panel) showing the increase in NOTCH-1 and NOTCH-2 protein 72 h after LNA inhibition of miR-143-3p in SHSY5Y cells. qPCR results are normalized to HPRT. All experiments were performed at least three times. Error bars represent standard deviation. p-values indicated were calculated by Student’s t-test (unpaired). ns: p>0.05, *: p≤0.05, **: p≤0.01, ***: p≤0.001, ****: p≤0.0001.
Figure 4
Figure 4. LncND act as a platform to sequester miR-143-3p
(A) The luciferase activity of NOTCH-1 and NOTCH-2 is up-regulated with the over-expression of LncND in SHSY5Y cells. (B) The luciferase activity of NOTCH-1 and NOTCH-2 is down-regulated with the knock-down of LncND in SHSY5Y cells. Firefly luciferase activity was normalized to renilla luciferase activity in all the experiments. (C) Protein expression analysis of endogenous NOTCH-1 and NOTCH-2 protein with the knock-down of LncND in SHSY5Y cells normalized to beta-actin. Right panel shows quantification from three replicates. (D) Overexpression of LncND in SHSY5Y cells increases the expression of NOTCH-1 and NOTCH-2 endogenous protein levels. Right panel shows quantification from three independent experiments. Error bars represent standard deviation (n=3). p-values indicated were calculated by Student’s t-test (unpaired). ns: p>0.05, *: p≤0.05, **: p≤0.01, ***: p≤0.001, ****: p≤0.0001.
Figure 5
Figure 5. LncND knock-down leads to reduced cell proliferation and increased neuronal differentiation of SHSY5Y cells
(A) H9 cells were differentiated into neurons using dual SMAD inhibitors. RNA from cells was isolated at different time points. Left: Expression of LncND, NOTCH-1 and NOTCH-2 was analyzed by RT-qPCR at different time points during differentiation of H9 cells. Right: miRNA expression during neuronal differentiation of H9 cells was measured using Taqman probes and the values were normalized to U6. (B) Representative differentially expressed genes involved in Notch signaling as identified using Cufflinks 2.1.1 after LncND knock-down (n=3, q-value <= 0.05). (C) Significant correlation and overlap between genes differentially expressed or unchanged after LncND knock-down and miR-143-3p overexpression (p<0.0001, Chi-square test). The numbers in the box represent the number of genes overlapping in each category. (D) Gene ontology (GO) term analysis of overlapping down-regulated genes between si-LncND and miR-143-3p overexpression (left), downregulated genes after LncND knock-down (middle) and miR-143-3p overexpression (right). (E) Immunostaining of SHSY5Y cells treated with control siRNA or siRNAs for LncND and NOTCH-1. Cells were stained for Tau (Green), MAP2 (Red) or Hoechst (Blue) for axons, dendrites and nucleus, respectively, and analyzed by fluorescent microscopy. Scale: 100 μm. (F) Bright-field image of SHSY5Y cells treated with either control siRNA, si-LncND, si-NOTCH-1, control miRNA mimic or miR-143-3p mimic. Knock-down of LncND and NOTCH-1 shows neurite-like processes after 72 h of transfection. Scale: 100 μm. (G) BrdU proliferation assay. SHSY5Y cells were treated with 100 nM of either control siRNA or siRNA for LncND or NOTCH-1 for 72 h. Cells stained with BrdU and 7-AAD were analyzed by flow cytometry. Knock-down of LncND and NOTCH-1 significantly reduced the proliferation of SHSY5Y cells. All the experiments were performed in triplicates. Error bars represent standard deviation. p-values indicated were calculated by Student’s t-test (unpaired). ***: p<0.001, **: p<0.01.
Figure 6
Figure 6. Expression of LncND in neural progenitor cells including radial glia cells in VZ and OSVZ in human neocortex
(A) Single-cell RNA-seq analysis from human cerebral organoids–Heatmap (Pearson’s correlation), representing the clustering of cells based on the known radial glia cell markers. LncND-expressing cells are represented in purple on top of the heatmap. Genes marked in red box represents example of DE genes between LncND-cluster (marked in black box) and the rest of the cells. (B) Left and middle panel: GW17 primary human neocortex section demonstrating the PAX6+ radial glia cells and nuclear staining with DAPI. Right panel: in-situ hybridization with a probe specific for LncND showing its localization in VZ and OSVZ progenitor cells. Experiment was repeated at least two times. (C) Co-localization of LncND and PAX6+ cells in the OSVZ representing outer radial glia cells (oRG). Red and green boxes of the merged figure are zoomed-in to show the co-localization of LncND and PAX6. Cells were immunostained with PAX6-specific antibody (red) after performing in-situ hybridization with LncND-specific probe (green dots). Experiment was repeated at least two times. Scale: 50μm.
Figure 7
Figure 7. Gain of LncND function leads to an expansion of radial glia population in the developing mouse cortex
(A) Schematic representing experimental design. LncND was overexpressed in developing mouse E13.5 radial glia by in utero electroporation. Brains were harvested at E15.5 and quantification was performed in the lateral cortex (red box, see Methods). (B) Representative images of tissue sections through E15.5 mouse lateral cortex tissue sections immunostained for GFP, radial glia marker Pax6, and intermediate neuronal progenitor cell marker Tbr2. White arrowheads indicate examples of electroporated cells expressing Pax6 but not Tbr2, and yellow arrowheads indicate examples of electroporated cells expressing Tbr2. VZ-ventricular zone, SVZ-subventricular zone. (C) Bar chart represents quantification of the proportion of electroporated cells with the molecular signature of radial glia (Pax6+/Tbr2−) and intermediate progenitors (Tbr2+) in control (filled bars) and LncND-overexpressing conditions (open bars). ** -p<0.01, two tailed Student’s t-test for n=4 biological replicates. (D) Diagrammatic representation of the molecular mechanism of LncND during neuronal development. In neural progenitors, LncND is highly expressed and sequesters miR-143-3p, thus releasing repression on the NOTCH mRNA leading to increased production of NOTCH proteins required for the maintenance of neural progenitors. During differentiation of neural progenitors to neurons, LncND expression decreases, thus releasing miR-143-3p to repress NOTCH mRNA, supporting differentiation. RGCs: Radial glia cells, CDS: Coding DNA sequence.

Comment in

References

    1. Amaral PP, Mattick JS. Noncoding RNA in development. Mamm Genome. 2008;19:454–492. - PubMed
    1. Arcila ML, Betizeau M, Cambronne Xa, Guzman E, Doerflinger N, Bouhallier F, Zhou H, Wu B, Rani N, Bassett DS, et al. Novel primate miRNAs coevolved with ancient target genes in germinal zone-specific expression patterns. Neuron. 2014;81:1255–1262. - PMC - PubMed
    1. Artavanis-Tsakonas S. Notch Signaling: Cell Fate Control and Signal Integration in Development. Science (80- ) 1999;284:770–776. - PubMed
    1. Bail S, Swerdel M, Liu H, Jiao X, Goff La, Hart RP, Kiledjian M. Differential regulation of microRNA stability. RNA. 2010;16:1032–1039. - PMC - PubMed
    1. Barry G, Mattick JS. The role of regulatory RNA in cognitive evolution. Trends Cogn Sci. 2012;16:497–503. - PubMed

Publication types

MeSH terms