. 2016 Jun 14;15(11):2536-49.
doi: 10.1016/j.celrep.2016.05.019. Epub 2016 Jun 2.

LSD1 Interacts with Zfp516 to Promote UCP1 Transcription and Brown Fat Program

Affiliations

LSD1 Interacts with Zfp516 to Promote UCP1 Transcription and Brown Fat Program

Audrey Sambeat et al. Cell Rep. .

Abstract

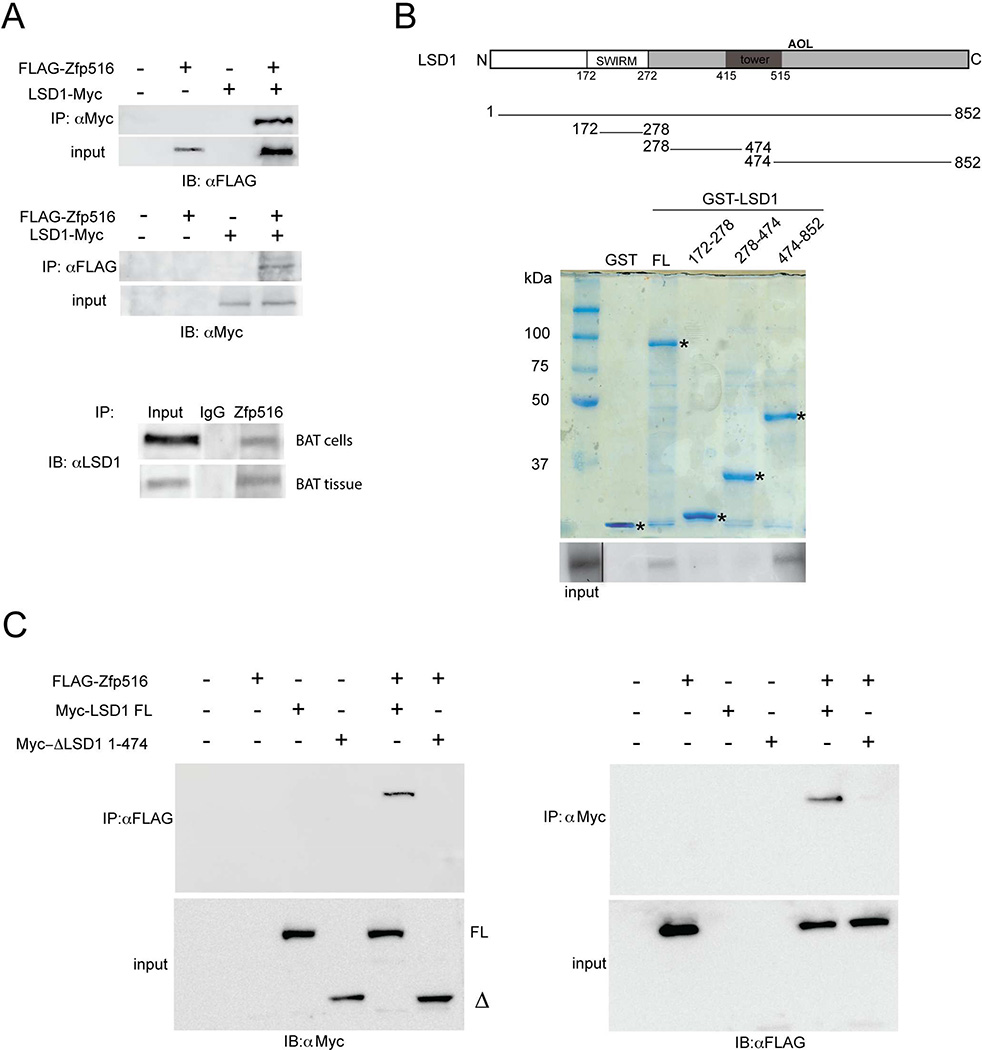
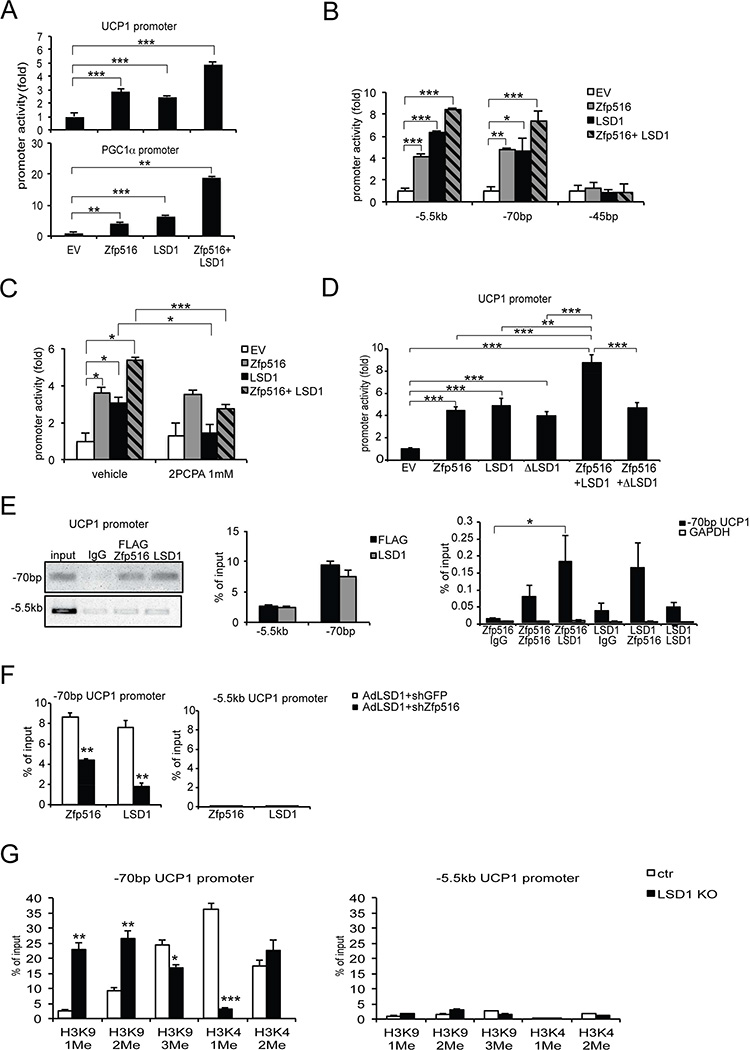
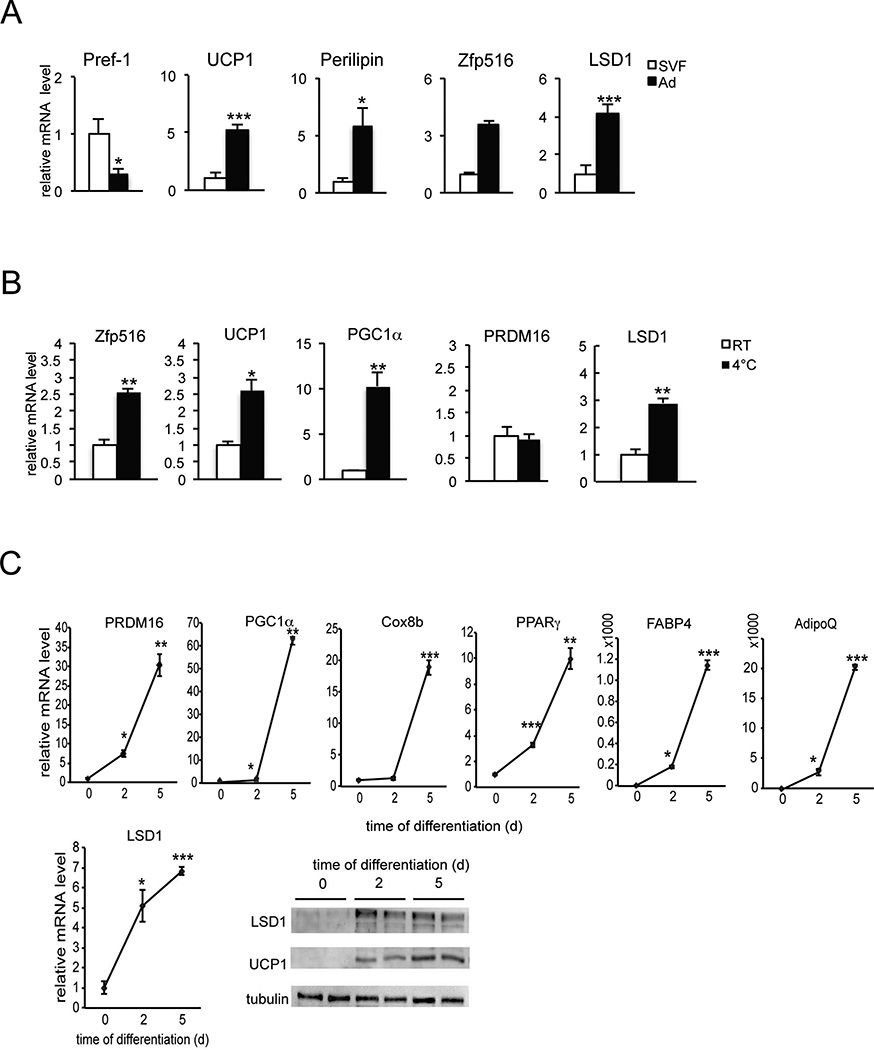
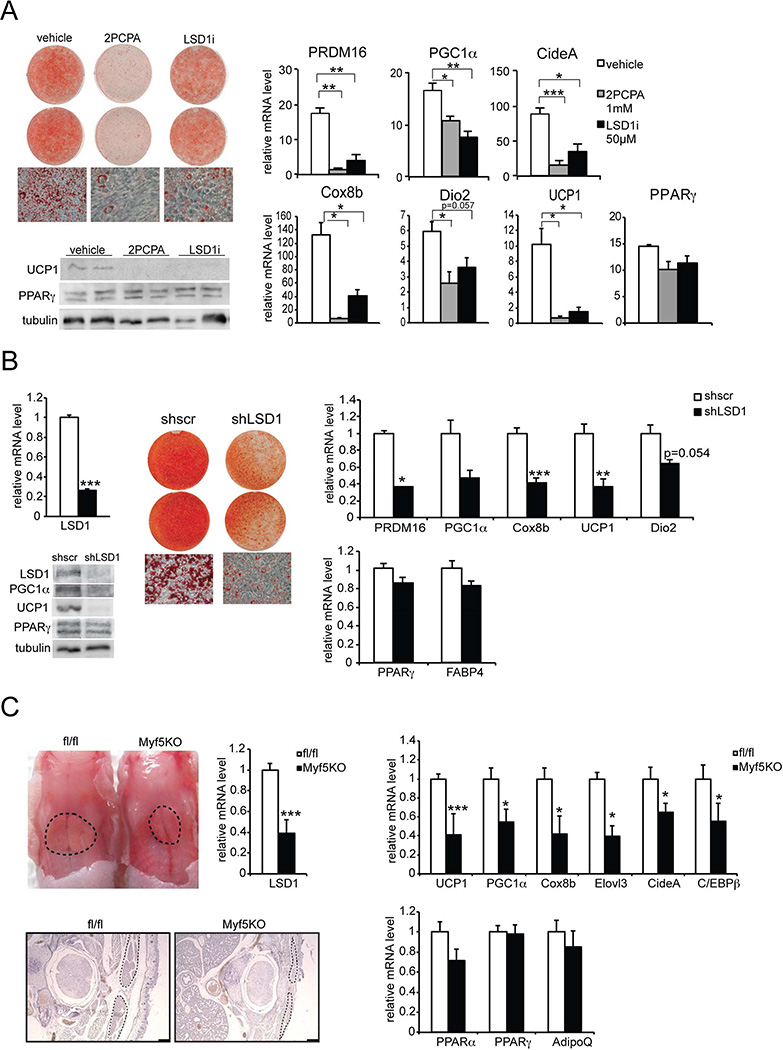
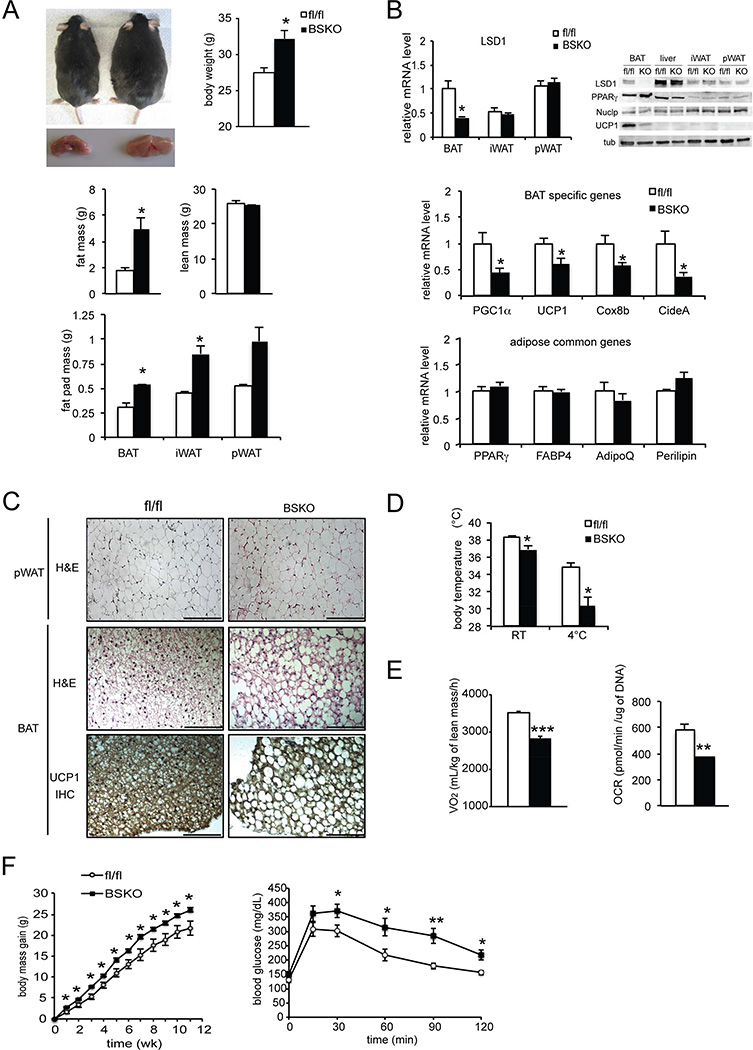
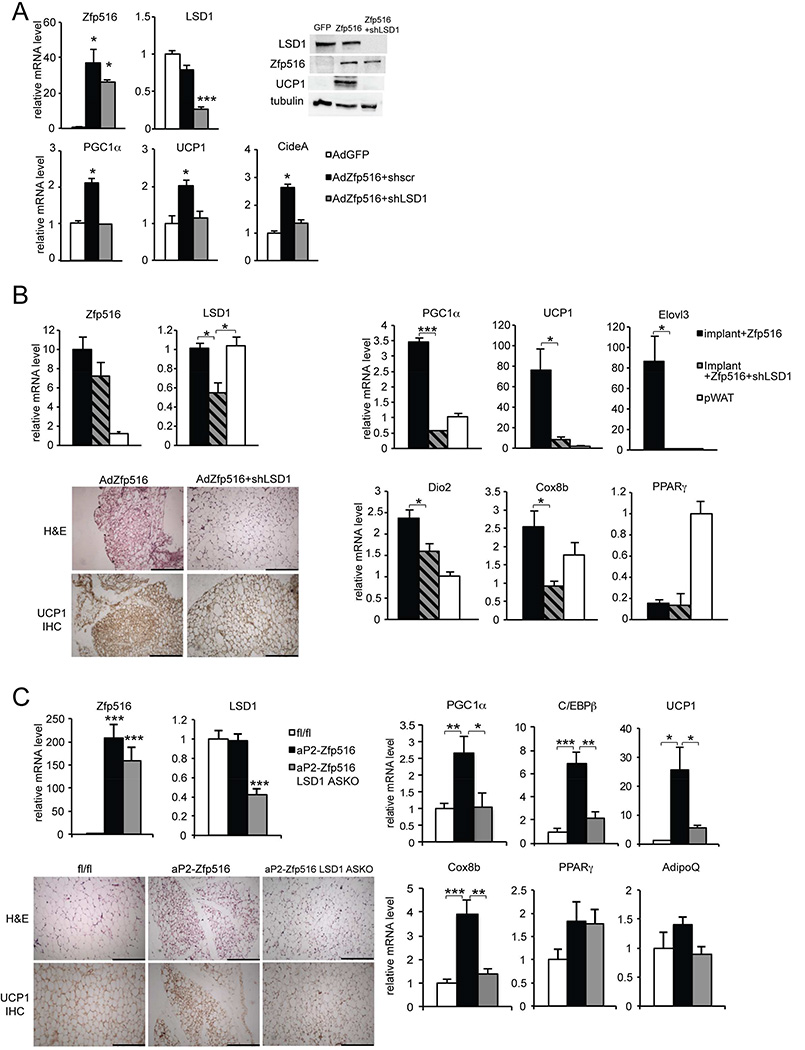
Zfp516, a brown fat (BAT)-enriched and cold-inducible transcription factor, promotes transcription of UCP1 and other BAT-enriched genes for non-shivering thermogenesis. Here, we identify lysine-specific demethylase 1 (LSD1) as a direct binding partner of Zfp516. We show that, through interaction with Zfp516, LSD1 is recruited to UCP1 and other BAT-enriched genes, such as PGC1α, to function as a coactivator by demethylating H3K9. We also show that LSD1 is induced during brown adipogenesis and that LSD1 and its demethylase activity is required for the BAT program. Furthermore, we show that LSD1 ablation in mice using Myf5-Cre alters embryonic BAT development. Moreover, BAT-specific deletion of LSD1 via the use of UCP1-Cre impairs the BAT program and BAT development, making BAT resemble WAT, reducing thermogenic activity and promoting obesity. Finally, we demonstrate an in vivo requirement of the Zfp516-LSD1 interaction for LSD1 function in BAT gene activation.


Figures

Figure 1
Figure 1. LSD1 directly interacts with Zfp516
A. Immunoblot using αFLAG (Top) or αMyc (center) after immunoprecipitation with either αMyc or αFLAG, respectively, of HEK 293FT cell lysates transfected with FLAG-Zfp516 and c-Myc-LSD1 either together or individually. Bottom, immunoblot for endogenous LSD1 after immunoprecipitation of lysates from differentiated BAT cells or BAT tissue with α-Zfp516. B. Top, schematic representation of GST-LSD1 deletion constructs. Center, Coomassie staining for indicated GST constructs. Bottom, autoradiograph of GST pulldown using GST fusion proteins containing the indicated domains of LSD1 and 35S-labelled in vitro translated Zfp516. Solid line shows lane position moved within the same blot. C. Immunoblot using αMyc (top-left) or αFLAG (top-right) after immunoprecipitation with either αFLAG or αMyc respectively, of lysates from 293FT cells transfected with FLAG-Zfp516 and either Myc-LSD1 full length (FL) or deleted Myc-ΔLSD1 1-474 (Δ), together or individually. Immunoblots of input for the corresponding lysate are shown on bottom-left and -right. See also Figure S1.
Figure 2
Figure 2. Zfp516 recruits LSD1 to activate the UCP1 promoter
A. Top, luciferase activity in 293FT cells cotransfected with the −5.5kb UCP1 promoter or empty vector (EV), along with Zfp516 and LSD1 expression vectors either together or individually. Bottom, luciferase activity in cells cotransfected with the −2.4kb PGC1α promoter or empty vector (EV) along with Zfp516 and LSD1 vectors either together or individually. B. Luciferase activity in cells cotransfected with the −5.5kb, −70 bp or −45 bp UCP1 promoter or empty vector (EV), along with Zfp516 and LSD1 vectors either together or individually. C. Luciferase activity in cells cotransfected with the −5.5kb UCP1 promoter and empty vector (EV), along with Zfp516 and LSD1 vectors either together or individually after treatment with LSD1 inhibitor (2PCPA 1mM) or vehicle for 48 h. D. Luciferase activity incells cotransfected with the −5.5kb UCP1 promoter and empty vector (EV), along with Zfp516 and either LSD1 full length (FL) or deleted ΔLSD1 1-474. E. Left, ChIP for Zfp516 and LSD1 binding at the −70 bp region of UCP1 promoter using both αFlag and αLSD1 for chromatin of BAT cells infected with Zfp516 and LSD1 adenoviruses. The −5.5 kb region of UCP1 promoter was used as a negative control. Center, qPCR of ChIP DNA. Right, ReChIP for Zfp516 and LSD1 binding to the UCP1 promoter region in BAT cells using IgG, αZfp516 or αLSD1 as indicated. F. Left, ChIP for Zfp516 and LSD1 binding to the −70 bp region of the UCP1 promoter in BAT cells using both αZfp516 and αLSD1 with LSD1 overexpression and Zfp516 knockdown (shZfp516), compared to negative control (shGFP). Right, GAPDH promoter was used as a negative control. G. ChIP analysis of histone H3 methylations at the −70 bp region of UCP1 promoter (left) or at the GAPDH promoter as a negative control (right) in ChIP of BAT tissue from control (fl/fl) or LSD1 knockout (LSD1KO) mice. Data are represented as mean ± SEM. *p<0.05; **p<0.01; ***p<0.001. See also Figure S2.
Figure 3
Figure 3. LSD1 is increased during brown adipocyte differentiation and is induced by cold exposure in BAT
A. RT-qPCR for indicated gene in the adipocyte fraction and SVF from BAT. B. RT-qPCR for indicated gene in BAT of wild-type mice exposed to cold (4°C) for 6h. C. Top, RT-qPCR for indicated gene in BAT cells at Day 0, 2 and 5 after the start of differentiation. Bottom, LSD1 mRNA level (top) and immunoblot (bottom) for indicated proteins in BAT cells at Day 0, 2 and 5 of differentiation. Data are represented as mean ± SEM. *p<0.05; **p<0.01; ***p<0.001
Figure 4
Figure 4. LSD1 is required for the BAT program and BAT development
A. Left-top, ORO staining and brightfield view (20× magnification) of BAT cells treated with vehicle (left panel) or LSD1 inhibitors: 2PCPA (center panel) and LSD1i (right panel), at Day 6 of differentiation. Left-bottom, immunoblotting for indicated proteins in lysates from BAT cells at Day 6. Right, RT-qPCR for indicated genes in BAT cells treated with vehicle (left panel) or LSD1 inhibitors at Day 6. B. Left, RT-qPCR for LSD1 mRNA in BAT cells infected with control scrambled (shscr) or shLSD1 adenovirus at Day 6 (top). Immunoblot for indicated proteins in BAT cells at Day 6 (bottom). Center, ORO staining and brightfield views (20× magnification) of BAT cells infected with control shscr (left panel) or shLSD1 (right panel) adenovirus at Day 6. Right, RT-qPCR for indicated genes in BAT cells infected with control shscr or shLSD1 adenovirus at Day 6. C. Top-left, representative photograph of control (fl/fl) and LSD1fl/fl-Myf5Cre (Myf5KO) newborn embryos (P0) from back view. Black dots delineate area of BAT. RT-qPCR for LSD1 mRNA in BAT of control and Myf5KO embryos (n=8–9 embryos per group). Bottom-left, H&E staining of representative transversal sections of the interscapular region of control and Myf5 KO embryos (P0). Black dots delineate area of BAT. Right, RT-qPCR for BAT-enriched (top) and common adipose genes (bottom) in BAT of control or Myf5KO embryos (n=8–9 embryos per group). Data are represented as mean ± SEM.*p<0.05; **p<0.01; ***p<0.001.
Figure 5
Figure 5. LSD1 promotes a BAT gene program in vivo
A. Top-left, representative photograph of control and LSD1 BSKO 17 wk-old mice and their BAT depot. Top-right, body weight of 14 wk-old control and LSD1 BSKO mice. Center, fat and lean mass of 14 wk-old control and LSD1 BSKO mice determined using EchoMRI. Bottom, mass of adipose depots from mice described above. B. Top, RT-qPCR for LSD1 mRNA in adipose tissue depots of control and LSD1 BSKO mice (left) and immunoblot for indicated proteins BAT, liver, iWAT and pWAT of control and LSD1 BSKO mice (right). Center, RT-qPCR for BAT-enriched genes in BAT of control and LSD1 BSKO mice. Bottom, RT-qPCR for common adipose genes in BAT of control and LSD1 BSKO mice. C. H&E staining of pWAT sections from control and LSD1 BSKO mice (top). H&E staining (center) and immunostaining for UCP1 (bottom) of BAT sections from control and LSD1 BSKO mice. D. Top, body temperature from control and LSD1 BSKO mice at 23°C and after a 6h cold exposure at 4°C. E. Left, VO2 consumption measured by indirect calorimetry in control and LSD1 BSKO mice on chow diet (NCD) at room temperature (23°C) (n=7 mice per group). Right, Oxygen Consumption Rate (OCR) of BAT from control and LSD1 BSKO mice. F. Left, body mass gain of control and BSKO mice under high fat diet (HFD) starting at 6 wks of age (n=6–8 mice per group). Right, Glucose tolerance test (GTT) on 16wk-old control and BSKO mice under HFD for 10 wk (n=6–8 mice per group). Scale bars represent 200µm. Data are represented as mean ± SEM. *p<0.05; **p<0.01; ***p<0.001. See also Figure S3.
Figure 6
Figure 6. Zfp516-LSD1 interaction is required for browning of iWAT
A. Top, RT-qPCR for LSD1 and Zfp516 mRNA in 3T3-L1 cells coinfected with either control AdGFP or AdZfp516 and control shscr or shLSD1 adenovirus at Day 7 of differentiation (left). Immunoblot for indicated proteins in lysates from infected 3T3-L1 cells at Day 7 (right). Bottom, RT-qPCR for BAT-enriched genes in infected 3T3-L1 cells at Day 7. B. Left, RT-qPCR for LSD1 and Zfp516 mRNA in implants and pWAT from mice implanted with 3T3-L1 cells infected with either AdZfp516 + shscr (control) or AdZfp516 + shLSD1 (top). H&E staining (upper panels) and immunostaining for UCP1 (lower panels) of sections of implants described above (bottom). Right, RT-qPCR for BAT-enriched genes and adipose common genes in implants and pWAT described above. (n=6 mice per group). C. Left, RT-qPCR for LSD1 and Zfp516 mRNA in iWAT from 8 wk-old control (fl/fl), aP2-Zfp516 and aP2-Zfp516 ASKO mice (n=6–8 mice per group). H&E staining (upper panels) and immunostaining for UCP1 (lower panels) in sections of iWAT from mice described above. Scale bars represent 200µm. Right, RT-qPCR for BAT-enriched or common adipose genes in iWAT from mice described above. Data are represented as mean ± SEM.*p<0.05; **p<0.01; ***p<0.001. See also Figure S4, S5 and S6.

References

    1. Ambrosio R, Damiano V, Sibilio A, De Stefano MA, Avvedimento VE, Salvatore D, Dentice M. Epigenetic control of type 2 and 3 deiodinases in myogenesis: role of Lysine-specific Demethylase enzyme and FoxO3. Nucleic acids research. 2013;41:3551–3562. - PMC - PubMed
    1. Bartelt A, Bruns OT, Reimer R, Hohenberg H, Ittrich H, Peldschus K, Kaul MG, Tromsdorf UI, Weller H, Waurisch C, et al. Brown adipose tissue activity controls triglyceride clearance. Nature medicine. 2011;17:200–205. - PubMed
    1. Choi J, Jang H, Kim H, Kim ST, Cho EJ, Youn HD. Histone demethylase LSD1 is required to induce skeletal muscle differentiation by regulating myogenic factors. Biochemical and biophysical research communications. 2010;401:327–332. - PubMed
    1. Collins S, Yehuda-Shnaidman E, Wang H. Positive and negative control of Ucp1 gene transcription and the role of beta-adrenergic signaling networks. International journal of obesity (2005) 2010;34(Suppl 1):S28–S33. - PubMed
    1. Cypess AM, Lehman S, Williams G, Tal I, Rodman D, Goldfine AB, Kuo FC, Palmer EL, Tseng YH, Doria A, et al. Identification and importance of brown adipose tissue in adult humans. The New England journal of medicine. 2009;360:1509–1517. - PMC - PubMed