. 2016 Jun 14;15(11):2475-87.
doi: 10.1016/j.celrep.2016.05.020. Epub 2016 Jun 2.

Two Mutually Exclusive Local Chromatin States Drive Efficient V(D)J Recombination

Affiliations

Two Mutually Exclusive Local Chromatin States Drive Efficient V(D)J Recombination

Daniel J Bolland et al. Cell Rep. .

Abstract

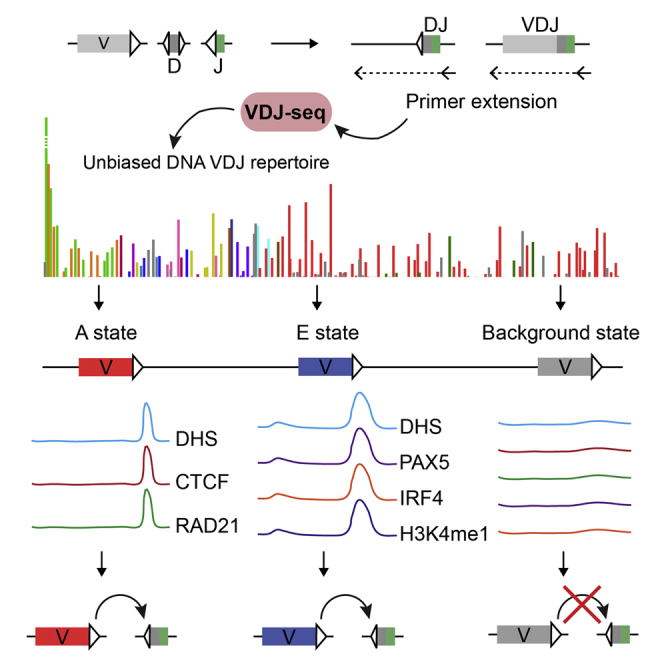
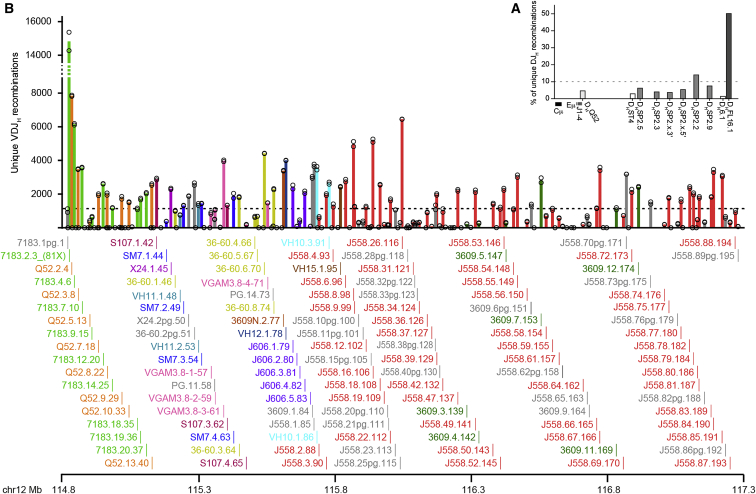
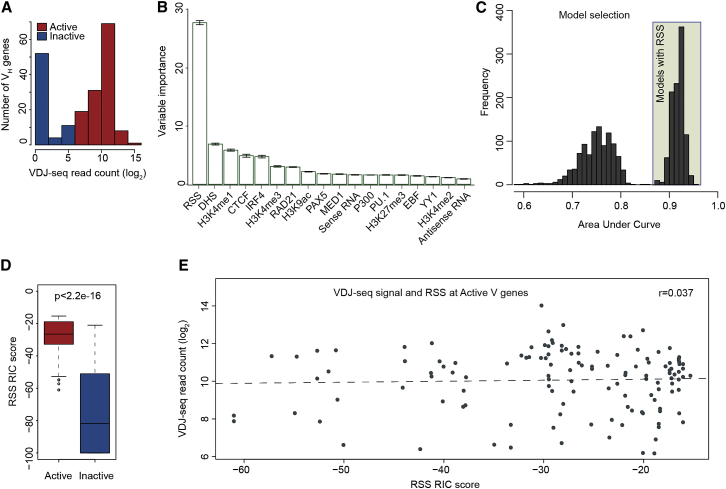
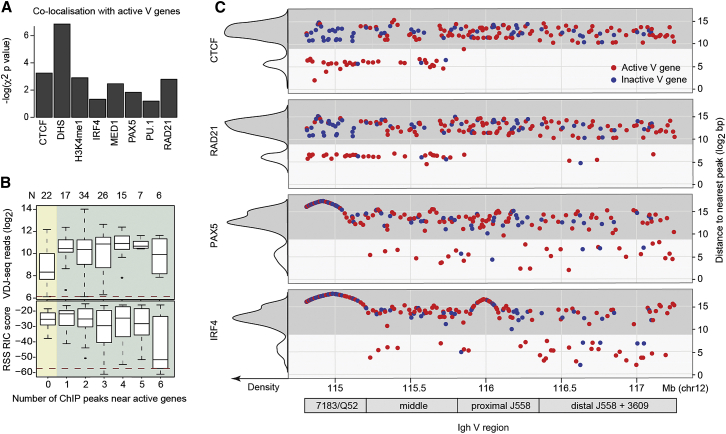
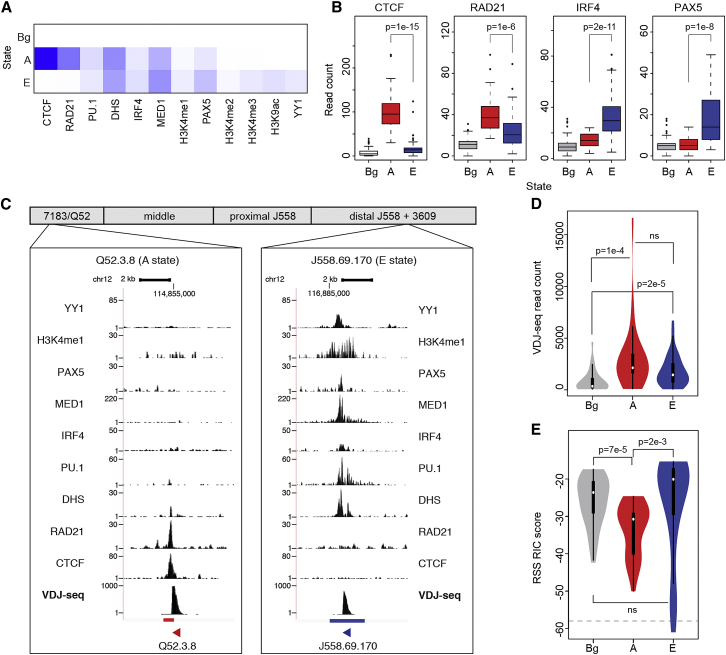
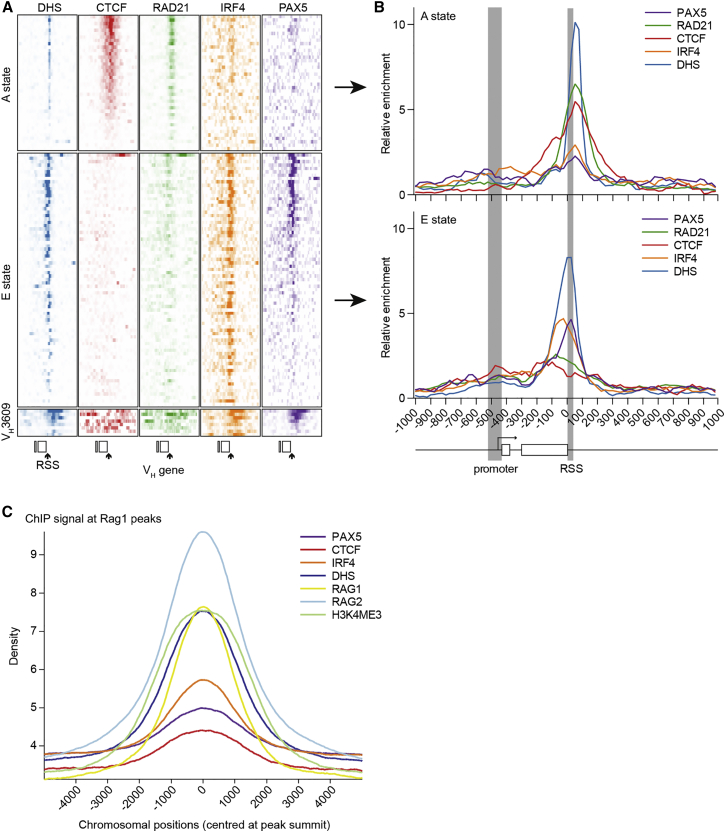
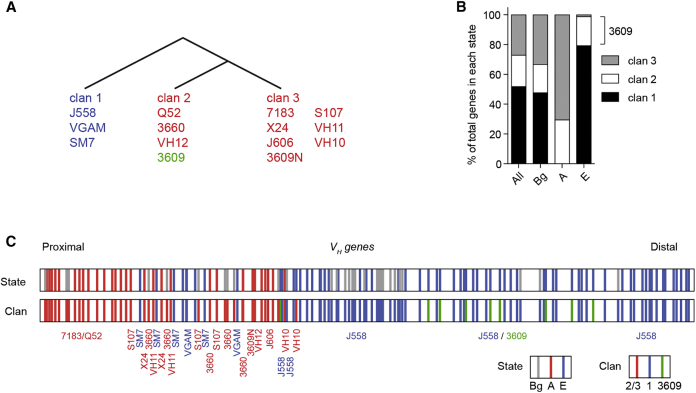
Variable (V), diversity (D), and joining (J) (V(D)J) recombination is the first determinant of antigen receptor diversity. Understanding how recombination is regulated requires a comprehensive, unbiased readout of V gene usage. We have developed VDJ sequencing (VDJ-seq), a DNA-based next-generation-sequencing technique that quantitatively profiles recombination products. We reveal a 200-fold range of recombination efficiency among recombining V genes in the primary mouse Igh repertoire. We used machine learning to integrate these data with local chromatin profiles to identify combinatorial patterns of epigenetic features that associate with active VH gene recombination. These features localize downstream of VH genes and are excised by recombination, revealing a class of cis-regulatory element that governs recombination, distinct from expression. We detect two mutually exclusive chromatin signatures at these elements, characterized by CTCF/RAD21 and PAX5/IRF4, which segregate with the evolutionary history of associated VH genes. Thus, local chromatin signatures downstream of VH genes provide an essential layer of regulation that determines recombination efficiency.


Figures

None
Graphical abstract
Figure 1
Figure 1
The VDJ-Seq Technique (A) Genomic DNA from sorted pro-B cells (1) containing unknown VDJH and DJH joins (only VDJH depicted) is sonicated to 500 bp (2), end-repaired, A-tailed, and a custom adaptor ligated (3). Primer-extension is performed with forward and reverse primers that hybridize upstream of each JH gene (4). Following depletion of unrecombined primer-extended DNA with streptavidin beads (4), a second primer-extension is performed extending upstream into VDJH or DJH recombined sequences from biotinylated primers that hybridize downstream of each JH (5). After capture with streptavidin beads, two rounds of PCR generate the sequencing library; the first using adaptor-specific paired-end 1 (PE1) and J-specific paired-end 2 (PE2) primers (6), the second using flow-cell PE1 and PE2 primers (7) to generate the library (8). (B) Differentiation of early B cell progenitors in bone marrow showing when DH-to-JH and VH-to-DJH joining occur. Rag1−/− mice are incapable of V(D)J recombination. See also Figures S1 and S3.
Figure 2
Figure 2
VDJ-Seq Reveals Widely Varying DH and VH Gene Recombination (A) DH gene recombination. Reads per DH gene were counted using Seqmonk for each WT pro-B replicate, normalized to the replicate with the lowest total read count for all DH genes then expressed as a percentage of the total (Data S1). Bars indicate the mean of these values. Replicate values are not shown as DH usage was almost identical between the two replicates. Dotted line, expected value if recombination was equal for all ten DH genes. (B) Recombination frequencies of the 195 VH genes. Reads for each VH gene were counted for each replicate then normalized to the replicate with the lowest total read count for all VH genes (Data S1) and are shown as open circles. Bars indicate the mean of these values for each VH gene, colored by family. Dotted line, expected frequency if recombination was equal for all VH genes. Individual gene names for actively recombining VH genes (determined by binomial testing) are shown below together with map position on mouse chromosome 12. See also Figures S2, S4, and S7.
Figure 3
Figure 3
Random Forest Classification Identifies RSS as a Binary Switch for VH Gene Recombination but with No Predictive Value for Recombination Frequency (A) Frequency distribution of VDJ-seq read counts for 195 VH genes, color-coded as active (recombining) or inactive (non-recombining) using a binomial test to gauge the significance of the recombination level. Red: active fdr-adjusted (p value <0.01); blue: inactive fdr-adjusted (p value ≥0.01). (B) Average of out-of-bag variable importance (the gini impurity) in predicting active genes from a Random Forest classifier applied on 18 factors. Error bars show the SEs from a 10-fold cross validation procedure to further control for overfitting. Variables with high gini importance were consistent with the permutation importance measure (data not shown). (C) Distribution of area under curve (AUC) scores from 2,048 RF models derived from all possible combinations of the 11 most important factors from the RF classifier. (D) RSS RIC scores of active versus inactive VH genes. (E) RSS RIC scores at active genes show little correlation with rates of recombination of individual VH genes.
Figure 4
Figure 4
Epigenetic Factors Co-localize with VH Genes (A) P values from a χ2 test to gauge the significance level of the observed number of actively recombining genes that co-localize with eight factors compared to the number expected if co-localization was randomly distributed between active and inactive V genes. A value of 1.3 (log10 of 0.05) or above indicates significant association with active V genes. The remaining factors are not co-localized (Figure S5A). (B) Relationship between the number of factor peaks associated with VH genes and recombination frequency (upper panel) and RSS RIC scores (lower panel). Dashed red lines indicate the threshold VDJ-seq read count for active VH genes (upper panel) and the pass/fail RSS RIC score threshold (lower panel). Numbers of VH genes in each group are shown above. (C) Distances from VH genes to the nearest peaks for CTCF, RAD21, PAX5, and IRF4 exhibit bimodality (see also Figure S5B). The subset of VH genes with nearby peaks (≤1 kb, light shading) was enriched for active genes (red). The curves in the left hand y axis illustrate the frequency of genes in each group. Chromosomal position and location within the VH region are shown below. See also Figure S5.
Figure 5
Figure 5
Identification of Chromatin States across the VH Locus (A) ChromHMM emission probability (composition) of 12 epigenetic factors in three chromatin states: background (Bg), architectural (A), and enhancer (E). Range, zero (white) to 1 (dark blue). (B) Comparison of the significance of the read counts for CTCF, RAD21, PAX5, and IRF4 in the three states (Figure S6A; remaining eight factors). (C) Examples of recombining genes in the A (enriched for CTCF and RAD21) and E (enriched for DHS, PAX5, YY1, H3K4me1, MED1, PU.1, and IRF4) states. (D and E) Comparison of VDJ-seq read counts (D) and RSS RIC scores (E) for active genes in each of the three states. P values are driven by Wilcoxon test. See also Figure S6.
Figure 6
Figure 6
Epigenetic Factors Are Specifically Enriched at the VH RSS (A) Aligned region plot for the 2 kb centered on the RSS for VH genes in the two active states and the VH3609 outlier family. This shows enrichment for DHS, CTCF, and RAD21 for the A state and DHS, IRF4, and PAX5 for the E state. Enrichment is localized close to the RSS in all cases. (B) Line graph of average relative enrichment for each factor for genes in the A and E states. (C) Signal intensity at genome-wide Rag1-ChIP peaks. Signal intensity of five features (chosen to represent both regulatory states) and Rag2 at 3388 Rag1 peaks (Teng et al., 2015). Density defined as normalized log-based read counts in 2 kb regions centered at the summit of peaks.
Figure 7
Figure 7
Regulatory States Co-segregate with Evolutionary VH Clans (A) Evolutionary organization of V gene families in clans. (B) Relationship between regulatory states and evolutionary VH clans. (C) Geographical position of actively recombining VH genes overlapping the three states (top) and VH clans (bottom) across the mouse VH region. Clans 2 and 3 are colored the same (red) to reflect their overlap in state classification (A). The VH3609 family is colored green to denote its outlier status as an E state, but clan 2, family. Co-switching of the A and E states with clans 2+3 and 1, respectively, can be seen for the middle families. See also Figure S6D.

References

    1. Alamyar E., Giudicelli V., Li S., Duroux P., Lefranc M.-P. IMGT/HighV-QUEST: the IMGT web portal for immunoglobulin (IG) or antibody and T cell receptor (TR) analysis from NGS high throughput and deep sequencing. Immunome Res. 2012;8:26.
    1. Baumann M., Mamais A., McBlane F., Xiao H., Boyes J. Regulation of V(D)J recombination by nucleosome positioning at recombination signal sequences. EMBO J. 2003;22:5197–5207. - PMC - PubMed
    1. Benichou J., Ben-Hamo R., Louzoun Y., Efroni S. Rep-Seq: uncovering the immunological repertoire through next-generation sequencing. Immunology. 2012;135:183–191. - PMC - PubMed
    1. Bevington S., Boyes J. Transcription-coupled eviction of histones H2A/H2B governs V(D)J recombination. EMBO J. 2013;32:1381–1392. - PMC - PubMed
    1. Bolland D.J., Wood A.L., Johnston C.M., Bunting S.F., Morgan G., Chakalova L., Fraser P.J., Corcoran A.E. Antisense intergenic transcription in V(D)J recombination. Nat. Immunol. 2004;5:630–637. - PubMed

Publication types