. 2016 Jun 14;15(11):2462-74.
doi: 10.1016/j.celrep.2016.05.025. Epub 2016 Jun 2.

Distinct Transcriptional Programs Control Cross-Priming in Classical and Monocyte-Derived Dendritic Cells

Affiliations

Distinct Transcriptional Programs Control Cross-Priming in Classical and Monocyte-Derived Dendritic Cells

Carlos G Briseño et al. Cell Rep. .

Abstract

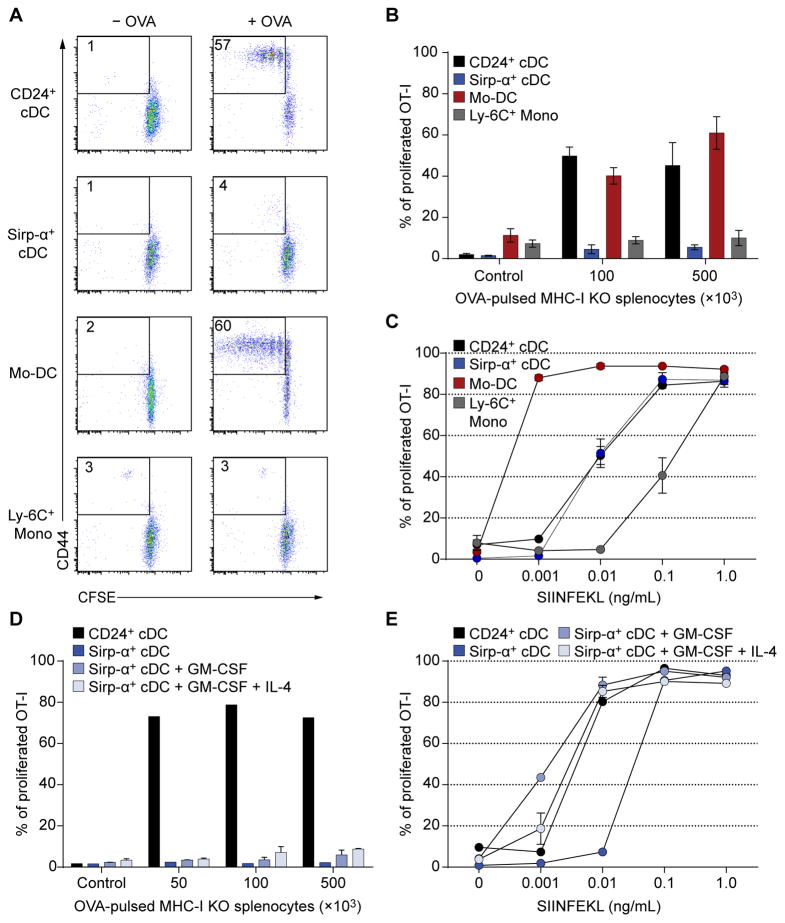
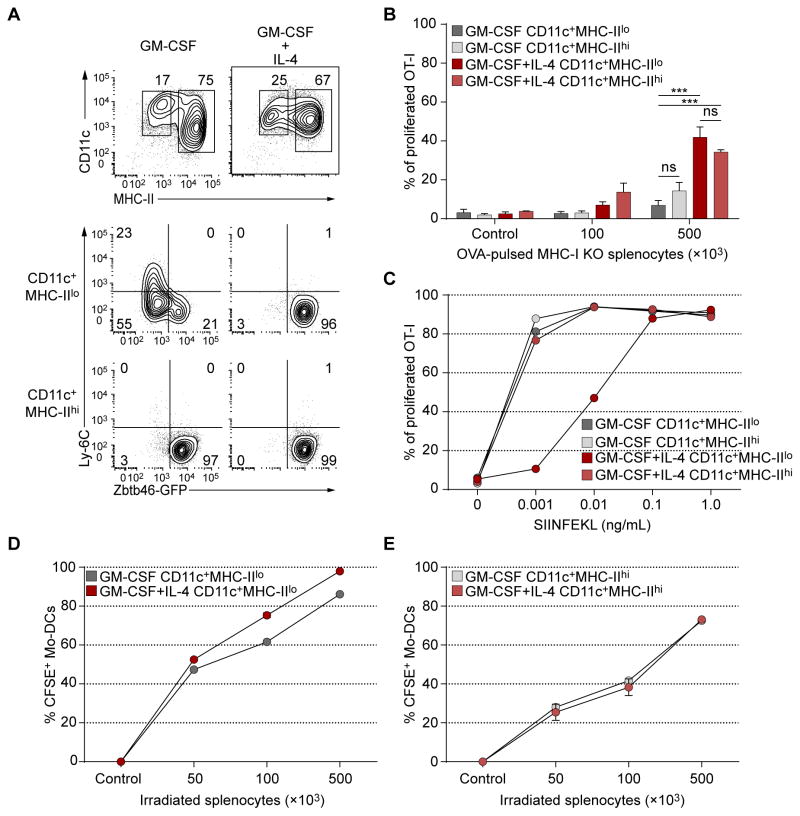
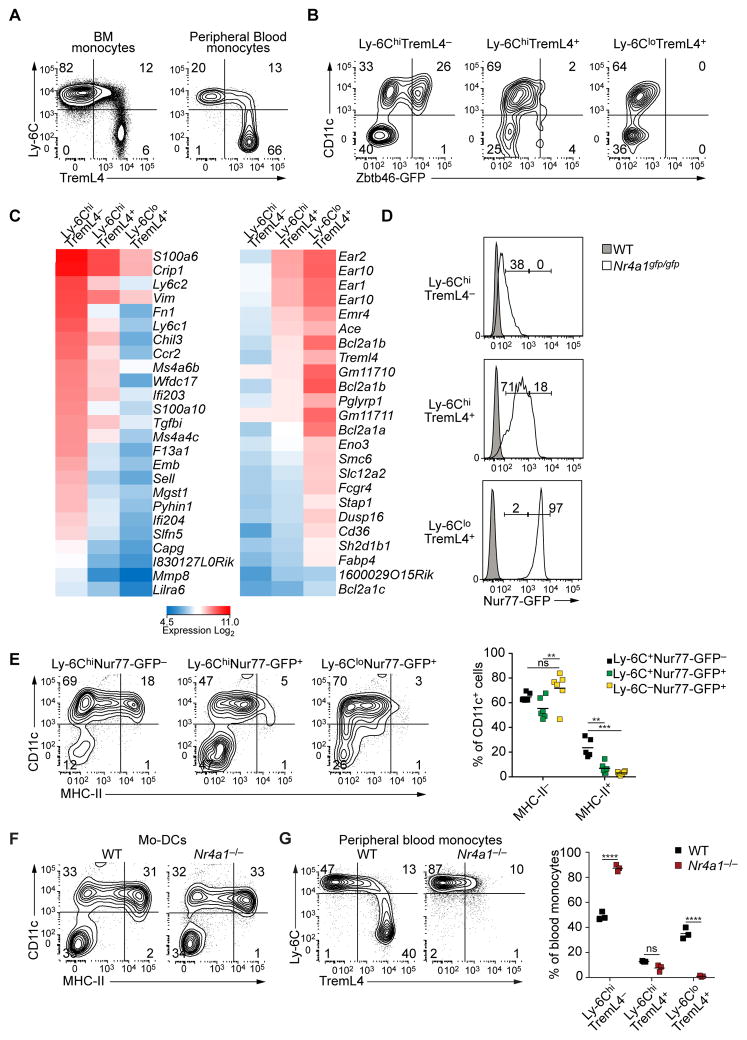
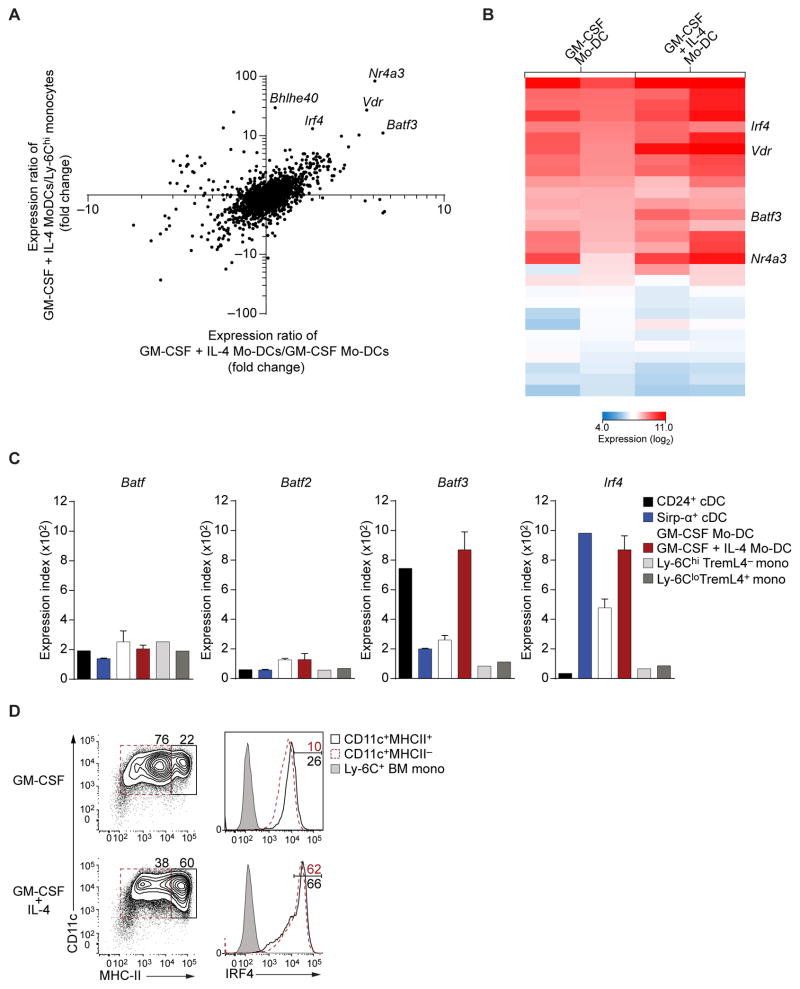
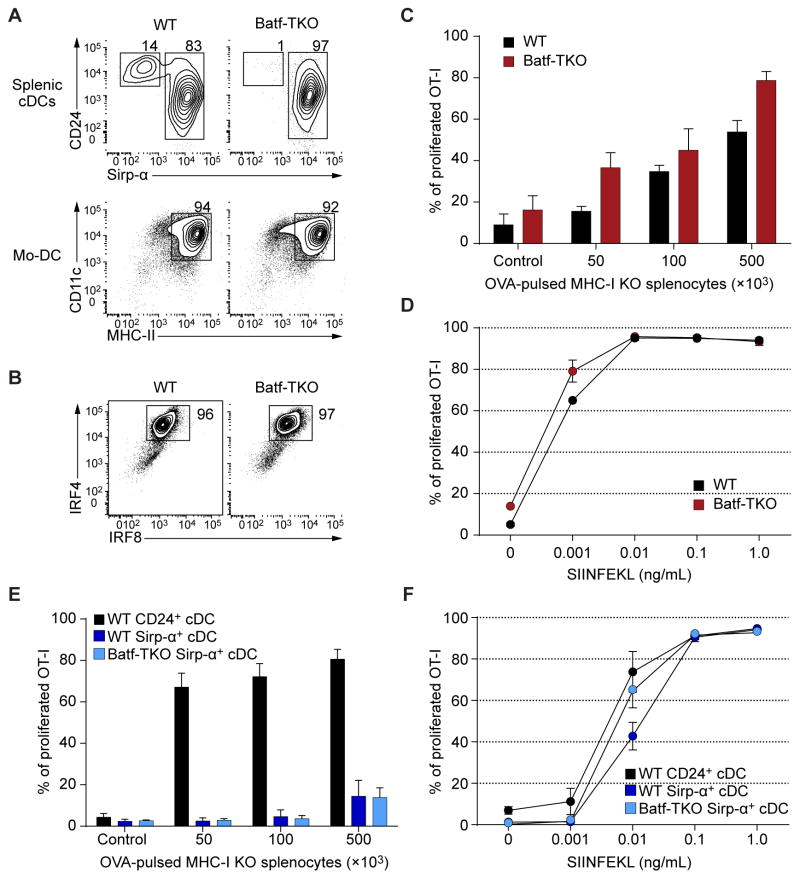
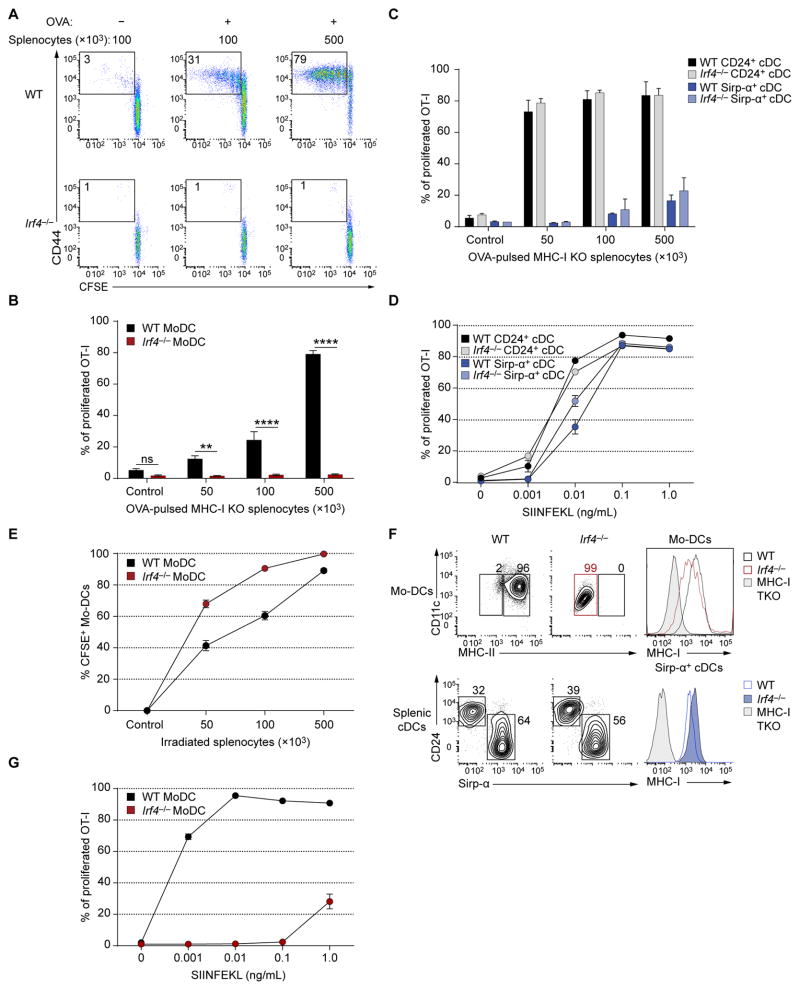
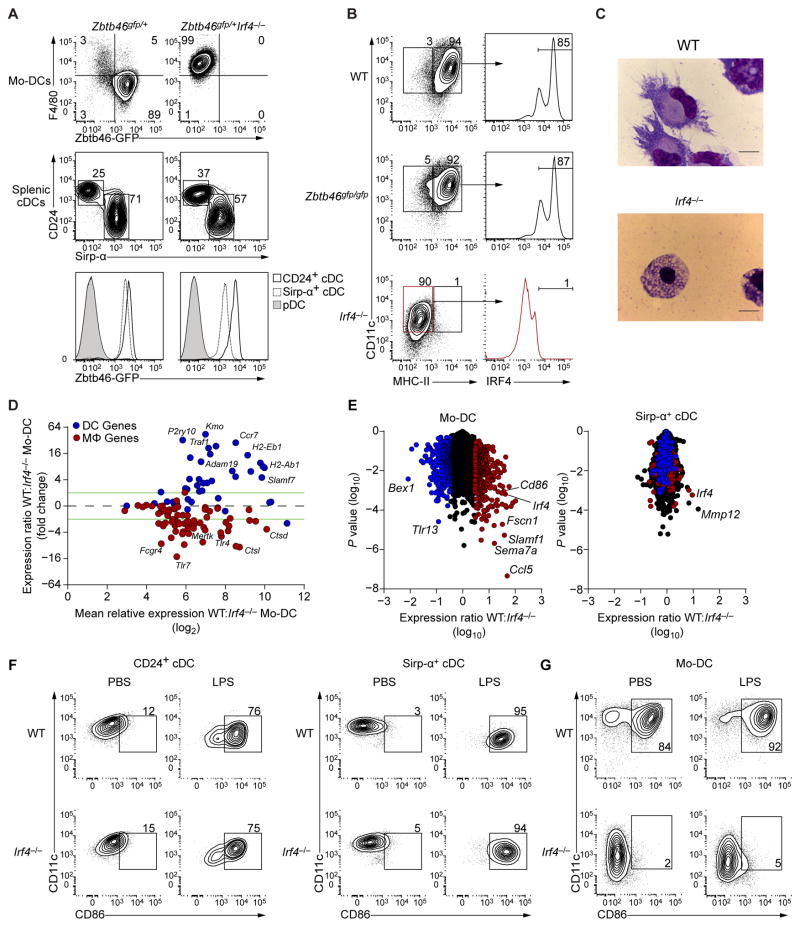
Both classical DCs (cDCs) and monocyte-derived DCs (Mo-DCs) are capable of cross-priming CD8(+) T cells in response to cell-associated antigens. We found that Ly-6C(hi)TREML4(-) monocytes can differentiate into Zbtb46(+) Mo-DCs in response to granulocyte-macrophage colony-stimulating factor (GM-CSF) and interleukin-4 (IL-4) but that Ly-6C(hi)TREML4(+) monocytes were committed to differentiate into Ly-6C(lo)TREML4(+) monocytes. Differentiation of Zbtb46(+) Mo-DCs capable of efficient cross-priming required both GM-CSF and IL-4 and was accompanied by the induction of Batf3 and Irf4. However, monocytes require IRF4, but not BATF3, to differentiate into Zbtb46(+) Mo-DCs capable of cross-priming CD8(+) T cells. Instead, Irf4(-/-) monocytes differentiate into macrophages in response to GM-CSF and IL-4. Thus, cDCs and Mo-DCs require distinct transcriptional programs of differentiation in acquiring the capacity to prime CD8(+) T cells. These differences may be of consideration in the use of therapeutic DC vaccines based on Mo-DCs.


Conflict of interest statement

The authors declare no competing financial interests.

Figures

Figure 1
Figure 1. Mo-DCs, but not Sirp-α+ cDCs, cross-present cell-associated antigen as efficiently as CD24+ cDCs
(A, B) Splenic CD24+ and Sirp-α+ cDCs, BM Ly-6Chi monocytes and Mo-DCs cultured in GM-CSF + IL-4 were purified by cell sorting. APCs were co-cultured with CFSE-labeled OT-1 cells and the indicated number of OVA-loaded γ-irradiated Kb−/−Db−/−β2m−/− (MHC-I TKO) splenocytes. OT-I cells were analyzed after three days by flow cytometry. (A) Representative flow cytometry analysis of OT-I proliferation after cross-presentation assay. (B) Summary of OT-I proliferation after cell-associated cross-presentation assay determined as the percentage of CD44+ OT-I cells that had at least one CFSE dilution. n=3 biological replicates per group; control: 1×10⁵ γ-irradiated MHC-I TKO splenocytes without OVA. (C) SIINFEKL peptide presentation by sorted splenic CD24+ and Sirp-α+ cDCs, BM Ly-6Chi monocytes and Mo-DCs. OT-I cell proliferation was analyzed by flow cytometry three days after culture. n=2 biological replicates per group. (D, E) Sorted splenic Sirp-α+ cDCs were cultured in GM-CSF with or without IL-4 for two days and tested for cross-presentation (D) as in A and for SIINFEKL peptide presentation (E) as in C. Sorted splenic CD24+ and Sirp-α+ cDCs without treatment were used as positive and negative controls respectively; n=2 biological replicates per group.
Figure 2
Figure 2. Mo-DCs require IL-4 treatment during differentiation for optimal cross-priming
(A) Ly-6Chi BM monocytes from Zbtb46gfp/+ mice were sorted and cultured in GM-CSF with or without IL-4 for 4 days, and analyzed by flow cytometry for expression of Zbtb46-GFP. Data are representative of three independent experiments. (B) WT Mo-DCs were generated as in A. CD11c+ Mo-DCs were then sorted as MHC-II or MHC-II+ and co-cultured with CFSE-labeled OT-I cells and OVA-loaded γ-irradiated MHC-I TKO splenocytes. OT-I proliferation was analyzed by flow cytometry after three days. Data are pooled from three independent experiments, with at least 4 biological replicates per group. Two-way analysis of variance (ANOVA) with Sidak’s multiple comparison test; n.s. not significant; ***P<0.001. (C) SIINFEKL peptide presentation by Mo-DCs to CFSE labelled OT-I cells. OT-I proliferation was analyzed on the third day as in B. n=2 biological replicates per group. (D, E) Mo-DCs were sorted as in B, and co-cultured with γ-irradiated CFSE labelled CD45.1+ splenocytes for 16 hours. Uptake of apoptotic cells was determined as the percentage of CD45.2+CD45.1CD11c+ Mo-DCs that were CFSE+. n=2 biological replicates per group.
Figure 3
Figure 3. TREML4 identifies a subset of Ly-6Chi monocytes committed to macrophage-lineage differentiation
(A) Flow cytometry of bone marrow (BM) and peripheral blood (PB) cells from WT mice. BM monocytes were gated as Ter-119B220Ly-6GCD117CD135CD11cMHC-IICD115+CD11b+ live cells. PB monocytes were gated as CD45.2+B220Ter-119MHC-IILy-6GCD115+CD11b+ live cells. Data is representative of three independent experiments. (B) Ly-6ChiTREML4, Ly-6ChiTREML4+ and Ly-6CloTREML4+ monocytes were sorted from PB of Zbtb46gfp/+ mice, cultured in GM-CSF and IL-4 for 3 days and analyzed by flow cytometry for Zbtb46-GFP expression. Data are representative of three independent experiments. (C) Gene expression microarray analysis of sorted Ly-6ChiTREML4, Ly-6ChiTREML4+, Ly-6CloTREML4+ PB monocytes. Shown are genes that were at least 3-fold different between Ly-6ChiTREML4 and Ly-6CloTREML4+ monocytes. (D) Flow cytometry analysis of Nur77-GFP expression in the indicated monocyte populations from peripheral blood of Nr4a1gfp/+ mice. Monocytes were pre-gated as in A. (E) Sorted Ly-6ChiNur77-GFP, Ly-6ChiNur-77GFP+, Ly-6CloNur77-GFP+ peripheral blood monocytes from Nr4a1gfp/gfp mice were cultured as in B. Left panels show representative two-color histograms for CD11c and MHC-II expression. Right panel shows summarized data; each dot represents a biological replicate. n=6 biological replicates from two independent experiments. (F) Sorted Ly-6ChiTREML4 PB monocytes from Nr4a1−/− and WT littermate controls were cultured as in B and analyzed by flow cytometry. Data are representative of three independent experiments. (G) Flow cytometry analysis of PB from WT and Nr4a1−/− mice. Cells were gated as in A. Right panel shows summarized data; each dot represents a biological replicate; two-way analysis of variance (ANOVA) with Sidak’s multiple comparison test; n.s. not significant, **P<0.01; ***P<0.001; ****P<0.0001. See also Figure S1.
Figure 4
Figure 4. Mo-DCs induce expression of Batf3 and Irf4 in response to IL-4
(A) Gene expression microarray analysis of Ly-6Chi monocytes and Mo-DCs differentiated with GM-CSF alone or GM-CSF and IL-4. Shown is the ratio of expression in Mo-DCs generated with GM-CSF and IL-4 versus that of Mo-DCs generated with GM-CSF alone (horizontal axis) plotted against the ratio of expression in Mo-DCs generated with GM-CSF and IL-4 versus that in monocytes (vertical axis) for all transcription factor-encoding genes. (B) Gene expression of transcription factors induced at least 2-fold in Mo-DCs cultured with IL-4 relative to Mo-DCs cultured with GM-CSF alone. Shown are biological replicates for each cell lineage. (C) Relative expression of Batf, Batf2, Batf3 and Irf4 from microarrays of the indicated cell type. (D) Representative intracellular flow cytometry analysis of sorted Ly-6ChiTREML4 BM monocytes cultured in GM-CSF with or without IL-4. Ly-6C+ BM monocytes are shown as control. Data is representative of three independent experiments.
Figure 5
Figure 5. Mo-DCs do not require BATF3 for differentation into APCs capable of cross-priming
(A) Flow cytometry analysis of splenocytes and Mo-DCs generated with GM-CSF and IL-4 from WT and Batf−/−Batf2−/−Batf3−/− (Batf-TKO) mice. Splenic cDCs are pre-gated as B220CD11c+MHC-II+ cells. Mo-DCs are gated as Ly-6C cells. Data are representative of two independent experiments. (B) Intracellular flow cytometry analysis for IRF4 and IRF8 in WT and Batf-TKO Mo-DCs. Data is representative of three independent experiments. (C) Cross-presentation of cell-associated antigen by WT and Batf-TKO Mo-DCs. Percent proliferation was determined as the percentage of CD44+ OT-I cells that had undergone at least one CFSE dilution. n=3 biological replicates per group; control: 1×10⁵ γ-irradiated MHC-I TKO splenocytes without OVA. (D) SIINFEKL peptide presentation by WT and Batf-TKO Mo-DCs. OT-I proliferation was analyzed by flow cytometry as in C after three days of culture. n=2 biological replicates per group. (E) Cell-associated cross-presentation assay by Batf-TKO Sirp-α+ cDCs as in C.Splenic WT CD24+ and Sirp-α+ cDCs were used as controls. (F) SIINFEKL peptide presentation by WT CD24+ and Sirp-α+ cDCs and Batf-TKO Sirp-α+ cDCs as in D, n=2 biological replicates per group.
Figure 6
Figure 6. Mo-DCs require IRF4 for cross-priming CD8+ T cells to cell-associated antigen
(A, B) Cross-presentation of cell-associated antigen by WT and Irf4−/− Mo-DCs. OT-I cell proliferation was analyzed by flow cytometry three days after culture. (A) Representative two color histograms of OT-I cell proliferation after cross-presentation assay. (B) Summary of cell-associated cross-presentation by WT and Irf4−/− Mo-DCs. Percent proliferation of OT-I cells was determined as CD44+ OT-I cells that had undergone at least one CFSE dilution. Data are pooled from 6 biological replicates per group; control: 1×10⁵ γ-irradiated MHC-I TKO splenocytes without OVA. (C) Cross-presentation of cell-associated antigen by sorted CD24+ and Sirp-α+ DCs from spleens of WT and Irf4−/− mice as in A; n=2 biological replicates per group. (D) SIINFEKL peptide presentation by splenic CD24+ and Sirp-α+ DCs from WT and Irf4−/− mice; n=2 biological replicates per group. (E) Apoptotic cell uptake after by WT and Irf4−/− Mo-DCs after 16 hours of culture. Cells were analyzed by flow cytometry, pre-gated as CD45.2+CD45.1CD11c+; n=2 biological replicates per group. (F) Flow cytometry analysis of WT and Irf4−/− ex vivo derived Mo-DCs and splenic cDCs. Splenic cDCs were gated as B220SiglecHCD11c+MHC-II+. One-color histograms show MHC-I expression for the indicated populations. Cells from MHC-I TKO mice are shown as control. Data are representative of three biological replicates. (G) SIINFEKL peptide presentation assay by WT and Irf4−/− Mo-DCs. OT-I proliferation was measured as in A; n=3 biological replicates per group. Two-way analysis of variance (ANOVA) with Sidak’s multiple comparison test; n.s. not significant, **P<0.01, ****P<0.0001.
Figure 7
Figure 7. Irf4−/− monocytes divert to macrophages upon GM-CSF and IL-4 signaling
(A) Flow cytometry analysis of Zbtb46 expression in Mo-DCs generated with GM-CSF and IL-4 and splenic cDCs from Zbtb46gfp/+ and Zbtb46gfp/+Irf4−/− mice. Splenic cDCs were gated as B220CD11c+MHC-II+, pDCs are shown as negative control. Data are representative of three independent experiments. (B) Flow cytometry analysis of WT, Zbtb46gfp/gfp and Irf4−/− Mo-DCs generated as in A. Expression of IRF4 in the indicated gates is shown in right panels. Data are representative of three biological replicates per group. (C) Microscopy of WT and Irf4−/− Mo-DCs stained with Wright-Giemsa stain. Scale bars: 10μm. (D) MA plot of the expression ratio of DC and macrophage (MΦ) specific genes from (Miller et al., 2012; Gautier et al., 2012) in WT and Irf4−/− Mo-DCs. (E) Gene expression analysis of Mo-DCs and splenic Sirp-α+ cDCs from WT and Irf4−/− mice. Colors indicate expression three fold higher (red) or lower (blue) in WT MoDCs than in Irf4−/− Mo-DCs. Welch’s t test, P value (vertical axis). (F, G) Flow cytometry analysis of sorted CD24+ and Sirp-α+ splenic DCs (F) and Mo-DCs (G) from WT or Irf4−/− mice treated with LPS for 16 hours. Data is representative of two independent experiments.

References

    1. Aldridge JR, Jr, Moseley CE, Boltz DA, Negovetich NJ, Reynolds C, Franks J, Brown SA, Doherty PC, Webster RG, Thomas PG. TNF/iNOS-producing dendritic cells are the necessary evil of lethal influenza virus infection. Proc Natl Acad Sci U S A. 2009;106:5306–5311. - PMC - PubMed
    1. Auffray C, Fogg DK, Narni-Mancinelli E, Senechal B, Trouillet C, Saederup N, Leemput J, Bigot K, Campisi L, Abitbol M, et al. CX3CR1+ CD115+ CD135+ common macrophage/DC precursors and the role of CX3CR1 in their response to inflammation. J Exp Med. 2009;206:595–606. - PMC - PubMed
    1. Bajana S, Roach K, Turner S, Paul J, Kovats S. IRF4 promotes cutaneous dendritic cell migration to lymph nodes during homeostasis and inflammation. J Immunol. 2012;189:3368–3377. - PMC - PubMed
    1. Ballesteros-Tato A, Leon B, Lund FE, Randall TD. Temporal changes in dendritic cell subsets, cross-priming and costimulation via CD70 control CD8(+) T cell responses to influenza. Nat Immunol 2010 - PMC - PubMed
    1. Becker M, Guttler S, Bachem A, Hartung E, Mora A, Jakel A, Hutloff A, Henn V, Mages HW, Gurka S, Kroczek RA. Ontogenic, Phenotypic, and Functional Characterization of XCR1(+) Dendritic Cells Leads to a Consistent Classification of Intestinal Dendritic Cells Based on the Expression of XCR1 and SIRPalpha. Front Immunol. 2014;5:326. - PMC - PubMed

Publication types

MeSH terms

Substances