

Perceptual Modalities Guiding Bat Flight in a Native Habitat
- PMID: 27264498
- PMCID: PMC4893665
- DOI: 10.1038/srep27252
Perceptual Modalities Guiding Bat Flight in a Native Habitat
Abstract
Flying animals accomplish high-speed navigation through fields of obstacles using a suite of sensory modalities that blend spatial memory with input from vision, tactile sensing, and, in the case of most bats and some other animals, echolocation. Although a good deal of previous research has been focused on the role of individual modes of sensing in animal locomotion, our understanding of sensory integration and the interplay among modalities is still meager. To understand how bats integrate sensory input from echolocation, vision, and spatial memory, we conducted an experiment in which bats flying in their natural habitat were challenged over the course of several evening emergences with a novel obstacle placed in their flight path. Our analysis of reconstructed flight data suggests that vision, echolocation, and spatial memory together with the possible exercise of an ability in using predictive navigation are mutually reinforcing aspects of a composite perceptual system that guides flight. Together with the recent development in robotics, our paper points to the possible interpretation that while each stream of sensory information plays an important role in bat navigation, it is the emergent effects of combining modalities that enable bats to fly through complex spaces.
Figures

 . The heading delay (a concept similar to the directional correlation delay introduced by Nagy et al.19) of the bat pair is then defined as
  that corresponds to the maximum value of Cij(τ) as visualized in (b).
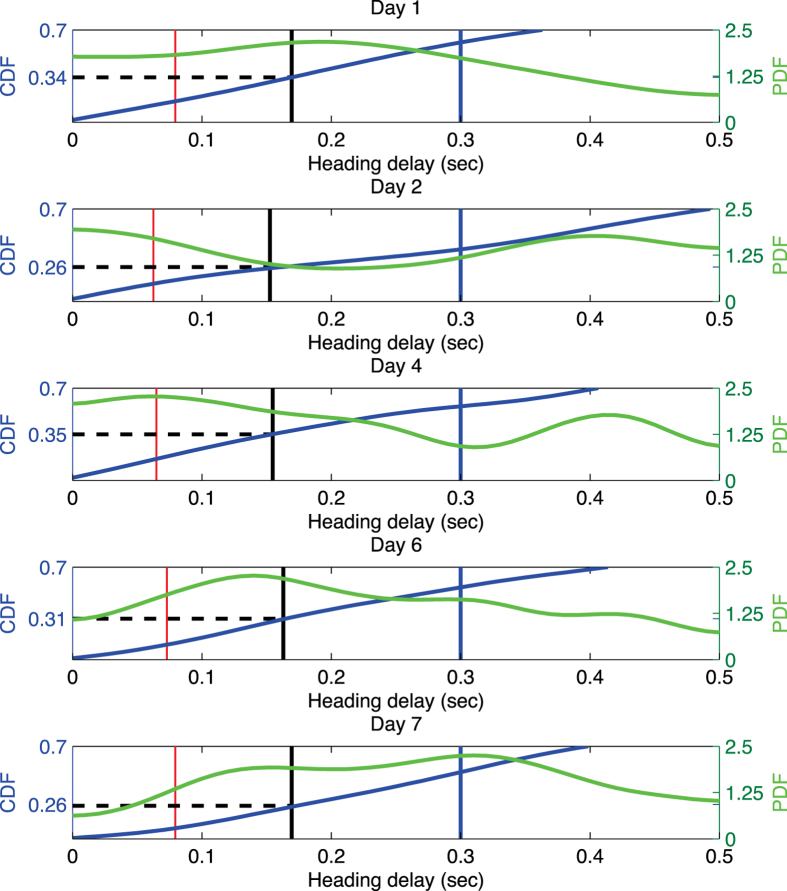
Similar articles
-
Integrating vision and echolocation for navigation and perception in bats.Sci Adv. 2019 Jun 26;5(6):eaaw6503. doi: 10.1126/sciadv.aaw6503. eCollection 2019 Jun. Sci Adv. 2019. PMID: 31249874 Free PMC article.
-
Interaction of vestibular, echolocation, and visual modalities guiding flight by the big brown bat, Eptesicus fuscus.J Vestib Res. 2004;14(1):17-32. J Vestib Res. 2004. PMID: 15156093
-
Vision impairs the abilities of bats to avoid colliding with stationary obstacles.PLoS One. 2010 Nov 9;5(11):e13912. doi: 10.1371/journal.pone.0013912. PLoS One. 2010. PMID: 21085481 Free PMC article.
-
Bat echolocation calls: adaptation and convergent evolution.Proc Biol Sci. 2007 Apr 7;274(1612):905-12. doi: 10.1098/rspb.2006.0200. Proc Biol Sci. 2007. PMID: 17251105 Free PMC article. Review.
-
PRINCIPLES AND PATTERNS OF BAT MOVEMENTS: FROM AERODYNAMICS TO ECOLOGY.Q Rev Biol. 2017 Sep;92(3):267-287. doi: 10.1086/693847. Q Rev Biol. 2017. PMID: 29861509 Free PMC article. Review.
Cited by
-
Symmetry and reduction in collectives: low-dimensional cyclic pursuit.Proc Math Phys Eng Sci. 2016 Oct;472(2194):20160465. doi: 10.1098/rspa.2016.0465. Proc Math Phys Eng Sci. 2016. PMID: 27843405 Free PMC article.
-
Inconspicuous echolocation in hoary bats (Lasiurus cinereus).Proc Biol Sci. 2018 May 16;285(1878):20180441. doi: 10.1098/rspb.2018.0441. Proc Biol Sci. 2018. PMID: 29720417 Free PMC article.
-
Learning from animals: How to Navigate Complex Terrains.PLoS Comput Biol. 2020 Jan 9;16(1):e1007452. doi: 10.1371/journal.pcbi.1007452. eCollection 2020 Jan. PLoS Comput Biol. 2020. PMID: 31917816 Free PMC article.
-
Extracting Interactions between Flying Bat Pairs Using Model-Free Methods.Entropy (Basel). 2019 Jan 9;21(1):42. doi: 10.3390/e21010042. Entropy (Basel). 2019. PMID: 33266758 Free PMC article.
References
-
- Barchi J. R., Knowles J. M. & Simmons J. A. Spatial memory and stereotypy of flight paths by big brown bats in cluttered surroundings. J. Exp. Biol. 216, 1053–1063 (2013). - PubMed
-
- Straw A. D., Lee S. & Dickinson M. H. Visual control of altitude in flying drosophila. Curr. Biol. 20, 1550–1556 (2010). - PubMed
-
- Fukushi T. & Wehner R. Navigation in wood ants Formica japonica: context dependent use of landmarks. J. Exp. Biol. 207, 3431–3439 (2004). - PubMed
-
- Geva-Sagiv M., Las L., Yovel Y. & Ulanovsky N. Spatial cognition in bats and rats: from sensory acquisition to multiscale maps and navigation. Nat. Rev. Neurosci. 16, 94–108 (2015). - PubMed
Publication types
MeSH terms
LinkOut - more resources
Full Text Sources
Other Literature Sources
