. 2016 Jun 16;165(7):1708-1720.
doi: 10.1016/j.cell.2016.05.018. Epub 2016 Jun 2.

The Colonic Crypt Protects Stem Cells from Microbiota-Derived Metabolites

Affiliations

The Colonic Crypt Protects Stem Cells from Microbiota-Derived Metabolites

Gerard E Kaiko et al. Cell. .

Erratum in

Abstract

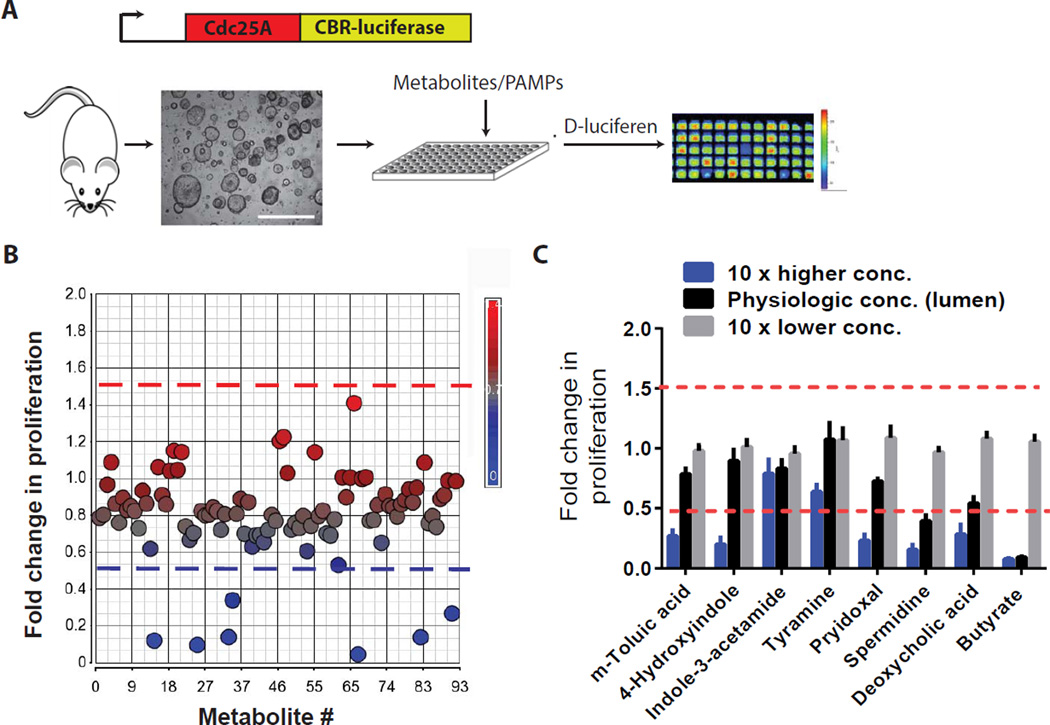
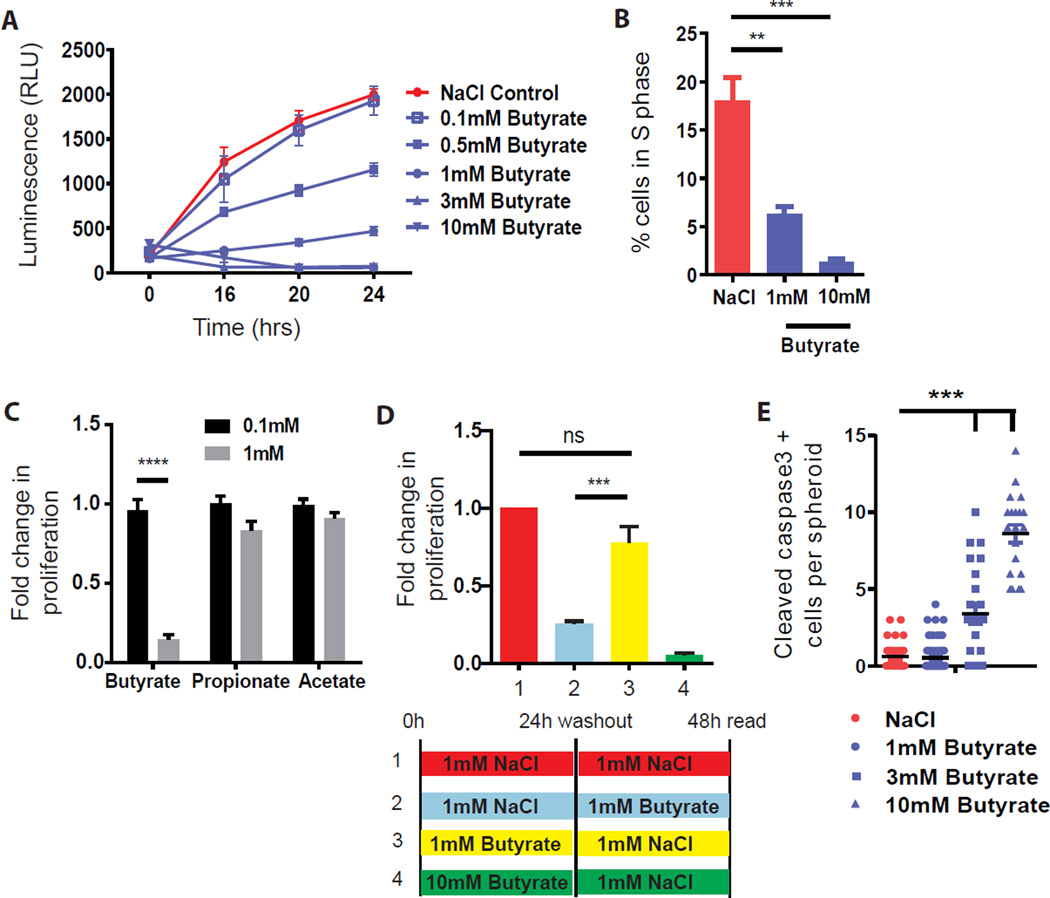
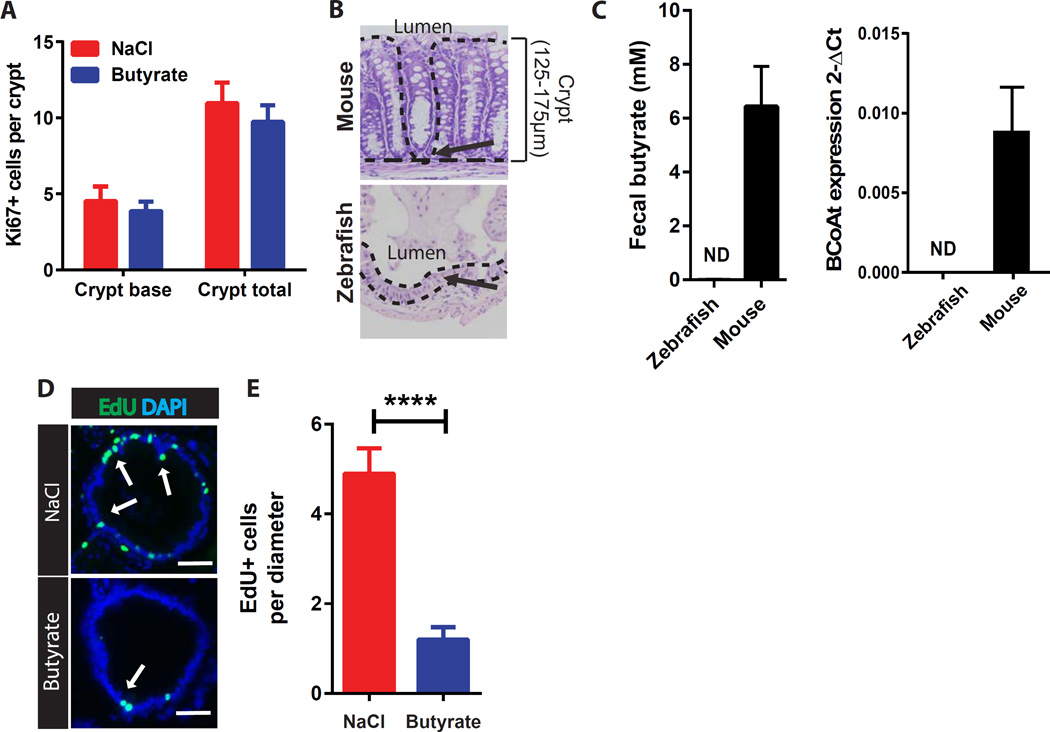
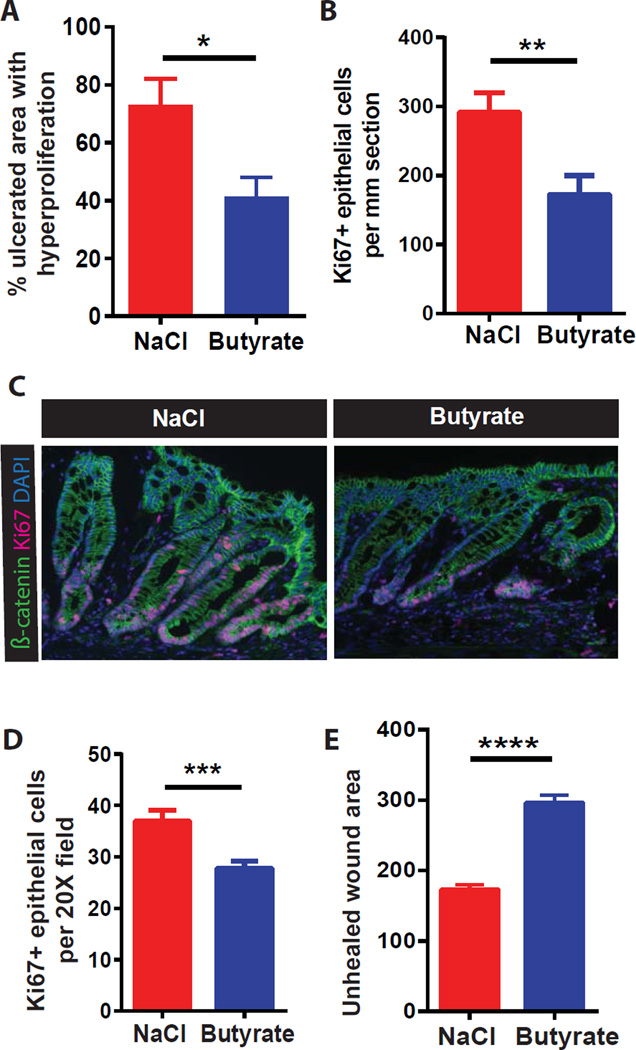
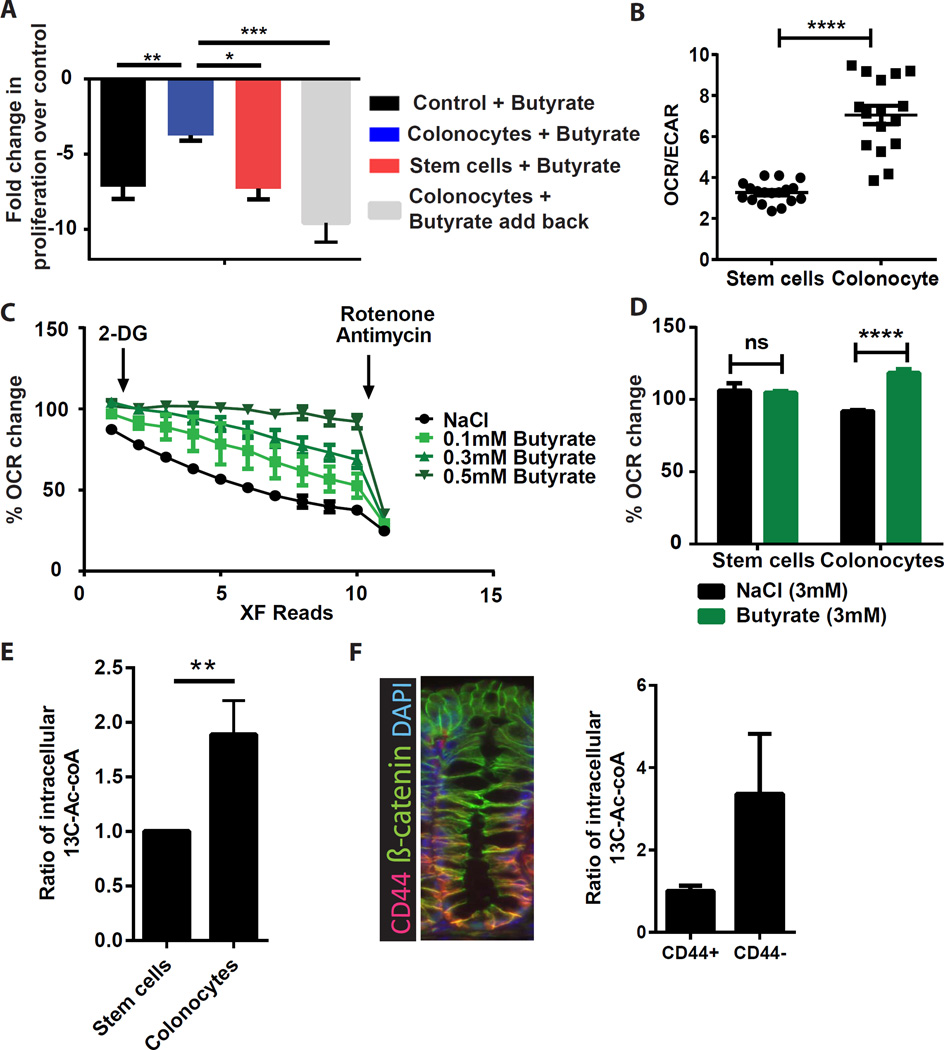
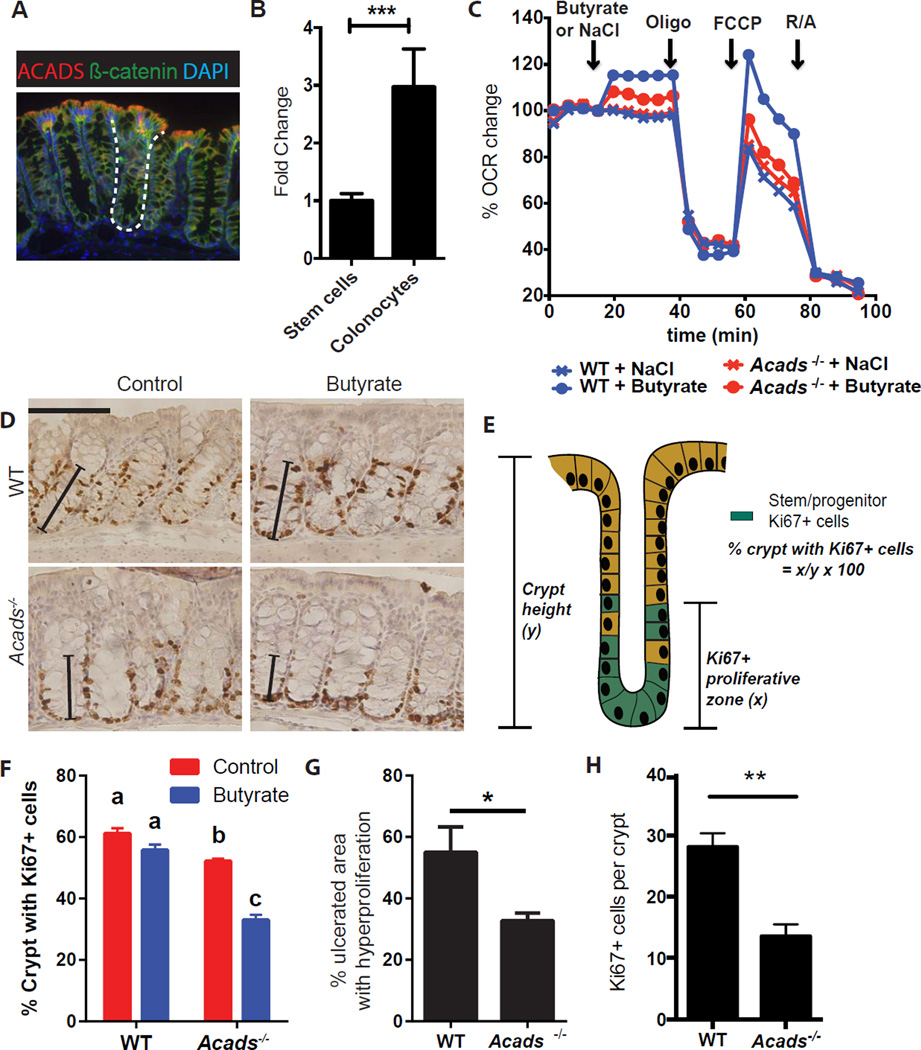
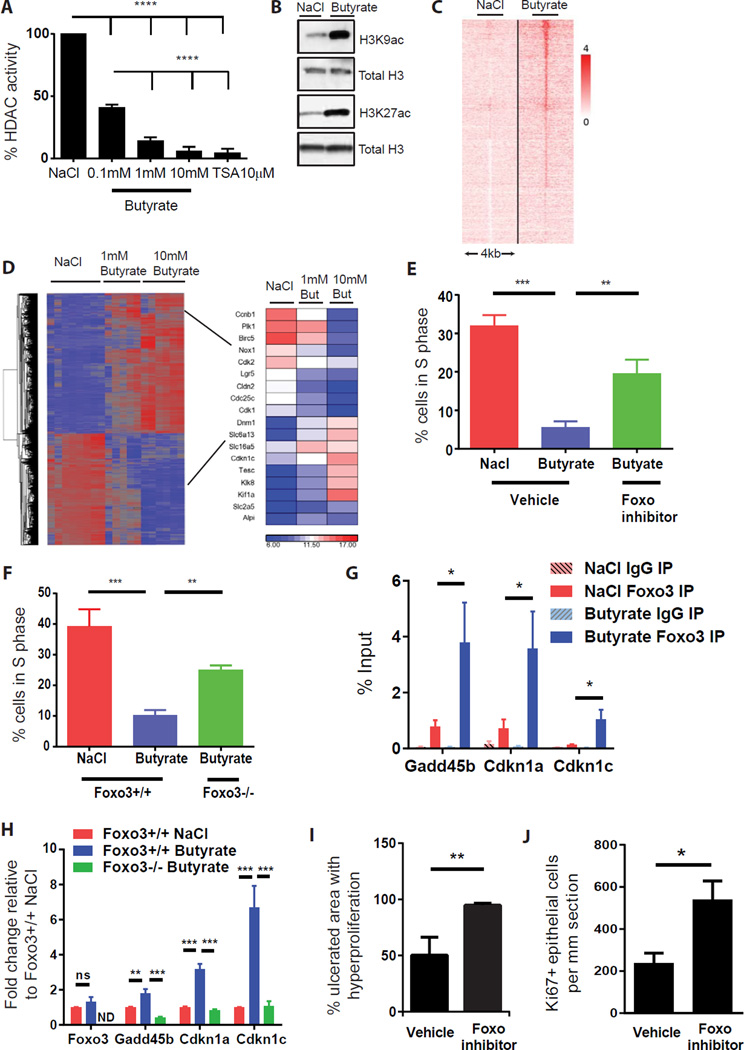
In the mammalian intestine, crypts of Leiberkühn house intestinal epithelial stem/progenitor cells at their base. The mammalian intestine also harbors a diverse array of microbial metabolite compounds that potentially modulate stem/progenitor cell activity. Unbiased screening identified butyrate, a prominent bacterial metabolite, as a potent inhibitor of intestinal stem/progenitor proliferation at physiologic concentrations. During homeostasis, differentiated colonocytes metabolized butyrate likely preventing it from reaching proliferating epithelial stem/progenitor cells within the crypt. Exposure of stem/progenitor cells in vivo to butyrate through either mucosal injury or application to a naturally crypt-less host organism led to inhibition of proliferation and delayed wound repair. The mechanism of butyrate action depended on the transcription factor Foxo3. Our findings indicate that mammalian crypt architecture protects stem/progenitor cell proliferation in part through a metabolic barrier formed by differentiated colonocytes that consume butyrate and stimulate future studies on the interplay of host anatomy and microbiome metabolism.


Conflict of interest statement

Authors with no conflict of interest.

Figures

Figure 1
Figure 1. Large-scale screen identifies a microbial-derived metabolite as a potent suppressor of colonic epithelial stem/progenitor cells
(A) Assay schematic for screen. Colonic stem/progenitor cells from Cdc25a-luciferase mice were cultured with individual microbial-associated metabolites and PAMPs and luminescence assayed. (B) Scatter plot displaying fold-change luminescence (24 hrs) for each individual metabolite/PAMP versus vehicle. Dashed lines indicate significance thresholds (>1.5-fold and <0.5-fold; N=4/metabolite) (C) Dose plots for each candidate metabolite identified in B. (N=4 experiments). All values, mean±SEM. See Figure S1 and Supplementary Table 1.
Figure 2
Figure 2. Butyrate but no other SCFAs suppress colonic epithelial stem/progenitor cell proliferation
(A) Dose curve of butyrate on proliferation (N=8–20 experiments). (B) Percentage of S-phase cells 24 hrs post-treatment with NaCl or butyrate (N=3), one-way ANOVA ***p<0.001, **p<0.01. (C) Fold-change in proliferation (24 hrs) post-treatment with short chain fatty acids (butyrate, propionate, and acetate) (N=4 experiments), ANOVA ****p<0.0001 (D) Stem/progenitor cells were pre-treated for 24h with either 1mM NaCl, 1mM butyrate, or 10mM butyrate followed by a wash out, then re-incubated in NaCl or butyrate, proliferation was measured 24h later. Fold change in proliferation compared to the NaCl control (N=10 experiments), one-way ANOVA ***p<0.001, ns; not significant. (E) Number of cleaved caspase 3 positive cells/spheroid after 24 hr treatment with NaCl or butyrate (N=4–6), one-way ANOVA ***p<0.001. All values, mean±SEM. See Figure S1.
Figure 3
Figure 3. Colonic crypt structure protects epithelial stem/progenitor cells from butyrate-suppression
(A) Number of Ki67+ cells per crypt at the colonic crypt base or total crypt in mice treated with enemas of NaCl or butyrate (N=5). (B) Representative images of mouse crypts and zebrafish inter-villus regions. Dashed lines indicate the epithelial architecture/crypt structure in mouse, which is absent in the zebrafish. Arrows depict the localization of stem/progenitor cells. Crypt height/distance from the lumen is also indicated. (C) Fecal butyrate concentration and level of butyryl-Coenzyme A (CoA) CoA transferase (BCoAt) in fecal samples of each organism (N=9 mice, and 5 samples pooled from 15 zebrafish). ND; not detected. (D) Representative images of EdU staining in intestinal bulge of zebrafish treated with NaCl or butyrate. White arrows indicate EdU+ epithelial cells (green). (E) Average number of EdU+ epithelial cells per intestinal diameter in zebrafish treated with 50mM NaCl or butyrate (N=8–12 zebrafish), unpaired t test ***p<0.001. All values, mean±SEM. Bars=50µm.
Figure 4
Figure 4. Mucosal injury exposes stem/progenitor cells to butyrate leading to suppression of proliferation
(A–B) Percentage area of epithelial hyperproliferation surrounding ulcers (A) and number of Ki67+ cells (B) in DSS-treated mice +/− butyrate enema (N=8 mice/group in 2 experiments). Unpaired t-test *p<0.05, **p<0.01. (C–E) Representative images (C), number of wound-adjacent Ki67+ cells (D), and unhealed wound area (E) in mice injured by colonic biopsy +/− butyrate enema. (N=12 mice/group in 3 experiments). Unpaired t-test ***p<0.001, ****p<0.0001. All values, mean±SEM. See Figure S2.
Figure 5
Figure 5. Colonocytes protect stem/progenitor cells by metabolic breakdown of butyrate
(A) Fold change in proliferation at 24 hrs in Cdc25A-luciferase colonic stem/progenitor cells upon treatment with butyrate-containing supernatant pre-incubated with either: no cells, colonocytes, stem cells, or colonocytes with add back of metabolized butyrate. Fold change for each group is expressed relative to NaCl-containing supernatant pre-incubated with the relevant cell type (N=4–12), one-way ANOVA *p<0.05, **p<0.01 ***p<0.001. (B) Oxygen consumption rate (OCR) to extra cellular acidification rate (ECAR) ratio in stem/progenitor cells and colonocytes (N=18 replicates/group), unpaired t test ****p<0.0001. Data are representative of 5 experiments. (C) OCR measured in colonocytes with NaCl or butyrate. Percentage OCR changes upon 2-deoxyglucose (2-DG) and Rotenone/Antimycin injections (representative of 4 experiments). (D) Percentage change in OCR in stem/progenitor cells and colonocytes upon injection of NaCl or butyrate (N=6 replicates/group; representative of 4 experiments), 2-way ANOVA Sidak multiple comparisons ****p<0.0001. (E) Ratio of intracellular 13C2-acetyl-CoA in stem/progenitor cells versus colonocytes after incubation with 13C4-butyrate (N=12), Unpaired t-test **P<0.01. (F) Immunofluorescence image of colonic crypt stained with CD44 (red), β-catenin (green, epithelium) and DAPI (blue, nuclei). Mice received enema of 13C4-butyrate and intracellular 13C2-acetyl-CoA was detected in CD44+ and CD44− colonic epithelial fractions (N=8–10). See Figure S3, S4, and S5.
Figure 6
Figure 6. Colonocytes metabolize butyrate to protect underlying stem/progenitor cells through an Acads-dependent mechanism
(A) Image of acyl CoA-dehydrogenase (Acads) (red) localization in the colon (β-catenin, green, epithelial cells; DAPI, nuclei). Dashed line marks the crypt. (B) Relative expression of Acads mRNA in stem/progenitor cells versus colonocytes generated in vitro (N=3), unpaired t test ***p<0.001. All values are mean±SEM. (C) OCR percentage in WT and Acads−/− colonocytes at basal conditions and after NaCl or butyrate, Oligomycin (Oligo), FCCP, and rotenone/antimycin (R/A) injections. Data are representative of 2 experiments. (D–F) Crypt proliferation in WT and Acads−/− mice. Images (D) and percentage of crypts with Ki67+ epithelial cells (F) in WT and Acads−/− mice at baseline and after butyrate enema. Solid line indicates proliferative zone with Ki67+ cells. Bar=100µm. (Two way ANOVA, Means with different letters are significantly different by Tukey's multiple comparison test). Percentage of crypt with Ki67+ cells calculated as the distance between crypt base and Ki67+ cells at the highest position (E). (G–H) Percentage area of hyperproliferation around the ulcers (G) and number of Ki67+ cells (H) in DSS-treated WT and Acads−/− mice with butyrate enemas on days 5–7 (N=8 mice/group, 2 experiments). Unpaired t test *p<0.05. All values, mean±SEM. See Figure S5.
Figure 7
Figure 7. Butyrate suppresses stem and progenitor cell proliferation through a Foxo3-dependent mechanism
(A) HDAC activity in colonic stem/progenitor cell nuclei after treatment with butyrate or HDAC inhibitor Trichostatin A (TSA; 10µM) (N=5 experiments) one-way ANOVA ****p<0.0001. (B) Immunoblot of acetylated (ac) Histone H3K27 and H3K9 residues in stem/progenitor cells post-treatment with 1mM butyrate or NaCl. Total H3 is loading control (representative of 3 experiments). (C) H3K27acetylation peaks at 938 sites (2 kb upstream or 2 kb downstream of any TSS) were significantly altered by butyrate (1mM) treatment of stem/progenitor cells. (D) Hierarchical clustering and heatmap analysis (most up- or down-regulated gene changes) from gene expression arrays for stem/progenitor cells treated with NaCl (1mM) or butyrate (1mM or 10mM). (E) Percentage of stem/progenitor cells in S-phase after treatment with butyrate or NaCl (1mM) +/− Foxo inhibitor (1µM) (N=6 experiments), one-way ANOVA **p<0.01. (F) Percentage of cells in S phase in Foxo3-deficient cells upon butyrate treatment (1mM) (N=5 experiments), one-way ANOVA **p<0.01. (G) ChIP pull down using anti-Foxo3 or isotype control IgG post-treatment with NaCl or butyrate (1mM) followed by qPCR of indicated gene promoter regions. (H) mRNA expression of the indicated genes in Foxo3flox/flox and Foxo3-deficient cells post-NaCl or butyrate treatment. ns: not significant, ND: not detected. (I–J) Percentage area of hyperproliferation (I) and number of Ki67+ cells (J) around ulcers in DSS-treated WT mice receiving enemas of butyrate +/− Foxo inhibitor (N=5–9 mice/group in 2 experiments). Unpaired t test *p<0.05,**p<0.01. All values mean±SEM. See Figure S6 and S7.

Comment in

References

    1. Arpaia N, Campbell C, Fan X, Dikiy S, van der Veeken J, deRoos P, Liu H, Cross JR, Pfeffer K, Coffer PJ, et al. Metabolites produced by commensal bacteria promote peripheral regulatory T-cell generation. Nature. 2013;504:451–455. - PMC - PubMed
    1. Atarashi K, Tanoue T, Oshima K, Suda W, Nagano Y, Nishikawa H, Fukuda S, Saito T, Narushima S, Hase K, et al. Treg induction by a rationally selected mixture of Clostridia strains from the human microbiota. Nature. 2013;500:232–236. - PubMed
    1. Barker N, Ridgway RA, van Es JH, van de Wetering M, Begthel H, van den Born M, Danenberg E, Clarke AR, Sansom OJ, Clevers H. Crypt stem cells as the cells-of-origin of intestinal cancer. Nature. 2009;457:608–611. - PubMed
    1. Barker N, van Es JH, Kuipers J, Kujala P, van den Born M, Cozijnsen M, Haegebarth A, Korving J, Begthel H, Peters PJ, et al. Identification of stem cells in small intestine and colon by marker gene Lgr5. Nature. 2007;449:1003–1007. - PubMed
    1. Boutros R, Dozier C, Ducommun B. The when and wheres of CDC25 phosphatases. Current opinion in cell biology. 2006;18:185–191. - PubMed

Publication types

Substances