. 2016 Jun 30;166(1):222-33.
doi: 10.1016/j.cell.2016.05.002. Epub 2016 Jun 2.

Morphomechanical Innovation Drives Explosive Seed Dispersal

Affiliations

Morphomechanical Innovation Drives Explosive Seed Dispersal

Hugo Hofhuis et al. Cell. .

Abstract

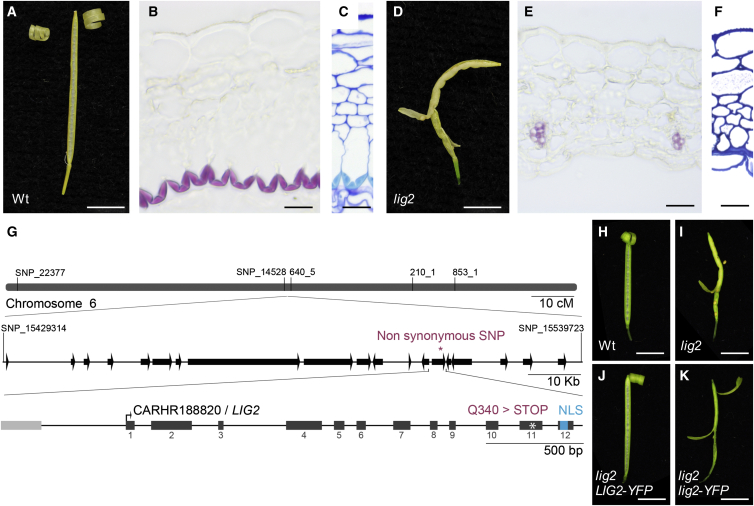
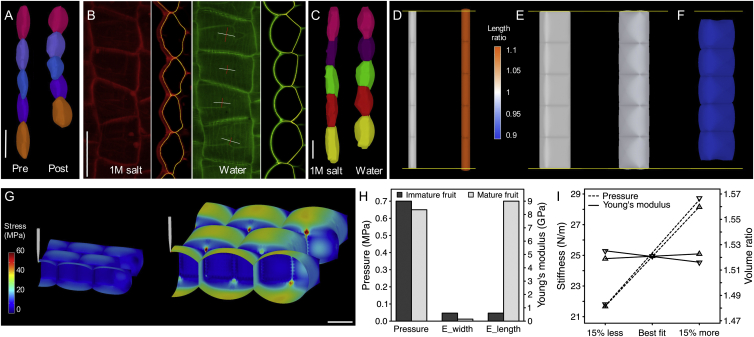
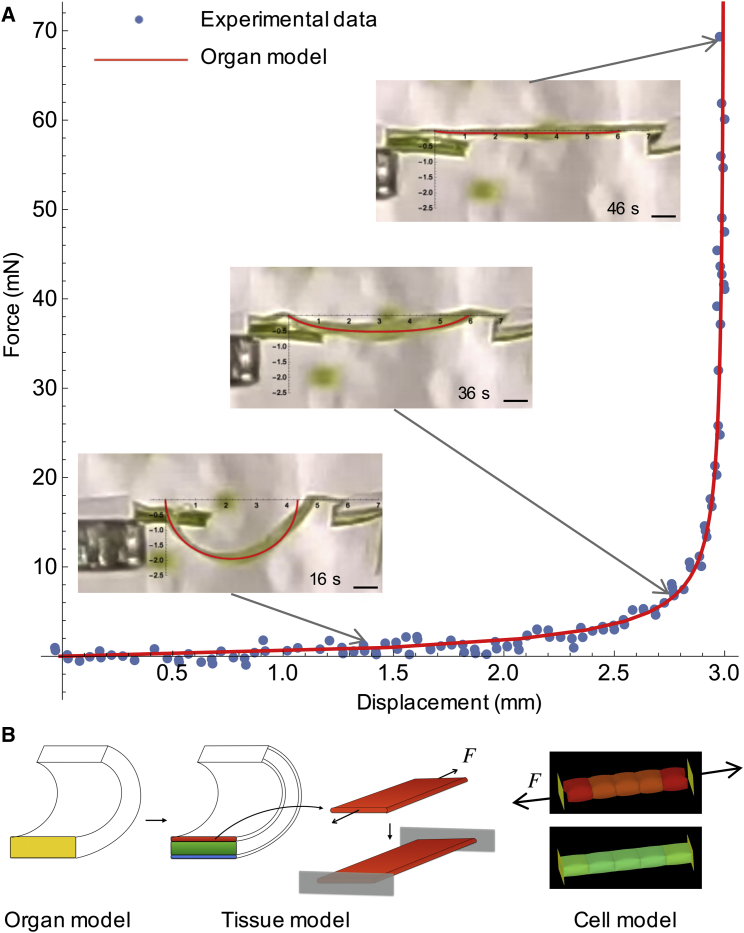
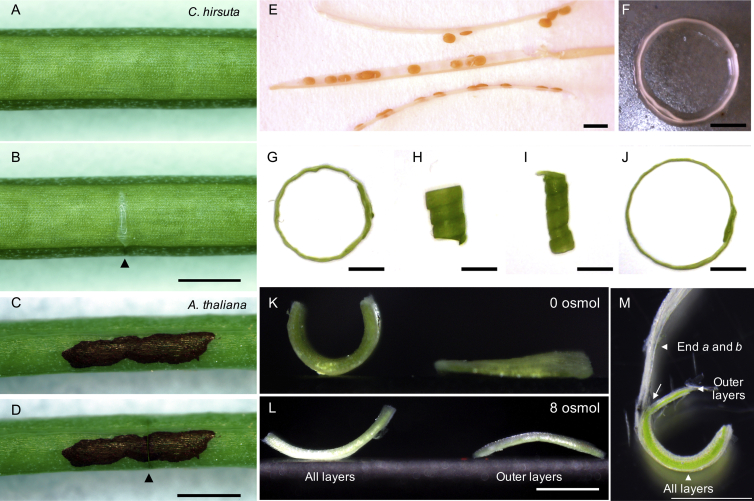
How mechanical and biological processes are coordinated across cells, tissues, and organs to produce complex traits is a key question in biology. Cardamine hirsuta, a relative of Arabidopsis thaliana, uses an explosive mechanism to disperse its seeds. We show that this trait evolved through morphomechanical innovations at different spatial scales. At the organ scale, tension within the fruit wall generates the elastic energy required for explosion. This tension is produced by differential contraction of fruit wall tissues through an active mechanism involving turgor pressure, cell geometry, and wall properties of the epidermis. Explosive release of this tension is controlled at the cellular scale by asymmetric lignin deposition within endocarp b cells-a striking pattern that is strictly associated with explosive pod shatter across the Brassicaceae plant family. By bridging these different scales, we present an integrated mechanism for explosive seed dispersal that links evolutionary novelty with complex trait innovation. VIDEO ABSTRACT.


Figures

None
Graphical abstract
Figure 1
Figure 1
Dynamic Model of Explosive Seed Dispersal in C. hirsuta (A–C) Explosive seed dispersal recorded at 15,000 fps: the two valves detach from the fruit (A), curl back with seeds adhered to the inner valve surface (B), and launch seeds while coiling (C); t, time between frames; arrows indicate seeds. (D) Seed flight paths extrapolated from measured launch conditions; n = 229 seeds from 14 fruits; velocity max: 10.4 ms−1, mean: 5.0 ± 2.1 ms−1. (E) Measured distribution of 52,585 seeds dispersed by 21 plants (red) overlaid with computed distribution of seeds ejected from a single valve using model dynamics (blue). (F) Cartoon of C. hirsuta fruit, dashed line indicates transverse cut shown in adjacent cartoon, dashed lines through valve demarcate section shown in (G); dotted lines indicate longitudinal segment of valve shown in (H) and (I). v, valve; r, replum; endocarp b layer, blue; seed, gray. (G) Transverse valve section labeled as a mechanical trilayer; lignified endocarp b secondary cell walls (End) stain pink with phloroglucinol; non-lignified cells form two layers, exocarp (Exo) and mesocarp/non-lignified endocarp b (Mes). Scale bar, 10 μm. (H and I) Valve segments in water, intact (H) or lacking endocarp b layer (I). Scale bar, 1 mm. (J) Simulated trajectories of coiling valves from model. Valves shown at successive time intervals (red); valve tip and midpoint are marked (blue) to visualize how their position changes over time. (K) Trajectories at nine points on the valves quantified from high-speed movies (red); and simulated from the model at equivalent time steps (blue). Axes in (J) and (K) show distance (mm). See also Figure S1 and Movies S1 and S2.
Figure 2
Figure 2
Loss of the Endocarp b Layer in lig2 Prevents Explosive Pod Shatter (A–F) Exploded fruit observed in air and transverse valve sections through mature stage 17 fruit of wild-type (A–C) and lig2 (D–F). Lignified cell walls stain pink with phloroglucinol (B and E) and cyan with TBO (C and F). Note vascular bundles contain lignified xylem cells. Wild-type valves have 9.2 ± 0.1 cell layers mid-valve and lig2 valves have 8.2 ± 0.1, n = 36 valves, data represented as mean ± SEM. Scale bars, 5 mm (A and D), 20 μm (B, C, E, and F). (G) Cartoon of C. hirsuta chromosome 6 region containing LIG2. Name and position of five markers used for mapping are indicated above chromosome; scale bar, 10 cM. Zoomed-in region flanked by two additional markers contains 19 predicted genes (arrows) and a single non-synonymous SNP (); scale bar, 10 kb. Zoomed-in CARHR188820/LIG2 locus containing a C2523 > T mutation in exon 11 that causes a Q340 > STOP mutation () before the NLS at amino acids 367–383, LIG2 exons are shown as dark gray boxes, non-coding sequences as lines, and the START codon is indicated by an arrow, upstream gene CAHR188810 is shown as a light gray box. Scale bar, 500 bp. (H–K) Mature fruits of wild-type (H), lig2 (I), lig2 complemented with a fluorescently tagged genomic LIG2 construct, LIG2-YFP (J), and not complemented with a fluorescently tagged mutant lig2 construct, lig2-YFP (K). Scale bars, 5 mm. See also Figure S2.
Figure 3
Figure 3
Lignified Cell Wall Geometry Triggers Explosive Energy Release (A) Cartoon of valve geometry specified in model, exocarp (red), middle layers (green), lignified endocarp b (blue), for wild-type (hinged), and boxed endocarp b cell wall. (B and C) Lignin autofluorescence in endocarp b cell walls pre- (B) and post-explosion (C); cartoons show hinge angle, n = 659 cells, data represented as mean ± SEM. Scale bars, 20 μm. (D) Cartoon of how the endocarp b hinge mechanism triggers energy release. Left panel: valves are curved in cross section and building tension while attached to the fruit. Dehiscence zones (orange) form along the valve margins, weakening this attachment. Right panel: valves flatten in cross section via opening of the lignified endocarp b hinge (blue). Valves detach from the fruit as they coil to relieve tension, transferring kinetic energy to launch seeds (brown). Replum (yellow). (E) Energy profile of valve with hinged (red) or boxed (blue) endocarp b wall geometry modeled during explosive pod shatter. Energy computed once the valve cross-section is flat and plotted as a function of longitudinal curvature. For each case, the energy minimizer is shown as a point on the curve and the energy released as a dashed line; coils per valve are indicated for these points. Points on the y axis indicate initial energy when the valve cross section is curved; note that energy input is required to flatten the valve with boxed endocarp b wall geometry. (F–H) Fruit observed in air and transverse valve sections through mature NST3::VND7 fruit (F). Boxed geometry of lignified endocarp b cells and two adjacent mesocarp layers stained pink (G) and cyan (H). Scale bars, 5 mm (F); 20 μm (G and H). See also Figure S3.
Figure 4
Figure 4
Morphomechanical Innovation Drives Explosive Seed Dispersal Endocarp b secondary cell wall geometry in representative species with explosive pod shatter in Cardamine and with non-explosive pod shatter in a Brassicaceae-wide sample. Lignified cell walls stain cyan with TBO in transverse valve sections through mature fruit; fruit morphology is shown for each species and their phylogenetic relationship is indicated by the cladogram below. Scale bars, 10 μm (cells); 2 mm (fruits). See also Figure S4.
Figure 5
Figure 5
Turgor-Driven Shrinkage (A–C) Exocarp cells aligned to longitudinal fruit axis. (A) Side view of segmented cells from CLSM stacks of propidium iodine (PI)-stained fruits pre- and post-explosion, in water. (B) Top and side view of PI-stained cells treated with 1 M salt or water prior to imaging, cell outlines in yellow were used for quantitation and crosshairs show principal directions of shrinkage (red) and expansion (white). (C) Side view of cells segmented from CLSM stacks of PI-stained short valve segments treated with 1 M salt or water prior to imaging. Scale bars, 50 μm (A, B), 20 μm (C). (D–F) FEM simulations of cells pressurized from 0 Mpa (left) to 0.7 MPa (right); heatmap shows relative increase (orange) or decrease (blue) in cell length; horizontal yellow line shows initial length. Cell dimensions: 100 × 20 × 20 μm for A. thaliana exocarp cells (D), 50 × 50 × 20 μm for C. hirsuta exocarp cells (E and F). Cell wall material: isotropic (D and E), anisotropic (F). Pressure: 0 MPa (left, D and E), 0.7 MPa (right, D–F). (G) FEM simulations of exocarp cells in immature fruit of cell dimensions 30 × 20 × 14 μm (left) and mature fruit of cell dimensions 50 × 50 × 20 μm (right), micro-indented by a CFM tip. Heatmap shows stress in MPa. Scale bar, 20 μm. (H) Barplot of turgor pressure and cell wall elasticity parameters given by the FEM model for immature (dark gray) and mature (light gray) exocarp cells shown in (G). Young’s modulus in the width (Ewidth) and length (Elength) directions of the cell wall, defined by the fruit’s principal axes. (I) Sensitivity analysis of FEM model. Effect of best-fit parameters and values 15% lower and higher for pressure (dashed lines) and the Young’s modulus ratio (Ewidth:Elength, solid lines) on cell stiffness (N/m) and cell volume (ratio change), shown on the left and right y axes, respectively. See also Table S1 and Movies S3, S4, and S5.
Figure 6
Figure 6
Cellular Determinants of Valve Tension (A and B) Principal direction and degree of cortical microtubule (CMT) alignment (red lines) in exocarp cells (outlined in cyan) of fruit at stage 16 (A, 12 mm fruit length) and stage 17a (B, 17 mm fruit length); CMTs visualized by GFP-TUA6 expression; barplots quantify the distribution of CMT orientations, relative to the longitudinal fruit axis, n = 66 cells. Scale bars, 50 μm. (C–E) Principal direction and amount of tension (red lines) in hydrated exocarp cells during successive stages of fruit development: early stage 17a (C), late stage 17a (D), and stage 17b (E). Heatmap shows tension as % cell shrinkage in the exocarp after tension is release by excising the valve from the fruit. In (A)–(E) images are aligned to the longitudinal fruit axis. L, fruit length in mm; curl, no curl, valve does or does not curl when cut. Scale bars, 50 μm. (F–H) Transverse TBO-stained sections of fruit valves at early stage 17a (F), late stage 17a (G), and stage 17b (H), showing progressive thickening and lignification of endocarp b secondary cell walls. Scale bars, 10 μm. (I) Barplot of valve tension (% shrinkage in longitudinal direction, dashed line) shown on left y axis and exocarp cell shape (cell length/width ratio, solid line) shown on right y axis, relative to CMT reorientation (gray) and endocarp b lignification (blue) during development, fruit length shown as a heatmap on x axis. See also Figures S5 and S6.
Figure 7
Figure 7
Linking Multi-scale Models (A) Force-displacement curves measured (blue dots) and computed from an organ model (red line) showing the force exerted, as a valve is pulled from curved to flat in air. Insets show valve at three time points during the experiment indicated by arrows on the curve, overlaid in red is the corresponding profile calculated from the organ model. Scale bars, 1 mm. (B) Cartoon of experimental design: valve stiffness (yellow) determined in (A) was used to compute exocarp stiffness (red), from which exocarp pulling force (F) was calculated. The same force parameter was extracted independently from the cell-level model. See also Figure S7.
Figure S1
Figure S1
Mechanical and Osmotic Experiments in C. hirsuta and A. thaliana Fruits, Related to Figure 1 (A and B) Incision of the C. hirsuta valve shows mechanical tension in situ. Mature fruit before (A) and after a shallow cut is made in the valve outer layers (B). The cut layers immediately gape in the long direction of the fruit, revealing the white, lignified endocarp b cell walls underneath (arrowhead), indicating that the valve was in a state of tension while attached to the fruit. (C and D) The same experiment in A. thaliana shows no tension. Ink was applied to the intact valve (C) to aid visibility of the incision (D, arrowhead), which did not gape. (E–J) Turgor pressure in living cells is required for full valve curvature. Valves of alcohol-dried fruits fall off without explosion and are almost flat (E). Re-hydration in water produces little curvature in alcohol-treated valves (F) or in valves killed by freezing (G), as observed previously upon re-hydration of oven-dried C. parviflora fruits (Hayashi et al., 2010). Valves of living, freshly exploded fruits are curled much more tightly in coils of ∼2 mm diameter (H). Hydration of these same valves in water results in even tighter curling in coils of ∼1 mm diameter (I), while after plasmolysis in 4M salt solution the coils open to ∼5-6 mm diameter (J). Thus, the tight coiling of valves in explosive fruits (H) is an active process requiring living cells that can sustain internal pressure. In contrast to this, the slight residual curvature in dead, hydrated valves (F and G) is passive and could be explained by gradients of cell wall composition within the valve (Hayashi et al., 2010, Vaughn et al., 2011). (K and L) Both inner and outer layers of the valve and turgor pressure are required for curvature. In pure water (K), a valve segment comprising all layers (left) curves, while a segment of excised outer layers (right) remains flat. Please note that these data are presented in Figure 1 of the main text but are also shown here for clarity. In 8 osmoles of salt solution (L), curvature of the same intact valve segment (left) is very reduced, while the same segment of excised outer layers (right) curves slightly in the opposite direction, indicating that the outermost exocarp layer increases in length following plasmolysis. (M) Endocarp layers alone do not curve in water, as shown by separating the outer layers of a valve segment from the endocarp a and b layers (white arrow). The valve segment comprising all layers curves, while each of the separated layers remain flat. Therefore, a bilayer composed of the inner and outer valve layers is necessary and sufficient for curvature, rather than a bilayer composed of the endocarp a and b layers as previously proposed (Hayashi et al., 2010). Scale bars: 1 mm (A-D, K-M), 2 mm (E-J).
Figure S2
Figure S2
The lig2 Mutation Prevents Nuclear Accumulation of the DNA Binding Protein LIG2, Related to Figure 2 (A and B) CLSM of DAPI-stained fruit mesocarp cells from lig2; LIG2-YFP (A) and lig2; lig2-YFP (B) transgenic lines. DAPI signal (red) indicates the nucleus, YFP signal (yellow) accumulates in the nucleus in lig2; LIG2-YFP (A) cells, but is extremely reduced in lig2; lig2-YFP (B) cells, and the merged DAPI and YFP signals confirms the nuclear localization of YFP in (A). (C) RT-PCR performed on cDNA template reverse transcribed from RNA samples of lig2, lig2 LIG2-YFP and lig2 lig2-YFP transgenic lines. LIG2 and YFP primers were used to amplify a 402 bp product from the LIG2-YFP transgene and a 224 bp product from the lig2-YFP transgene. 402 bp and 224 bp amplicons in these samples indicated that both transgenes were expressed. No amplification was observed in the lig2 sample. Amplicons of the ACT8 housekeeping gene indicated equal amounts of cDNA template in each RT-PCR reaction. (D) Expression levels of LIG2, measured by qRT-PCR, are low throughout fruit development with no significant differences between stage 9 and other stages (Student’s t test p > 0.05). LIG2 is expressed in all tissues of stage 17 fruit with significantly higher expression in the seed than the valve and significantly higher expression in the valve than the rest of the fruit (Student’s t test p < 0.01). Mean values and standard deviations are shown. LIG2 expression was normalized to expression of the reference gene Clathrin/AP2M (CARHR174880). (E and F) CLSM of LIG2-YFP expression (yellow). Nuclear expression is observed in the seed and all layers of the valve in a cross section of stage 15 fruit (E). Nuclear expression is observed in the endocarp b and a layers in an en face section of a stage 16 valve; cells are outlined by propidium iodide staining (F). (G–J) Transverse valve sections, 70 μm thick, stained with phloroglucinol to visualize lignin. A lignified endocarp b cell layer is present in wild-type (G), absent in lig2 (H), restored when a LIG2-YFP transgene is introduced into the lig2 mutant (I) but not when a lig2-YFP transgene containing the lig2 mutation is introduced into the lig2 mutant (J). Scale bars: 25 μm (A, B, E), 50 μm (F), 20 μm (G-J).
Figure S3
Figure S3
C. hirsuta Valve Geometry and Anatomy, Related to Figure 3 (A) Transverse sections through the fruit show the valve is bowed outward when adjacent to a seed and valve depth, especially that of the endocarp b cell layer, is much reduced when the valve is adjacent to a seed versus non-adjacent, suggesting that seed expansion may exert tension in the lateral direction across the valve (see Figure S6); S: seed. (B) Bar chart of mean cross-sectional area of endocarp b cells at positions in the valve immediately adjacent to a seed (gray) and non-adjacent to a seed (black). Sections were analyzed from every fruit along a single inflorescence stem at successive developmental stages (14 to 17b). From stage 16 onward, cell area is considerably reduced if positioned adjacent to a seed. Error bars show SEM. (C) CLSM en face view of the lignified secondary cell walls of the endocarp b cell layer showing lignin autofluorescence in three long rods per cell connected by thin hinges; cell length ∼2 mm. (D) Transmission electron micrograph transverse view of the lignified secondary cell walls of endocarp b cells showing thin hinges (arrowheads) connecting three rods on the cell face adjacent to the seeds. (E–G) C. hirsuta NST3::GUS fruits stained and viewed as whole mounts (E, F) or a 100 μm thick vibratome cross section (G). GUS expression is observed in cells of the replum but not the valve just prior to stage 16 (E), and in the valve from stage 16 onward (F) in the endocarp b cell layer and adjacent few mesocarp cell layers (G). (H–K) Timing of lignification in phloroglucinol-stained 70 μm thick vibratome cross sections of wild-type (H, J) and ChNST3::AtVND7-vYFP (I, K) valves. Lignin was first deposited in the endocarp b cell layer at stage 16 in both wild-type (H) and ChNST3::AtVND7-vYFP (I). At stage 18, the final pattern of lignification differed dramatically between the endocarp b cell layer in wild-type (J) and the endocarp b and adjacent few mesocarp cell layers in ChNST3::AtVND7-vYFP (K). (L) Distribution of the number of complete coils per valve in water for wild-type and 3 independent ChNST3::AtVND7-vYFP transgenic lines; homo: homozygous, het: heterozygous for transgene. Below the graph are shown representative ChNST3::AtVND7-vYFP and wild-type valves in water. Scale bars: 20 μm (A), 100 μm (C, G), 2 μm (D), 2 mm (E, F), 1 mm (L).
Figure S4
Figure S4
“Boxed” Geometry of Endocarp b Secondary Cell Wall in Brassicaceae Fruit with Non-explosive Pod Shatter, Related to Figure 4 Endocarp b secondary cell wall geometry in representative species with non-explosive pod shatter in the Brassicaceae family. Lignified cell walls stain cyan with TBO in transverse valve sections and fruit morphology is shown for each species. Scale bars: 1 mm (fruits), 10 μm (histology panels).
Figure S5
Figure S5
Realignment of Cellulose Microfibrils in the Fruit Exocarp, Related to Figure 6 (A–E) Surface projections of cellulose microfibrils stained with S4B in C. hirsuta exocarp cells at successive stages of fruit development. Microfibrils are aligned in a uniformly transverse direction at stage 16 (A) but longitudinally aligned in the inner cell wall at stage 17a (D) such that net alignment is no longer transverse at stage 17b (E). Signal is projected from the following surface depths: 0 - 0.9 μm (total cell wall, A), 0 – 1.4 μm (total cell wall, B), 0 – 0.5 μm (outer cell wall, C), 1 – 1.4 μm (inner cell wall, D) and 0 - 1.6 μm (total cell wall, E). (F–K) Surface projections of 35S::GFP:TUA6 expression marking cortical microtubules (MT) in exocarp cells at successive stages of C. hirsuta (F-H) and A. thaliana (I-K) fruit development. Please note that panels (F, G) are presented in Figure 6 of the main text but are also shown here for clarity. MT orientation switches from transverse in stage 16 (F, I) to longitudinal in stage 17a (G, J). Cells are outlined in blue, and red lines indicate the principal direction of MT orientation in each cell. At stage 17b (H, K), C. hirsuta exocarp cells change shape from rectangular to square (H), while A. thaliana exocarp cells remain rectangular (K). This suggests that the MT reorientation alone is not sufficient to change cell shape and that other factors must also contribute to lateral cell expansion in C. hirsuta. A possible candidate is the lateral tension exerted by expanding seeds during C. hirsuta fruit maturation (Figures S2 and S6). (L) Distribution of MT orientations in stage 16 and 17a exocarp cells of C. hirsuta (black) and A. thaliana (gray). All images are oriented such that vertical corresponds to the long axis of the fruit. Scale bars: 10 μm (A-E), 50 μm (F-K).
Figure S6
Figure S6
Changes in Exocarp Tension In Situ during C. hirsuta Fruit Development, Related to Figure 6 (A–J) Valve regions were imaged on the fruit, then cut off the fruit and re-imaged, and deformations were quantified at the cellular scale. The exocarp shrank after it was cut off the fruit, indicating that it was in a state of tension while attached to the fruit. The direction of maximal shrinkage of the exocarp is quantified in a developmental series of fruits from two different plants (A–E, F–J). All images are oriented such that vertical corresponds to the long axis of the fruit. Red lines show the direction of maximal shrinkage for each cell and the heatmap indicates the percentage of shrinkage in this maximal direction. Fruits at near final length and width (D, E, J) exhibit valve curling after cutting and these exocarp cells are under maximal tension in the longitudinal direction. Prior to this developmental stage, valves do not curl after cutting and exocarp tension is maximal in the lateral direction (A, B, F, G). The switch in direction of maximal tension occurs during an intermediate stage (C, H, I). Please note that panels (B, D, E) are presented in Figure 6 of the main text but are also shown here for clarity. The cartoons to the right of each pair of images summarize the dimensions of the fruit and exocarp cells at each developmental stage, and the principal direction of tension. (K and L) Graphs showing the percentage of exocarp cell shrinkage in lateral (blue) and longitudinal (orange) directions for each fruit developmental series: (A)–(E) shown in (K) and (F)–(J) shown in (L). (M) Graph showing exocarp cell size in the length (red) and width (purple) dimensions for each fruit developmental series (A-E, solid lines) and (F-J, dashed lines). VL: total valve length before cutting, VW: total valve width before cutting, CL: mean cell length, CW: mean cell width. Asterisk indicates valves that curled when detached from the fruit. Scale bar: 50 μm.
Figure S7
Figure S7
Profile of Extensometer Experiments and Correction for Setup Stiffness, Related to Figure 7 (A) Image sequence (a-g) extracted from a movie of experiment V2 was used to determine the exact time of valve rupture and compare with the force recorded in time. (B) Just before rupture, the force exhibits a local maximum (e) due to the scissors pressing on the valve, after which the force drops to zero and the valve is released from the clamp (f). Using the point of rupture (e) as a reference, the other time points were traced back on the force-time curve: initial pulling on the valve (a) and complete straightening of the valve (d), as well as intermediate points of valve uncurling (b and c). Note that the force decreases with time between (d) and (e) due to creep of the whole experimental setup. (C–F) Force-displacement curves. (C) Curve from experiment V2 shown above; time points (a-g) extracted from the movie are indicated in red. The stiffness of the experimental setup, composed of the force sensor, clamps, actuator and straight valve, is extracted by fitting a line to the force-displacement curve before valve rupture (green line). The setup stiffness is then used to obtain a corrected force-displacement curve (D) that can be fitted to the organ model shown in Figure 7 of the main text. (E) Curves from 5 different experiments (V1, V2, V3, V4, V6), truncated after valve rupture for clarity. Setup stiffness for each experiment was determined based on the linear fit of the curves before rupture (solid lines). Note that clamping of the valve is different for each experiment, resulting in variation in setup stiffness. (F) Each curve corrected for setup stiffness.

Comment in

Similar articles

Cited by

References

    1. Barbier de Reuille P., Routier-Kierzkowska A.L., Kierzkowski D., Bassel G.W., Schupbach T., Tauriello G., Bajpai N., Strauss S., Weber A., Kiss A. MorphoGraphX: a platform for quantifying morphogenesis in 4D. eLife. 2015;4:05864. - PMC - PubMed
    1. Barkoulas M., Hay A., Kougioumoutzi E., Tsiantis M. A developmental framework for dissected leaf formation in the Arabidopsis relative Cardamine hirsuta. Nat. Genet. 2008;40:1136–1141. - PubMed
    1. Bassel G.W., Stamm P., Mosca G., Barbier de Reuille P., Gibbs D.J., Winter R., Janka A., Holdsworth M.J., Smith R.S. Mechanical constraints imposed by 3D cellular geometry and arrangement modulate growth patterns in the Arabidopsis embryo. Proc. Natl. Acad. Sci. USA. 2014;111:8685–8690. - PMC - PubMed
    1. Beer T., Swaine M.D. On the theory of explosively dispersed seeds. New Phytol. 1977;78:681–694. - PubMed
    1. Breuer C., Stacey N.J., West C.E., Zhao Y., Chory J., Tsukaya H., Azumi Y., Maxwell A., Roberts K., Sugimoto-Shirasu K. BIN4, a novel component of the plant DNA topoisomerase VI complex, is required for endoreduplication in Arabidopsis. Plant Cell. 2007;19:3655–3668. - PMC - PubMed

Publication types