. 2016 Jun 30;166(1):245-57.
doi: 10.1016/j.cell.2016.05.031. Epub 2016 Jun 2.

Subcellular Imaging of Voltage and Calcium Signals Reveals Neural Processing In Vivo

Affiliations

Subcellular Imaging of Voltage and Calcium Signals Reveals Neural Processing In Vivo

Helen H Yang et al. Cell. .

Abstract

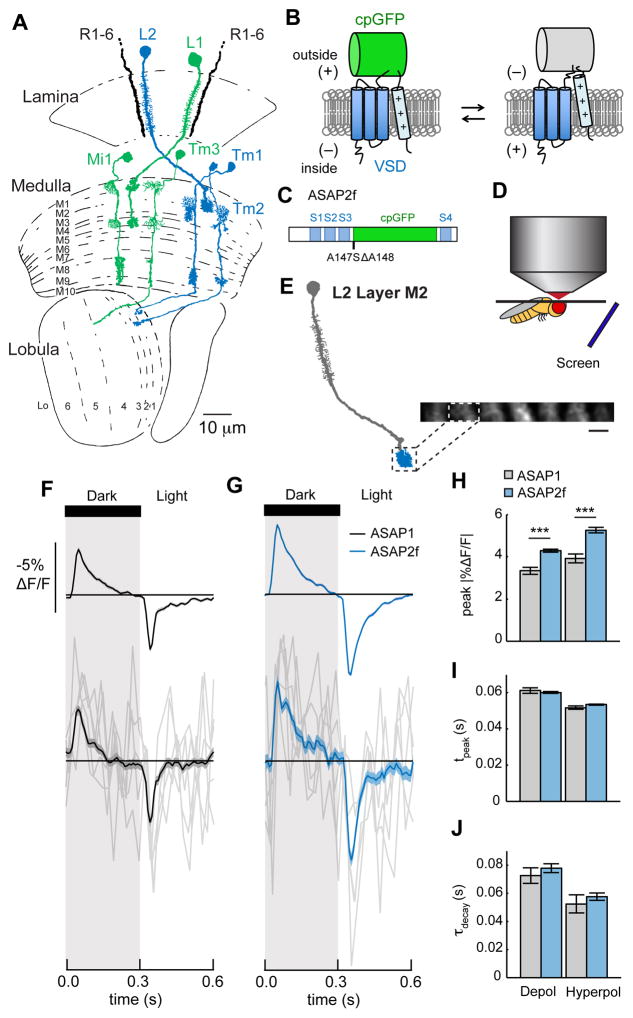
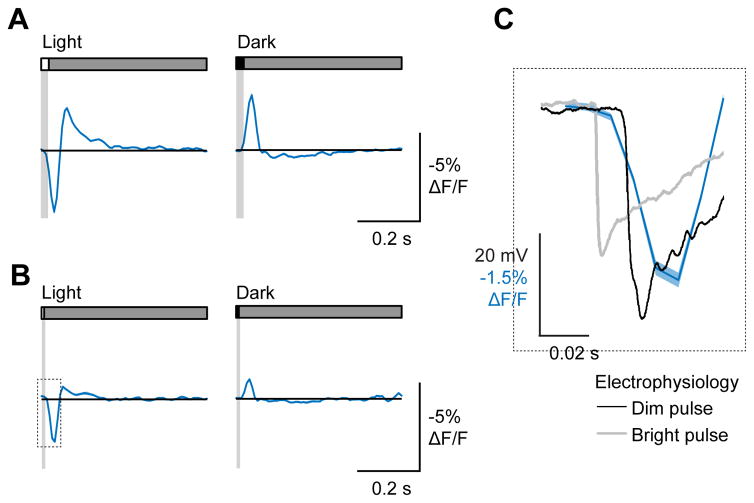
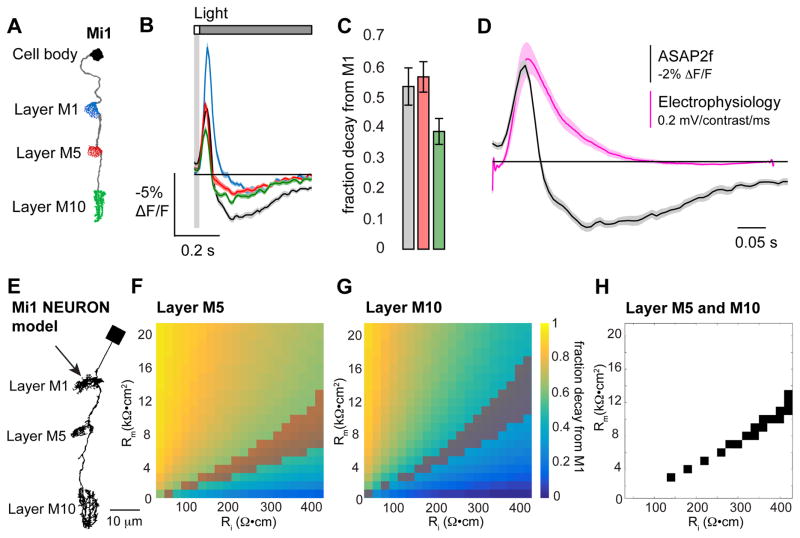
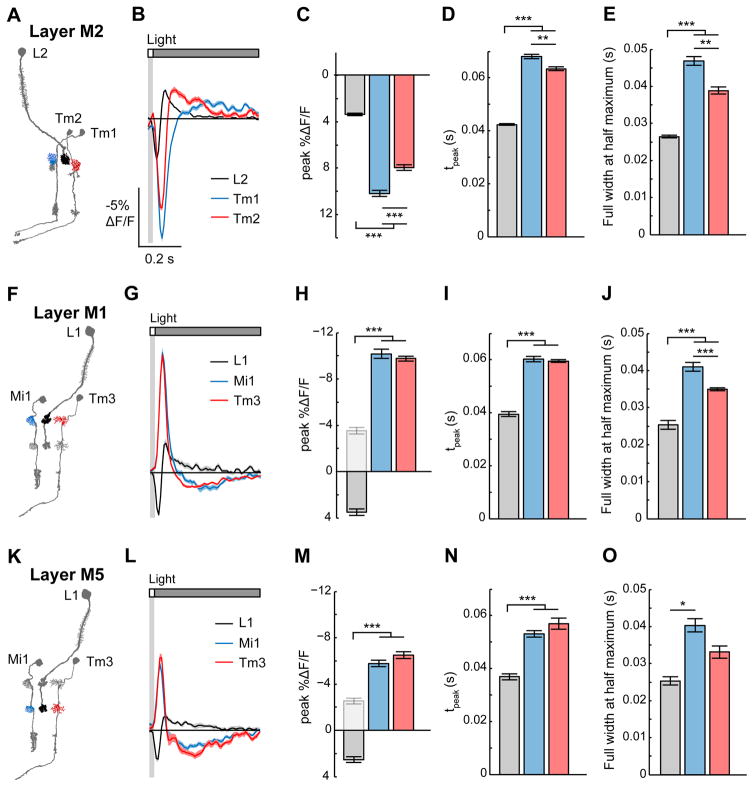
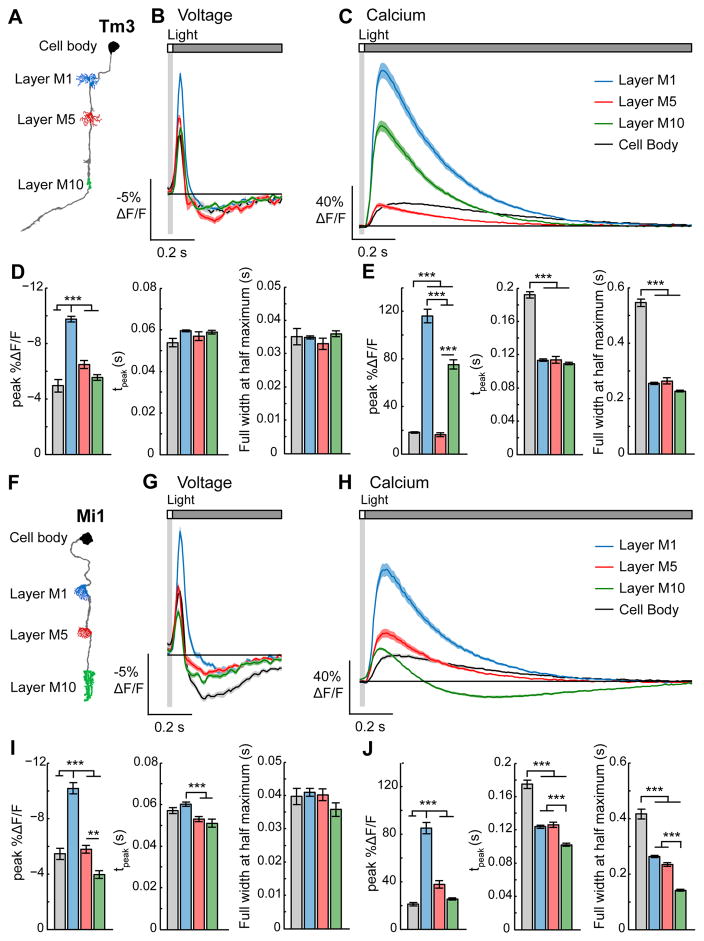
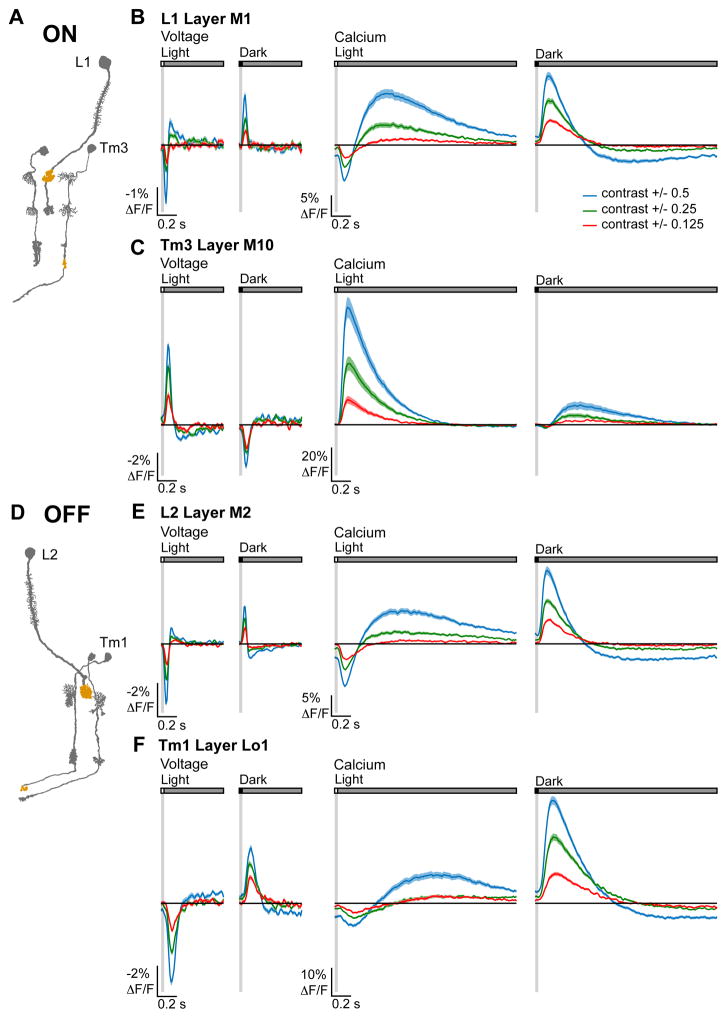
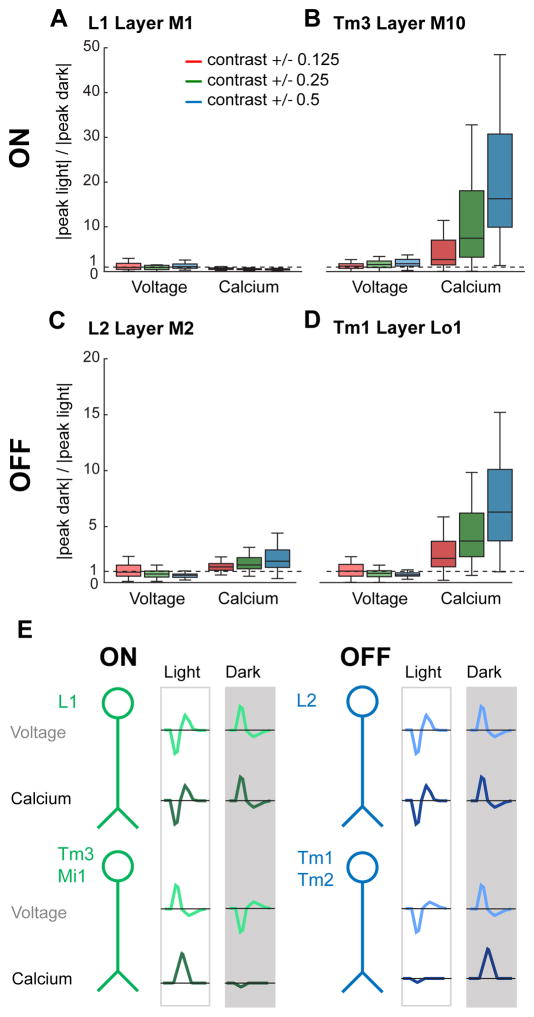
A mechanistic understanding of neural computation requires determining how information is processed as it passes through neurons and across synapses. However, it has been challenging to measure membrane potential changes in axons and dendrites in vivo. We use in vivo, two-photon imaging of novel genetically encoded voltage indicators, as well as calcium imaging, to measure sensory stimulus-evoked signals in the Drosophila visual system with subcellular resolution. Across synapses, we find major transformations in the kinetics, amplitude, and sign of voltage responses to light. We also describe distinct relationships between voltage and calcium signals in different neuronal compartments, a substrate for local computation. Finally, we demonstrate that ON and OFF selectivity, a key feature of visual processing across species, emerges through the transformation of membrane potential into intracellular calcium concentration. By imaging voltage and calcium signals to map information flow with subcellular resolution, we illuminate where and how critical computations arise.


Figures

Figure 1
Figure 1. Voltage imaging in the Drosophila visual system
(A) The Drosophila visual system. L1 and L2 receive input from photoreceptors R1-6 in the lamina neuropil. L1 synapses onto Mi1 and Tm3 in layers M1 and M5 of the medulla neuropil. L2 synapses onto Tm1 and Tm2 in medulla layer M2. L1 and its postsynaptic partners are in green; L2 and its postsynaptic partners are in blue. Tm1, Tm2, and Tm3 project axons into the lobula neuropil. In all figures, cell diagrams modified from Fischbach and Dittrich, 1989. (B) In ASAP sensors, changes in membrane potential induce movement of a positively charged transmembrane helix of a voltage sensitive domain (VSD), altering the fluorescence of a circularly permuted GFP (cpGFP). (C) Schematic diagram of ASAP2f, showing the VSD transmembrane domains (S1–S4, blue), cpGFP (green), and the location of the residues changed from ASAP1 (A147S ΔA148). (D) Schematic illustration of the setup for in vivo, two-photon imaging of visually evoked responses in Drosophila. (E) Illustration of L2 with the imaged region, the axon terminal in medulla layer M2, highlighted. Inset: in vivo, two-photon image of L2 axon terminals expressing ASAP2f, averaged across one time series. One axon terminal is highlighted. Scale bar: 5 μm. (F, G) Responses of L2 neurons to alternating 300 ms-long dark and light flashes, as measured with (F) ASAP1 (n = 52 cells, 3 flies) and (G) ASAP2f (n = 170 cells, 8 flies). Top: mean response across all cells. Each cell contributes its average response across 100 trials (1 trial = 1 dark flash and 1 light flash). Bottom: 5 exemplar single-trial responses from a representative L2 cell (gray) and the same cell’s mean response averaged over all trials (black or blue). The solid line is the mean response; the shading is ± 1 SEM. (H–J) Parameters quantifying the response: (H) peak ΔF/F; (I) tpeak; (J) τdecay. The mean ± 1 SEM is plotted. *** p < 0.001 (two-sample t-test, Bonferroni correction for multiple comparisons). See also Figures S1 and S2 and Table S1.
Figure 2
Figure 2. Voltage imaging captures L2 impulse responses
(A) Response of L2 axon terminals to a 25 ms light flash (left) or a 25 ms dark flash (right), with a 500 ms gray interleave. Contrast = 0.5. n = 125 cells, 11 flies. (B) Response of L2 axon terminals to an 8 ms light flash (left) or 8 ms dark flash (right), plotted with an electrophysiological recording from a lamina monopolar cell responding to similarly brief light flashes of two different intensities (data from Nikolaev et al., 2009). All responses are aligned to the onset of the light flash (red line).
Figure 3
Figure 3. Voltage imaging captures Mi1 response kinetics and the decay in response amplitude along the length of the cell
(A) Illustration of Mi1 with the imaged regions highlighted. (B) Voltage responses of the Mi1 arbors in layer M1 (blue, n = 79 cells, 4 flies), layer M5 (red, n = 92 cells, 4 flies), layer M10 (green, n = 67 cells, 4 flies), and the cell body (black, n = 37 cells, 2 flies) to a 25 ms light flash with a 500 ms gray interleave, contrast = 0.5. (C) Quantification of the decay in peak response amplitude (peak ΔF/F) as a fraction of the response in layer M1. (D) Impulse responses measured from the cell body of Mi1. Black: voltage response to a 25 ms light flash measured with ASAP2f (data from (B)). Pink: linear filter extracted from white noise analysis measured using electrophysiological recordings (data from Behnia et al., 2014). (E) Morphology of a NEURON model of Mi1. The arrow indicates the site of current injection. The model neuron was given passive membrane properties: specific membrane capacitance (Cm) = 1 μF/cm2, axial resistance (Ri) = 40 to 420 Ω•cm, and specific membrane resistance (Rm) = 1 to 21 kΩ•cm2. (F, G) Peak membrane potential during current injection presented as the fraction decayed from the peak response in layer M1. (F) Layer M5 and (G) layer M10 of the NEURON model. The shaded areas indicate the set of Ri and Rm values that result in decay values within 1 SEM of the decay measured with ASAP2f. (H) The set of Ri and Rm values that result in decay values within 1 SEM of the decay measured with ASAP2f for both layers M5 and M10.
Figure 4
Figure 4. Voltage responses are transformed between presynaptic axons and postsynaptic dendrites
(A) Illustration of L2 and its postsynaptic targets Tm1 and Tm2. The imaged arbors in medulla layer M2 are highlighted. (B) Responses of L2 (black, n = 125 cells, 11 flies), Tm1 (blue, n = 79 cells, 4 flies), and Tm2 (red, n = 89 cells, 4 flies) to a 25 ms light flash with a 500 ms gray interleave, contrast = 0.5. The solid line is the mean response; the shading is ± 1 SEM. (C–E) Quantification of the response: (C) peak ΔF/F; (D) tpeak; (E) full width at half maximum of the initial response. The mean ± 1 SEM is plotted. (F–J) In medulla layer M1, presynaptic cell L1 (black, n = 23 cells, 6 flies) and postsynaptic cells Mi1 (blue, n = 79 cells, 4 flies) and Tm3 (red, n = 153 cells, 8 flies). (K–O) In medulla layer M5, L1 (black, n = 14 cells, 5 flies), Mi1 (blue, n = 92 cells, 4 flies), and Tm3 (red, n = 35 cells, 4 flies). In (H) and (M), the light gray bar is the inverted L1 peak ΔF/F for comparison. * p < 0.05, ** p < 0.01, *** p < 0.001 (two-sample t-test for peak ΔF/F and full width at half maximum, Mann-Whitney U test for tpeak, Bonferroni correction for multiple comparisons). See also Figure S3.
Figure 5
Figure 5. Mapping voltage and calcium responses in different subcellular compartments of the same neuron
(A) Illustration of Tm3 with the imaged regions highlighted. (B) Voltage responses of Tm3 arbors in layer M1 (blue, n = 158 cells, 8 flies), layer M5 (red, n = 35 cells, 4 flies), layer M10 (green, n = 100 cells, 9 flies), and the cell body (black, n = 13 cells, 2 flies) to a 25 ms light flash with a 500 ms gray interleave, contrast = 0.5. (C) Calcium responses of Tm3 arbors in layer M1 (blue, n = 126 cells, 8 flies), layer M5 (red, n = 69 cells, 8 flies), layer M10 (green, n = 99 cells, 4 flies), and the cell body (black, n = 71 cells, 4 flies) to a 25 ms light flash with a 1500 ms gray interleave, contrast = 0.5. The solid line is the mean response; the shading is ± 1 SEM. (D) Quantification of the voltage signals. Left: peak ΔF/F. Middle: tpeak. Right: full width at half maximum. The mean ± 1 SEM is plotted. (E) Quantification of the calcium signals with the metrics arranged as in (D). (F–J) Responses of Mi1. (G, I) Voltage responses of the Mi1 arbors in layer M1 (blue, n = 79 cells, 4 flies), layer M5 (red, n = 92 cells, 4 flies), layer M10 (green, n = 67 cells, 4 flies), and the cell body (black, n = 37 cells, 2 flies). (G) is repeated from Figure 3B. (H, J) Calcium responses of the Mi1 arbors in layer M1 (blue, n = 94 cells, 5 flies), layer M5 (red, n = 67 cells, 5 flies), layer M10 (green, n = 89 cells, 5 flies), and the cell body (black, n = 51 cells, 5 flies). ** p < 0.01, *** p < 0.001 (two-sample t-test for peak ΔF/F and full width at half maximum, Mann-Whitney U test for tpeak, Bonferroni correction for multiple comparisons). See also Figure S4.
Figure 6
Figure 6. Measuring ON and OFF selectivity
(A) Illustration of the ON pathway with the imaged regions highlighted. (B, C) Voltage (left) and calcium (right) responses of (B) L1 (voltage: n = 43 cells, 9 flies and calcium: n = 68 cells, 9 flies) and (C) Tm3 (voltage: n = 97 cells, 8 flies and calcium: n = 85 cells, 7 flies) to 25 ms light and dark flashes of varying contrasts off of gray (contrast = 0.125, 0.25, or 0.5). The solid line is the mean response; the shading is ± 1 SEM. (D) Illustration of the OFF pathway. (E, F) Voltage (left) and calcium (right) responses of (E) L2 (voltage: n = 116 cells, 7 flies and calcium: n = 88 cells, 8 flies) and (F) Tm1 (voltage: n = 84 cells, 7 flies and calcium: n = 136 cells, 8 flies). See also Figures S5–S7.
Figure 7
Figure 7. ON and OFF selectivity arises in the transformation between voltage and calcium
(A, B) Quantification of selectivity to light (ON). The line, box, and whiskers are the median, interquartile range, and maximum and minimum values within one interquartile range, respectively. (A) L1 layer M1 axon terminals (voltage: n = 43 cells, 9 flies and calcium: n = 68 cells, 9 flies). (B) Tm3 layer M10 axon terminals (voltage: n = 97 cells, 8 flies and calcium: n = 85 cells, 7 flies). (C, D) Quantification of selectivity to dark (OFF). (C) L2 layer M2 axon terminals (voltage: n = 116 cells, 7 flies and calcium: n = 88 cells, 8 flies). (D) Tm1 layer Lo1 axon terminals (voltage: n = 84 cells, 7 flies and calcium: n = 136 cells, 8 flies). (E) Schematic summarizing the emergence of ON and OFF selectivity, displaying idealized impulse responses, at the level of membrane potential and intracellular calcium. See also Figures S5–S7.

Comment in

References

    1. Abbott LF, Regehr WG. Synaptic computation. Nature. 2004;431:796–803. - PubMed
    1. Baccus SA, Meister M. Fast and slow contrast adaptation in retinal circuitry. Neuron. 2002;36:909–919. - PubMed
    1. Behnia R, Clark DA, Carter AG, Clandinin TR, Desplan C. Processing properties of ON and OFF pathways for Drosophila motion detection. Nature. 2014;512:427–430. - PMC - PubMed
    1. Borst A. Fly visual course control: behaviour, algorithms and circuits. Nat Rev Neurosci. 2014;15:590–599. - PubMed
    1. Cao G, Platisa J, Pieribone VA, Raccuglia D, Kunst M, Nitabach MN. Genetically Targeted Optical Electrophysiology in Intact Neural Circuits. Cell. 2013;154:904–913. - PMC - PubMed

Publication types