. 2016 Jun 16;62(6):834-847.
doi: 10.1016/j.molcel.2016.04.035. Epub 2016 Jun 2.

Tissue-Specific Gene Repositioning by Muscle Nuclear Membrane Proteins Enhances Repression of Critical Developmental Genes during Myogenesis

Affiliations

Tissue-Specific Gene Repositioning by Muscle Nuclear Membrane Proteins Enhances Repression of Critical Developmental Genes during Myogenesis

Michael I Robson et al. Mol Cell. .

Abstract

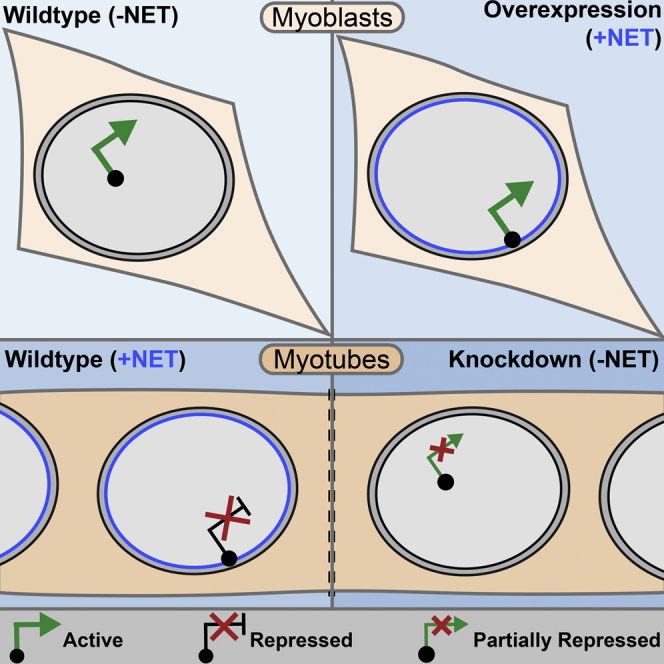
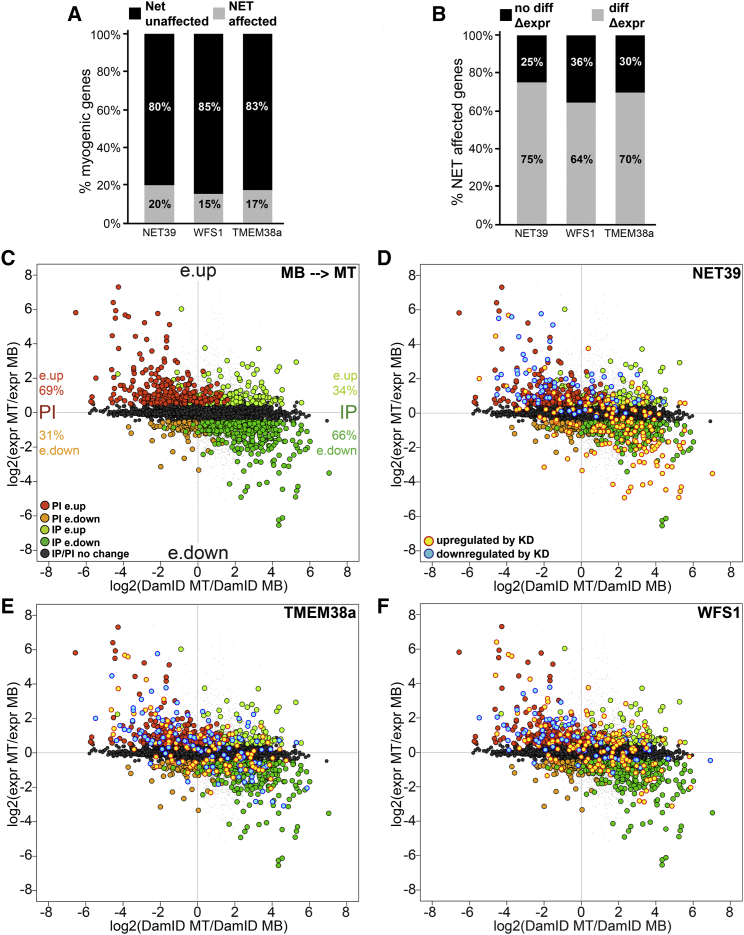
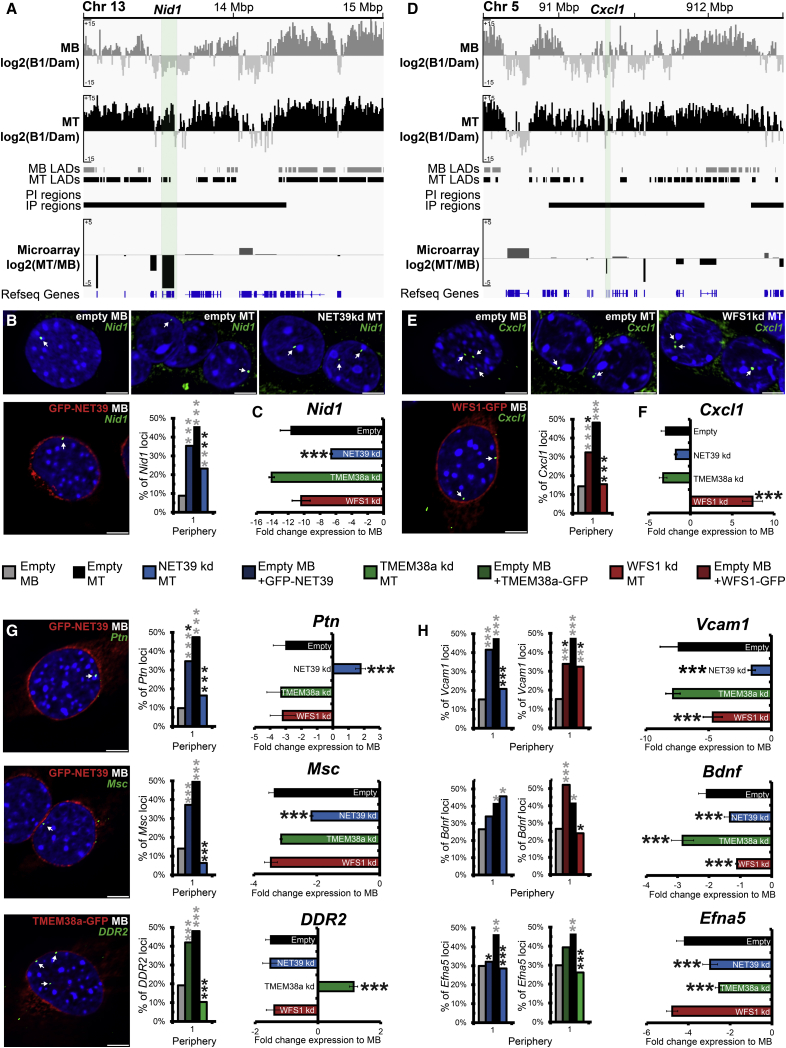
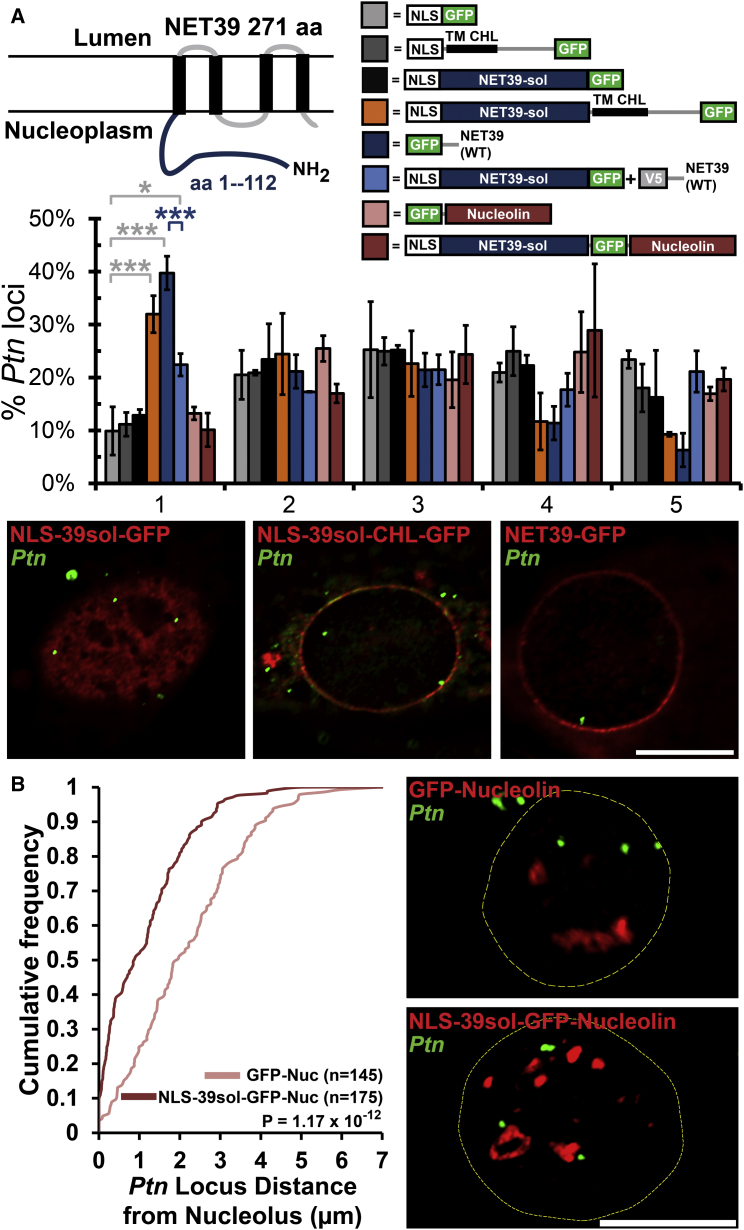
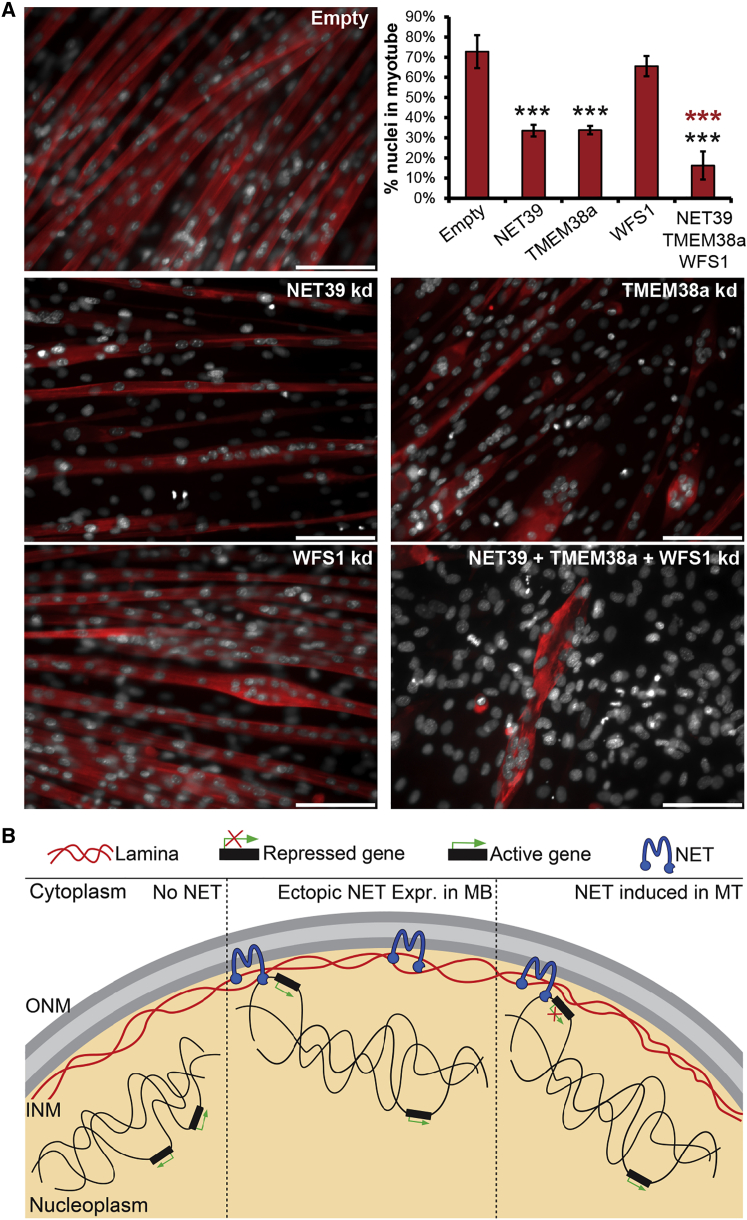
Whether gene repositioning to the nuclear periphery during differentiation adds another layer of regulation to gene expression remains controversial. Here, we resolve this by manipulating gene positions through targeting the nuclear envelope transmembrane proteins (NETs) that direct their normal repositioning during myogenesis. Combining transcriptomics with high-resolution DamID mapping of nuclear envelope-genome contacts, we show that three muscle-specific NETs, NET39, Tmem38A, and WFS1, direct specific myogenic genes to the nuclear periphery to facilitate their repression. Retargeting a NET39 fragment to nucleoli correspondingly repositioned a target gene, indicating a direct tethering mechanism. Being able to manipulate gene position independently of other changes in differentiation revealed that repositioning contributes ⅓ to ⅔ of a gene's normal repression in myogenesis. Together, these NETs affect 37% of all genes changing expression during myogenesis, and their combined knockdown almost completely blocks myotube formation. This unequivocally demonstrates that NET-directed gene repositioning is critical for developmental gene regulation.


Figures

None
Graphical abstract
Figure 1
Figure 1
NET39 Determines the Position of Chromosome 8 during Myogenesis (A) Micrographs showing normal C2C12 in vitro myogenic differentiation with undifferentiated MBs forming multi-nucleated MTs. (B) Western blot confirming the depletion of NET39 in NET39-shRNA treated MTs. (C) Representative images of the position of chromosome 8 in indicated samples. The scale bar represents 5 μm. (D) Schematic describing analysis of chromosome position at the nuclear midplane. (E) Quantification of chromosome 8 position in indicated samples. The error bars represent the SD of the means of two biological repeats of at least 50 nuclei each. For primary cells, single experiments were performed and so the error bars are absent. See also Figure S1.
Figure 2
Figure 2
Global Identification of Loci Repositioning in C2C12 Myogenesis (A) Table summarizing parameters of identified LADs and regions showing increased (IP) and decreased (PI) association with the nuclear periphery. (B) Example genome browser view of the Ttn locus with representative images and direct quantification of the position of Ttn loci in 100 nuclei (green) by FISH in MBs and MTs. ∗∗∗p < 0.001 comparing locus position in MTs to MBs using χ2 test. (C) Genome browser view for the genomic region surrounding Hgf showing DamID signal intensities, identified LADs, IP and PI regions, and microarray gene expression changes for MBs and MTs. (D) Heatmap displaying average Δlog2 DamID, Δlog2 expression, and Δlog(fold change) for indicated histone modifications values between MTs and MBs for genes within GO term categories significantly enriched in PI activated genes and IP repressed genes. Myogenic alterations to histone modifications associated with transcriptionally active genes (H3K4me2 and H3K36me3) and the transcriptional repression-associated H3K27me3 were extracted from Asp et al. (2011). The Δlog2(DamID) value was calculated by subtracting the average log2(Lamin B1/Dam) value in a 100 kb window surrounding the gene in the MB sample from the MT sample. The ChIP-seq values were determined for each histone modification by subtracting the average signal across the gene body in the MB sample from the MT sample. See also Figures S2 and S3.
Figure 3
Figure 3
Muscle-Specific NETs Function Together to Reposition a Chromosome and Genes Affected by their KD (A) Quantification of the position of human chromosome 5 in at least 50 HT1080 fibroblast nuclei expressing a single or multiple (Mixed) NETs. ∗∗∗p < 0.001 comparing the position of chromosome 5 in the GFP-NET expressing cells to the NLS-GFP (black), and ∗∗p < 0.01 comparing mixed to individual NET expressing cells using KS tests (red). (B) Western blot time course of C2C12 differentiation for indicated antibodies. (C) Immunofluorescence staining of NETs (green), lamin A or B1 (red), and DNA (blue) in indicated tissue cryosections and fixed MTs generated in vitro from mouse EDL muscle-derived satellite cells. To identify myofibers in the gastrocnemius muscle section, dystrophin (red) was stained in lieu of lamins A and B1. The insert boxes show channels for NET staining individually for indicated nuclei (). (D) Western blot of pre- and post-differentiated control and NET-KD cell lines for indicated proteins. (E) Venn diagram of total gene expression changes exceeding log2 0.5 in absolute value between NET-KD MTs relative to empty-vector treated control MTs detected by microarray analysis performed in triplicate. See also Figure S4.
Figure 4
Figure 4
Global Correlations between Gene Positioning and Expression Directed by Muscle-Specific NETs (A) Fraction of total genes normally changing during myogenesis that are altered by NET depletion. (B) Fraction of total genes altered by NET depletion that normally change during myogenesis. (C) log2(expr MT/expr MB) myogenic gene expression changes inversely correlate with average log2(DamID MT/DamID MB) myogenic lamin B1 DamID signal intensities changes. Of IP genes with altered gene expression, 66% are repressed (e.down) and 34% are activated (e.up), while for PI genes, only 31% are repressed and 69% are activated. (D–F) Identical plots as (A) with genes highlighted if upregulated (yellow) or downregulated (blue) in indicated NET-depleted MTs relative to control MTs. The NET affected genes tend to anti-correlate, i.e., loss of the NET reduces a normal repression that occurs in myogenesis or reduces a normal increase in expression. All gene expression values are mean average changes of microarray triplicate samples. See also Figure 5.
Figure 5
Figure 5
FISH and Microarray Analysis in NET KDs Confirms NET-Directed Repositioning and Expression Regulation (A and D) Genome browser views of myogenic DamID and gene expression changes of the Nid1 (A) and Cxcl1 loci (D). (B and E) FISH analysis of Nid1 (B) and Cxcl1 (E) loci position in control MBs and MTs, NET-depleted MTs, and NET-overexpressing MBs. (C and F) Histogram of Nid1 (C) and Cxcl1 (F) gene expression changes relative to MBs in control and NET-depleted MTs. (G and H) Similar microarray and FISH analysis of genes affected uniquely by depletion of a NET (Ptn, Msc, and DDR2) (G) and by depletion of multiple NETs (Vcam1, Bdnf, and Efna5) (H). For microarray data, error bars represent SD over three biological repeats, while statistics represent false discovery rates (FDR) between sample and an empty vector-treated control. For FISH, loci position was determined in 50–100 nuclei for each sample. For quantification statistics, the position of loci in the indicated sample was compared to the empty-vector MBs (gray asterisks) or MTs (black asterisks) using χ2 tests. p < 0.05, ∗∗p < 0.01, and ∗∗∗p < 0.001. All FISH statistics are in Figure S6. The scale bars represent 5 μm.
Figure 6
Figure 6
Direct Tethering Function of NET39 (A) Schematic diagrams of NET39 and fusion constructs with FISH analysis and representative images of Ptn loci positioning in indicated samples. The error bars represent SD of the mean over two biological repeats. ∗∗∗p < 0.001 and p < 0.05 comparing samples to NLS-GFP expressing MBs by χ2 tests. (B) Representative images and cumulative frequency distribution of Ptn loci distance from the edge of nucleoli in indicated samples expressing either the NET39 soluble fragment fused to nucleolin or nucleolin-GFP over two summed biological repeats. For all images, Ptn is labeled green and GFP is labeled red. The scale bars represent 5 μm. See also Figure S7.
Figure 7
Figure 7
Gene Repositioning Muscle NETs Are Critical for Myogenic Differentiation (A) Representative images and quantification of the fraction of nuclei in MTs (marked by Myh1, red) in indicated samples. ∗∗∗p < 0.001 comparing the fraction of total nuclei present within MTs relative to empty vector-treated MTs by a χ2 test. The error bars represent the SD between 5–10 fields across three biological repeats. The scale bar represents 100 μm. (B) In MBs with low levels of muscle NETs, target genes are active in the transcriptionally permissive interior. Ectopic expression of these NETs in MBs results in peripheral gene targeting without repression. However, during differentiation, normal induction of the NET repositions the locus to the periphery concomitant with an increase in repression. Loss of the gene-repositioning NET results in both failure to reposition the locus and reduced repression (Inner [INM] and outer [ONM] nuclear membranes). See also Figure S7 and Movie S1.

Similar articles

Cited by

References

    1. Akhtar W., de Jong J., Pindyurin A.V., Pagie L., Meuleman W., de Ridder J., Berns A., Wessels L.F., van Lohuizen M., van Steensel B. Chromatin position effects assayed by thousands of reporters integrated in parallel. Cell. 2013;154:914–927. - PubMed
    1. Asp P., Blum R., Vethantham V., Parisi F., Micsinai M., Cheng J., Bowman C., Kluger Y., Dynlacht B.D. Genome-wide remodeling of the epigenetic landscape during myogenic differentiation. Proc. Natl. Acad. Sci. USA. 2011;108:E149–E158. - PMC - PubMed
    1. Bakay M., Wang Z., Melcon G., Schiltz L., Xuan J., Zhao P., Sartorelli V., Seo J., Pegoraro E., Angelini C. Nuclear envelope dystrophies show a transcriptional fingerprint suggesting disruption of Rb-MyoD pathways in muscle regeneration. Brain. 2006;129:996–1013. - PubMed
    1. Bickmore W.A., van Steensel B. Genome architecture: domain organization of interphase chromosomes. Cell. 2013;152:1270–1284. - PubMed
    1. Caruelle D., Mazouzi Z., Husmann I., Delbé J., Duchesnay A., Gautron J., Martelly I., Courty J. Upregulation of HARP during in vitro myogenesis and rat soleus muscle regeneration. J. Muscle Res. Cell Motil. 2004;25:45–53. - PubMed

Publication types

MeSH terms