. 2016 Sep 1;101(9):1206-1217.
doi: 10.1113/EP085697. Epub 2016 Jul 26.

Simultaneous anterior and posterior serosal mapping of gastric slow-wave dysrhythmias induced by vasopressin

Affiliations

Simultaneous anterior and posterior serosal mapping of gastric slow-wave dysrhythmias induced by vasopressin

Peng Du et al. Exp Physiol. .

Abstract

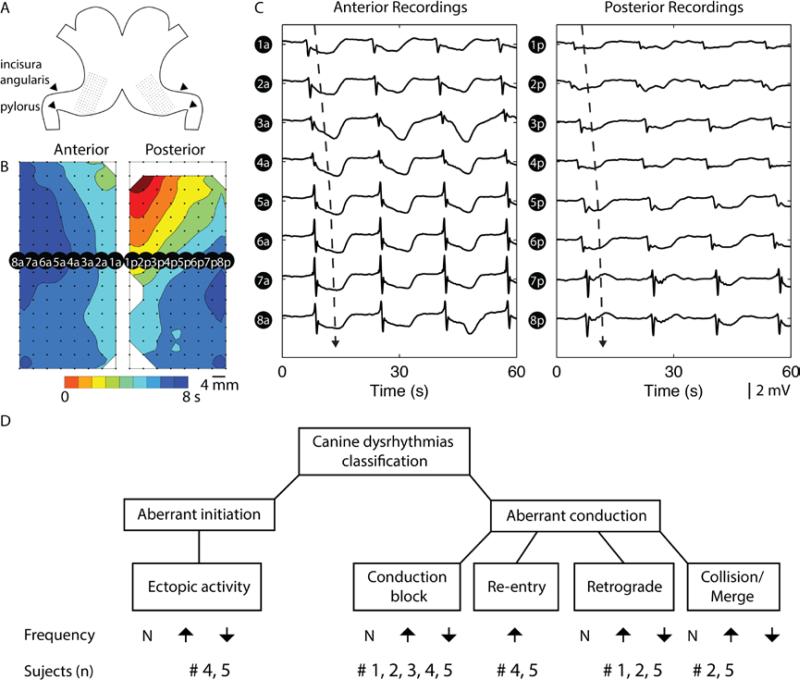
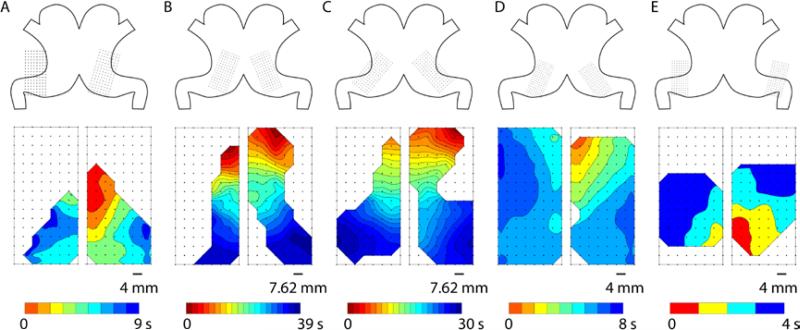
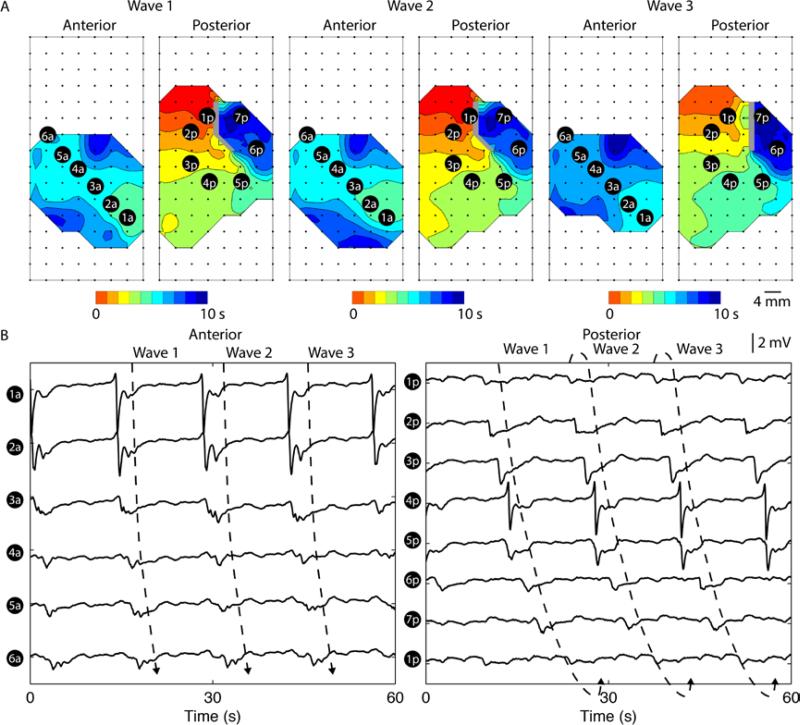
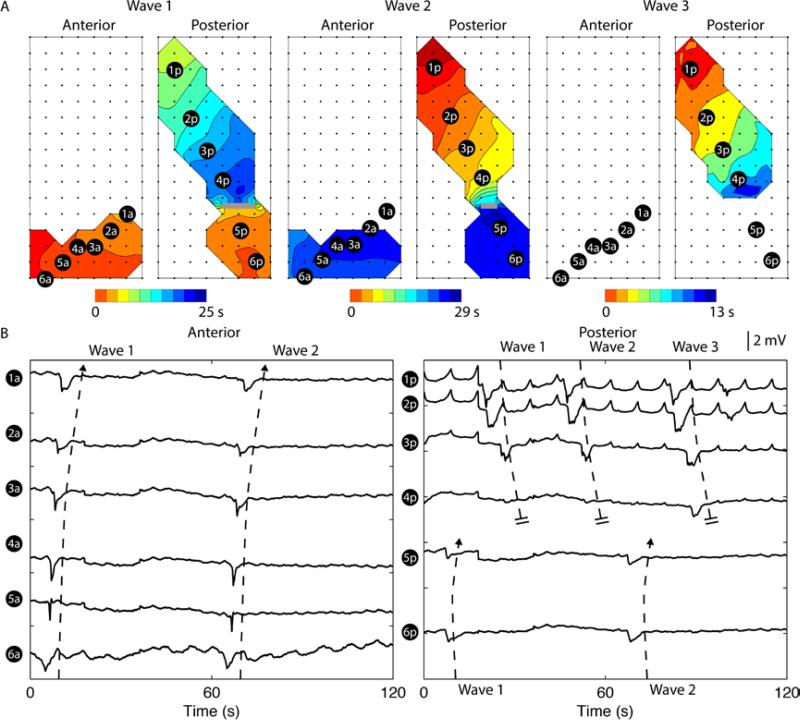
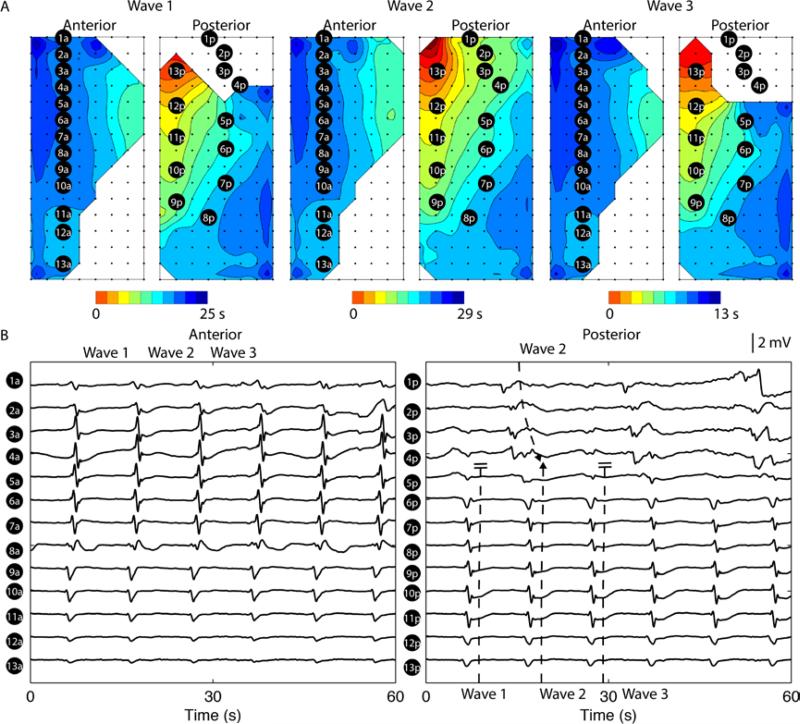
What is the central question of this study? This study aimed to provide the first comparison of simultaneous high-resolution mapping of anterior and posterior gastric serosa over sustained periods. What is the main finding and its importance? Episodes of spontaneous gastric slow-wave dysrhythmias increased significantly following intravenous infusion of vasopressin compared with the baseline state. A number of persistent dysrhythmias were defined, including ectopic activation, conduction block, rotor, retrograde and collision/merger of wavefronts. Slow-wave dysrhythmias could occur either simultaneously or independently on the anterior and posterior gastric serosa, and interacted depending on activation-repolarization and frequency dynamics. High-resolution mapping enables mechanistic insights into gastric slow-wave dysrhythmias and is now achieving clinical translation. However, previous studies have focused mainly on dysrhythmias occurring on the anterior gastric wall. The present study simultaneously mapped the anterior and posterior gastric serosa during episodes of dysrhythmias induced by vasopressin to aid understanding of dysrhythmia initiation, maintenance and termination. High-resolution mapping (8 × 16 electrodes on each serosa; 20-74 cm2 ) was performed in anaesthetized dogs. Baseline recordings (21 ± 8 min) were followed by intravenous infusion of vasopressin (0.1-0.5 IU ml-1 at 60-190 ml h-1 ) and further recordings (22 ± 13 min). Slow-wave activation maps, amplitudes, velocity, interval and frequency were calculated, and differences compared between baseline and postinfusion. All dogs demonstrated an increased prevalence of dysrhythmic events following infusion of vasopressin (17 versus 51%). Both amplitude and velocity demonstrated significant differences (baseline versus postinfusion: 3.6 versus 2.2 mV; 7.7 versus 6.5 mm s-1 ; P < 0.05 for both). Dysrhythmias occurred simultaneously or independently on the anterior and posterior serosa, and then interacted according to frequency dynamics. A number of persistent dysrhythmias were compared, including the following: ectopic activation (n = 2 animals), conduction block (n = 1), rotor (n = 2), retrograde (n = 3) and collision/merger of wavefronts (n = 2). We conclude that infusion of vasopressin induces gastric dysrhythmias, which occur across a heterogeneous range of frequencies and patterns. The results demonstrate that different classes of gastric dysrhythmias may arise simultaneously or independently in one or both surfaces of the serosa, then interact according to their relative frequencies. These results will help to inform interpretation of clinical dysrhythmia.

Keywords: gastric dysrhythmias; gastric electrical activity; high-resolution mapping; interstitial cells of Cajal.


Figures

Figure 1
Figure 1
Setup of high-resolution (HR) electrical mapping of canine stomach. A. Two electrode arrays each containing 128 electrodes arranged in a 16 by 8 configuration was placed on the anterior and posterior serosal surfaces of the stomach, in a mirrored fashion. B. Slow wave recordings were mostly obtained from lower gastric antrum region of the stomach, and reconstructed into activation map of anterior and posterior maps, representing one cycle of slow wave propagation. The red color represents early activation and the blue color represents later activation of slow waves. Each band of color represents an interval of 1 s, i.e., the larger the gap between two consecutive lines (isochrones), the more distance the slow wave propagated over the 1 s interval, therefore the faster the velocity in this region. C. A selection of recordings at 16 electrodes demonstrate the sequential propagation of slow waves (“a” denotes anterior electrodes, and “p” denotes posterior electrodes), with the dashed arrow representing the direction and wave plotted in the activation map in B. D. Classifications of gastric dysrhythmias and summary of subject numbers associated with each dysrhythmias following infusion of vasopressin.
Figure 2
Figure 2
Example activation times maps of canine gastric slow waves in five subjects (A-E). Top: The orientations and positions of the electrode arrays illustrate the coverage of the mapping fields in each subject. Bottom: Activation times map of a typical cycle of gastric slow waves from each subject, showing approximately simultaneous and antegrade propagation towards the pylorus. Note the larger arrays were used in 2 (B) and 3 (C), resulting in a substantially longer overall activation period (~35 s) and more closely-spaced isochrones (1 s interval in all activation times maps).
Figure 3
Figure 3
Canine gastric rotor on the posterior serosal surface of the stomach. A. Three consecutive rotor re-entries over a period of 60 s. Each isochronal band in the activation maps represents an interval of 1 s. Orientations and locations of the electrode arrays were identical to Figure 2E. A rotor in the counter clock-wise direction in the posterior serosal surface was detected. B. Six electrodes (1a-6a) were selected from the anterior serosal surface to demonstrate propagation in the antegrade direction towards the gastric pylorus. Seven electrodes (1p-7p) were selected from the posterior serosal surface in the direction of propagation, with electrode 1p repeated after electrode 7p, to demonstrate re-entry. A single rotor took approximately 15±4 s to complete the re-entrant pathway.
Figure 4
Figure 4
Uncoupled retrograde slow waves in both anterior and posterior soresal surfaces. A. Two consecutive retrograde activities occurred over a period of 60 s. Each isochronal band in the activation maps represents an interval of 1 s. Orientations and locations of the electrode arrays were identical to Figure 2A. Retrograde activities propagated in the oral direction in the antrum, simultaneously in both anterior and posterior serosal surfaces in wave 1 and 2. B. Six electrodes (1a-6a and 1p-6p) were selected from each serosal surface to demonstrate propagation in both directions, with all the selected electrodes demonstrating a retrograde event in the anterior serosal surface and electrodes 1p-2p demonstrating a retrograde event in the posterior serosal surface. The frequency of the retrograde activity was 0.8±0.2 cycles/min and the frequency of the antegrade activity was 2.3±0.5 cycles/min.
Figure 5
Figure 5
Uncoupled antegrade slow wave propagation in the posterior serosal surface (baseline subject Figure 2D). A. Three consecutive uncoupled antegrade activities occurred over a period of 60 s. Each isochronal band in the activation maps represents an interval of 1 s. Orientations and locations of the electrode arrays were identical to Figure 2B. The uncoupled antegrade activity occurred in the proximal portion of the posterior mapping field. B. 13 electrodes were selected from each serosal surface to demonstrate the recorded activities, with electrodes 1a-13a demonstrating activities perpendicular to the major direction of propagation in the ansterior serosa, and electrodes 1p-4p demonstrating the uncoupled activities in the posterior serosa. The frequency of the uncoupled activity was 3.1±0.1 cycles/min and the frequency of the main antegrade activity was 5.9±0.2 cycles/min (compared to the baseline frequency from the same subject: 3.6±0.2 cycles/min; P < 0.05).

Comment in

  • The 'dark' side of the stomach.
    Lammers WJ. Lammers WJ. Exp Physiol. 2017 Jan 1;102(1):134. doi: 10.1113/EP086036. Exp Physiol. 2017. PMID: 28044403 No abstract available.
  • Reply.
    Du P, O'Grady G, Paskaranandavadivel N, Tang SJ, Abell T, Cheng LK. Du P, et al. Exp Physiol. 2017 Jan 1;102(1):135. doi: 10.1113/EP086141. Exp Physiol. 2017. PMID: 28044406 No abstract available.

References

    1. Abell TL, Malagelada JR. Glucagon-evoked gastric dysrhythmias in humans shown by an improved electrogastrographic technique. Gastroenterology. 1985;88:1932–1940. - PubMed
    1. Angeli TR, Cheng LK, Du P, Wang TH-H, Bernard CE, Vannucchi M-G, Faussone-Pellegrini MS, Lahr C, Vather R, Windsor JA, Farrugia G, Abell TL, O'Grady G. Loss of Interstitial Cells of Cajal and Patterns of Gastric Dysrhythmia in Patients With Chronic Unexplained Nausea and Vomiting. Gastroenterology. 2015;149:56–66. e5. - PMC - PubMed
    1. Angeli TR, O'Grady G, Du P, Paskaranandavadivel N, Pullan AJ, Bissett IP, Cheng LK. Circumferential and functional re-entry of in vivo slow-wave activity in the porcine small intestine. Neurogastroenterol Motil. 2013;25:e304–e314. - PMC - PubMed
    1. Bradshaw LA, Irimia A, Sims JA, Richards WO. Biomagnetic signatures of uncoupled gastric musculature. Neurogastroenterol Motil. 2009;21:778–e50. - PMC - PubMed
    1. Bradshaw LA, Sims JA, Richards WO. Noninvasive assessment of the effects of glucagon on the gastric slow wave. Am J Physiol Gastrointest Liver Physiol. 2007;293:G1029–G1038. - PMC - PubMed

LinkOut - more resources