. 2016 Jun 6;15(1):45.
doi: 10.1186/s12943-016-0528-0.

Roles of acid-extruding ion transporters in regulation of breast cancer cell growth in a 3-dimensional microenvironment

Affiliations

Roles of acid-extruding ion transporters in regulation of breast cancer cell growth in a 3-dimensional microenvironment

Anne Poder Andersen et al. Mol Cancer. .

Abstract

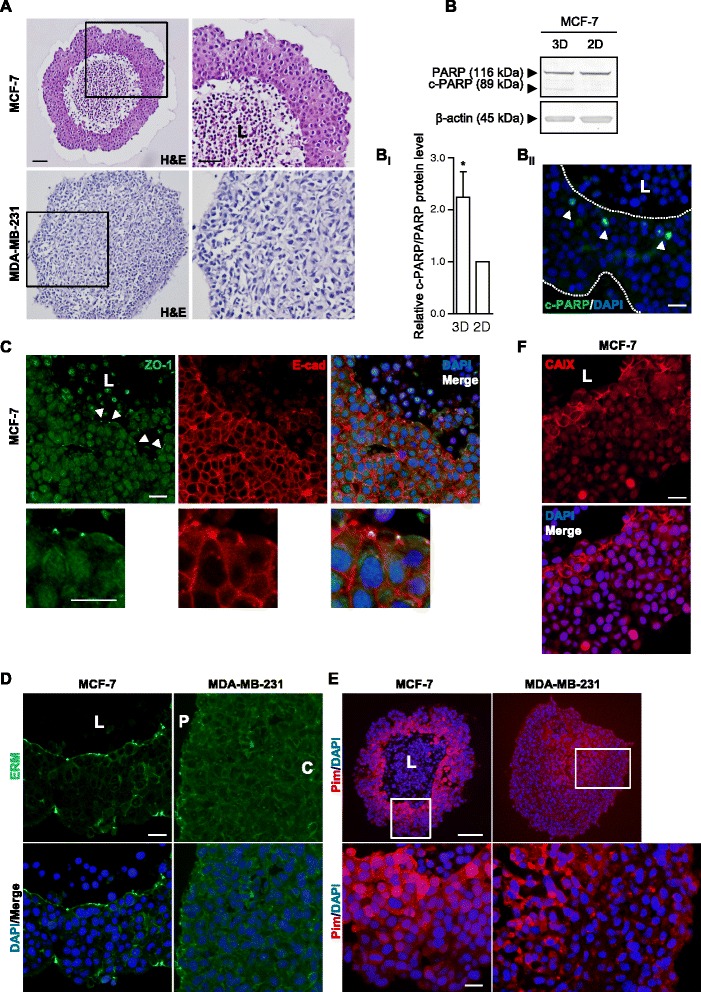
Background: The 3-dimensional (3D) microenvironment of breast carcinomas is characterized by profoundly altered pH homeostasis, reflecting increased metabolic acid production and a confined extracellular space characterized by poor diffusion, yet the relative contributions of specific pH-regulatory transporters to 3D growth are poorly understood. The aim of this work was to determine how 3D spheroid growth of breast cancer cells impacts the expression and spatial organization of major acid extruding proteins, and how these proteins in turn are required for spheroid growth.

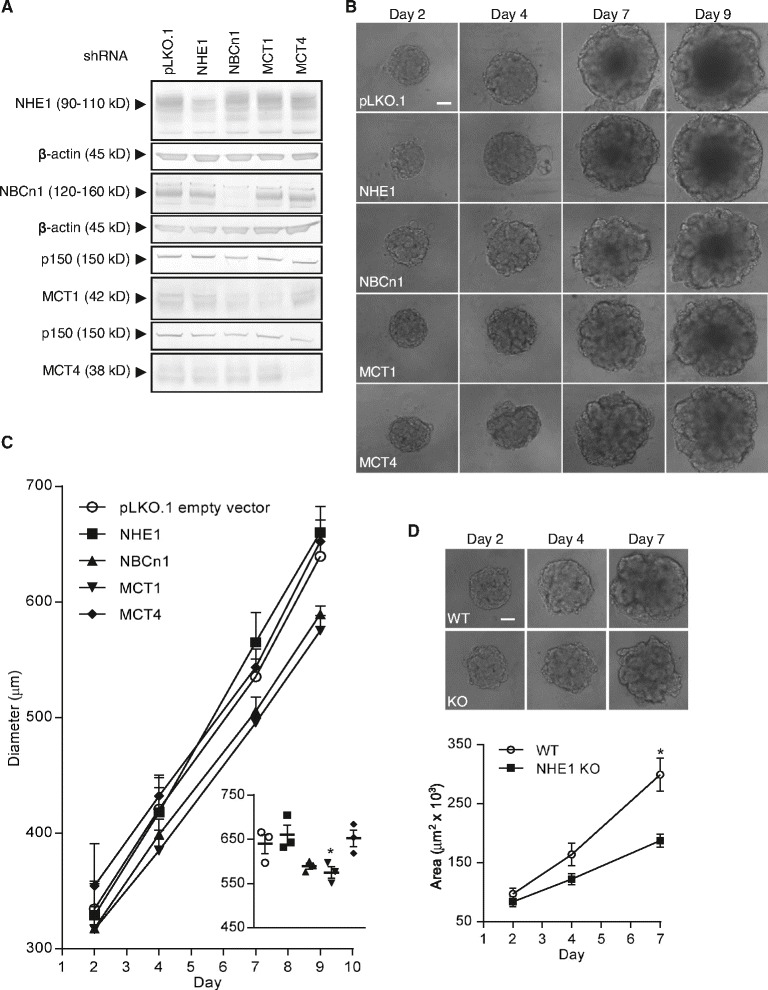
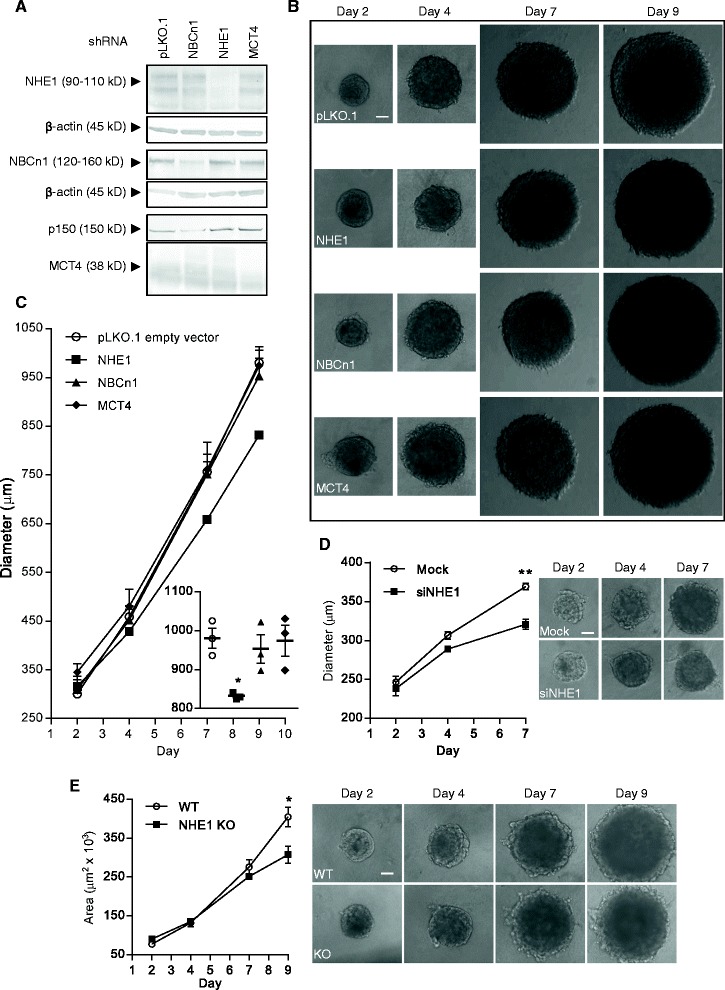
Methods: MCF-7 (Luminal-A) and MDA-MB-231 (Triple-negative) human breast cancer cells were grown as ~700-950 μm diameter spheroids, which were subjected to Western blotting for relevant transporters (2- and 3D growth), quantitative immunohistochemical analysis, and spheroid growth assays. Individual transporter contributions were assessed (i) pharmacologically, (ii) by stable shRNA- and transient siRNA-mediated knockdown, and (iii) by CRISPR/Cas9 knockout.

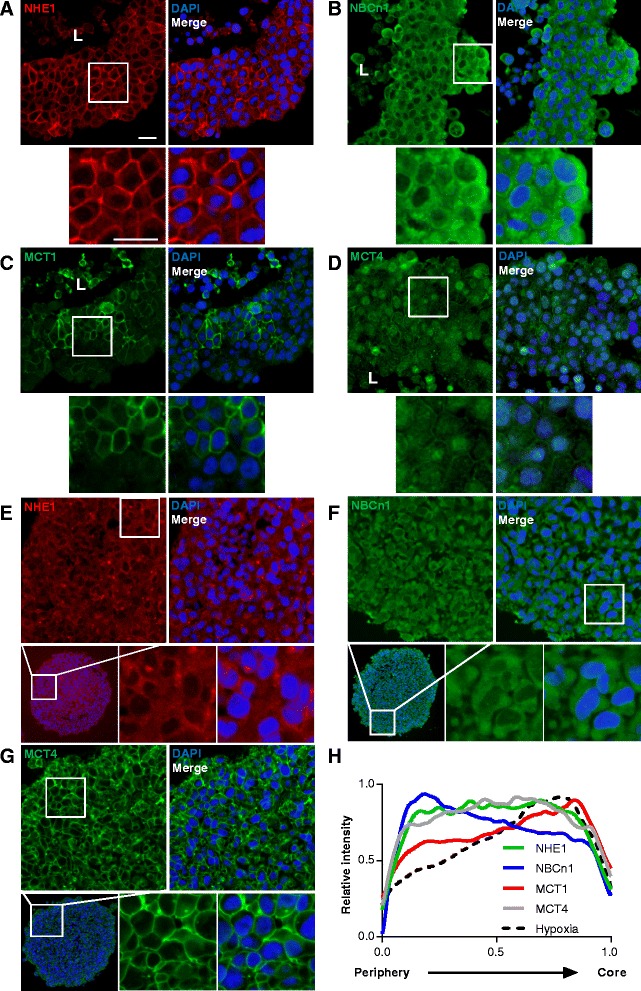
Results: In MCF-7 spheroids, expression of the lactate-H(+) cotransporter MCT1 (SLC16A1) increased from the spheroid periphery to its core, the Na(+),HCO3 (-) cotransporter NBCn1 (SLC4A7) was most highly expressed at the periphery, and the Na(+)/H(+) exchanger NHE1 (SLC9A1) and MCT4 (SLC16A3) were evenly distributed. A similar pattern was seen in MDA-MB-231 spheroids, except that these cells do not express MCT1. The relative total expression of NBCn1 and NHE1 was decreased in 3D compared to 2D, while that of MCT1 and MCT4 was unaltered. Inhibition of MCT1 (AR-C155858) attenuated MCF-7 spheroid growth and this was exacerbated by addition of S0859, an inhibitor of Na(+),HCO3 (-) cotransporters and MCTs. The pharmacological data was recapitulated by stable knockdown of MCT1 or NBCn1, whereas knockdown of MCT4 had no effect. CRISPR/Cas9 knockout of NHE1, but neither partial NHE1 knockdown nor the NHE1 inhibitor cariporide, inhibited MCF-7 spheroid growth. In contrast, growth of MDA-MB-231 spheroids was inhibited by stable or transient NHE1 knockdown and by NHE1 knockout, but not by knockdown of NBCn1 or MCT4.

Conclusions: This work demonstrates the distinct expression and localization patterns of four major acid-extruding transporters in 3D spheroids of human breast cancer cells and reveals that 3D growth is dependent on these transporters in a cell type-dependent manner, with potentially important implications for breast cancer therapy.

Keywords: Acid–base transport; MCT1; MCT4; NBCn1; NHE1; Tumor microenvironment.


Figures

Fig. 1
Fig. 1
Characterization of MCF-7 and MDA-MB-231 spheroids. Sections of MCF-7 and MDA-MB-231 spheroids that were grown for 9 days (a, b ii, c, d, e and f) followed by PFA fixation, embedding, and histological and immunohistochemical analysis (IHC). a: Hematoxylin and eosin (H&E) staining. b: MCF-7 spheroids (3D) and 2D cultures were grown for 4 days in parallel followed by lysis and Western blotting with PARP antibodies. Top panel shows representative Western blots, while panel b i shows quantifications of band intensities normalized to that of corresponding 2D culture. Error bars denote SEM. 8 n. A two-tailed, paired Student’s t-test was used to test for statistically significant difference in means between the two groups. * indicates p < 0.05. Panel b ii shows a section of a MCF-7 spheroid stained with antibodies recognizing cleaved PARP (c-PARP) only. Dashed lines indicate spheroid boundaries and arrowheads indicate c-PARP positive nuclei. Scalebar: 20 μm. c: ZO-1 and E-cadherin staining of MCF-7 spheroids. Arrowheads indicate ZO-1 puncta. Scalebars: 20 μm. d: Ezrin/Radixin/Moesin (ERM) staining. Scalebar: 20 μm. e and f: Pimonidazole (Pim) and CA IX staining was used to detect hypoxic regions. Scalebars: 100 μm and 20 μm, respectively. All images are representative of 4–5 n, except for data in d-right and e, which represent 3n. L, P and C: indicate lumen, periphery and core, respectively, of spheroids
Fig. 2
Fig. 2
Localization profiles of NHE1, NBCn1, MCT1 and MCT4 in MCF-7 and MDA-MB-231 spheroids. Sections of MCF-7 (A-D) and MDA-MB-231 (E-G) spheroids that were grown for 9 days followed by PFA fixation, embedding, and immunohistochemical analysis (IHC). a and e: NHE1 staining. b and f: NBCn1 staining. c: MCT1 staining. d and g: MCT4 staining. Images are representative of 3–5 n. Scalebars: 20 μm. L: indicates lumen of spheroid. h: Relative distribution of the transporters NHE1, NBCn1, MCT1 and MCT4 from the periphery towards the core (across the viable region) of MCF-7 spheroids. Based on two mean pixel intensity profiles per spheroid on three spheroids (only two for MCT1) from independent biological replicates per transporter/antibody (For details, see Methods)
Fig. 3
Fig. 3
NHE1, NBCn1, MCT1 and MCT4 expression in MCF-7 and MDA-MB-231 spheroids relative to 2D culture. MCF-7 and MDA-MB-231 spheroids (3D) and 2D cultures were grown 4 days in parallel, followed by lysis and Western blotting with antibodies directed against the specific transporters. Top panels in a, b, c and d show representative Western blots, while lower panels show quantifications of band intensities normalized to that of corresponding 2D culture. a: NHE1 (MCF-7: 5n, MDA-MB-231: 3n). b: NBCn1 (MCF-7 and MDA-MB-231: 3n). c: MCT4 (MCF-7 and MDA-MB-231: 3n). d: MCT1 (3n). Error bars denote SEM. A two-tailed, paired Student’s t-test was used to test for statistically significant difference in means between the two groups. * and *** indicate p < 0.05 and p < 0.001, respectively
Fig. 4
Fig. 4
Effect of pharmacological inhibitors of NHE1, NBCn1, and MCT1 on MCF-7 spheroid growth. MCF-7 spheroids were treated with inhibitors of NHE1 (Cariporide, 10 μM), NBC (S0859, 50 μM), and MCT1 (AR-C, 20 μM) on day 2 and their growth was monitored for seven days (until day 9). a: Representative light microscopic images of the spheroids (10×) on day 2, 4, 7 and 9. Scalebar: 100 μm. Numbers in parentheses indicate number of days treated with the respective inhibitors. b: Quantification of spheroid diameters shown in a. n = 3-5. Error bars denote SEM. The horizontal dashed line indicates the mean diameter of all spheroids on day 2. There was no statistical significant difference in spheroid diameter between the groups on day 2 (tested by a one-way ANOVA with Tukey’s multiple comparisons post-test). The dotplot insert shows diameters on day 9. Mean and SEM are indicated. One-way ANOVA with Dunnett’s multiple comparisons post-test was used to test for statistically significant differences between treatment groups and their respective vehicle control (Ctrl./DMSO). * indicates p-value < 0.05
Fig. 5
Fig. 5
Roles of NHE1, NBCn1, MCT1 and MCT4 in MCF-7 spheroid growth. MCF-7 cells were transduced with lentivirus containing plasmids with shRNA constructs targeted against NHE1, NBCn1, MCT1 or MCT4, respectively. Transduction with the empty vector pLKO.1 (pLKO.1) was used as control. a: Western blotting with antibodies directed against the specific transporters was performed to verify knockdown of the respective transporters. b: The transduced cell lines were grown as spheroids, and representative light microscopic images (10×) of the spheroids on day 2, 4, 7 and 9 are shown. Scalebar: 100 μm. 3n. c: Quantification of spheroid diameters shown in b. The dot-plot insert shows diameters on day 9. Mean and SEM are indicated. One-way ANOVA with Dunnett’s multiple comparisons post-test was used to test for statistical significant differences between pLKO.1 and the respective groups. d: NHE1 expression was ablated in MCF-7 cells by CRISPR/Cas9-mediated knockout (KO) and wild-type (WT) and KO cells were grown as spheroids for seven days. Lower panel shows quantification of spheroid areas while the top panel shows representative light microscopic images (10×) of the spheroids on day 2, 4 and 7. Scale bar: 100 μm. 3 n. Error bars denote SEM. A Student’s t-test (unpaired) was used to test for statistical significant difference between the wild-type and NHE1 knockout. * indicates p < 0.05
Fig. 6
Fig. 6
Effect of stable knockdown of NHE1, NBCn1 or MCT4 on growth of MDA-MB-231 spheroids. MDA-MB-231 cells were transduced with lentivirus containing plasmids with shRNA constructs targeted against NHE1, NBCn1 or MCT4. Transduction with the empty vector pLKO.1 (pLKO.1) was used as control. a: Western blotting with antibodies directed against the specific transporters was performed to verify knockdown of the respective transporters. b: The transduced cell lines were grown as spheroids, and representative light microscopic images (10×) of the spheroids on day 2, 4, 7 and 9 are shown. Scalebar: 100 μm. 3n. c: Quantification of spheroid diameters shown in b. The dotplot insert shows diameters on day 9. Mean and SEM are indicated. One-way ANOVA with Dunnett’s multiple comparisons post-test was used to test for statistical significant differences between pLKO.1 and the respective groups. d: NHE1 was transiently knocked down in MDA-MB-231 cells by siRNA interference and cells were grown as spheroids. Representative light microscopic images (10×) of the spheroids on day 2, 4 and 7 are shown on the right while quantification of spheroid diameters is shown on the left. Scalebar: 100 μm. 3n. Error bars denote SEM. A two-tailed, paired Student’s t-test was used to test for statistically significant difference in means between the two groups on day 7. e: NHE1 expression was ablated in MDA-MB-231 cells by CRISPR/Cas9-mediated knockout (KO) and grown as spheroids for nine days. Left panel shows quantification of spheroid areas while the right panel shows representative light microscopic images (10×) of the spheroids on day 2, 4, 7 and 9. Scalebar: 100 μm. 3 n. Error bars denote SEM. WT: wild-type. A two-tailed, unpaired Student’s t-test was used to test for statistically significant difference in means between the two groups on day 9. * and ** indicate p < 0.05 and p < 0.01, respectively

References

    1. Chen JL, Lucas JE, Schroeder T, Mori S, Wu J, Nevins J, et al. The genomic analysis of lactic acidosis and acidosis response in human cancers. PLoS Genet. 2008;4:e1000293. doi: 10.1371/journal.pgen.1000293. - DOI - PMC - PubMed
    1. Gaedtke L, Thoenes L, Culmsee C, Mayer B, Wagner E. Proteomic analysis reveals differences in protein expression in spheroid versus monolayer cultures of low-passage colon carcinoma cells. J Proteome Res. 2007;6:4111–4118. doi: 10.1021/pr0700596. - DOI - PubMed
    1. Cukierman E, Pankov R, Stevens DR, Yamada KM. Taking cell-matrix adhesions to the third dimension. Science. 2001;294:1708–1712. doi: 10.1126/science.1064829. - DOI - PubMed
    1. Pampaloni F, Reynaud EG, Stelzer EH. The third dimension bridges the gap between cell culture and live tissue. Nat Rev Mol Cell Biol. 2007;8:839–845. doi: 10.1038/nrm2236. - DOI - PubMed
    1. Hirschhaeuser F, Menne H, Dittfeld C, West J, Mueller-Klieser W, Kunz-Schughart LA. Multicellular tumor spheroids: an underestimated tool is catching up again. J Biotechnol. 2010;148:3–15. doi: 10.1016/j.jbiotec.2010.01.012. - DOI - PubMed

Publication types

MeSH terms

Substances