Randomized Controlled Trial
. 2016 Jun:15:38-55.
doi: 10.1016/j.epidem.2016.01.001. Epub 2016 Feb 1.

Design and methods of a social network isolation study for reducing respiratory infection transmission: The eX-FLU cluster randomized trial

Affiliations
Randomized Controlled Trial

Design and methods of a social network isolation study for reducing respiratory infection transmission: The eX-FLU cluster randomized trial

Allison E Aiello et al. Epidemics. 2016 Jun.

Abstract

Background: Social networks are increasingly recognized as important points of intervention, yet relatively few intervention studies of respiratory infection transmission have utilized a network design. Here we describe the design, methods, and social network structure of a randomized intervention for isolating respiratory infection cases in a university setting over a 10-week period.

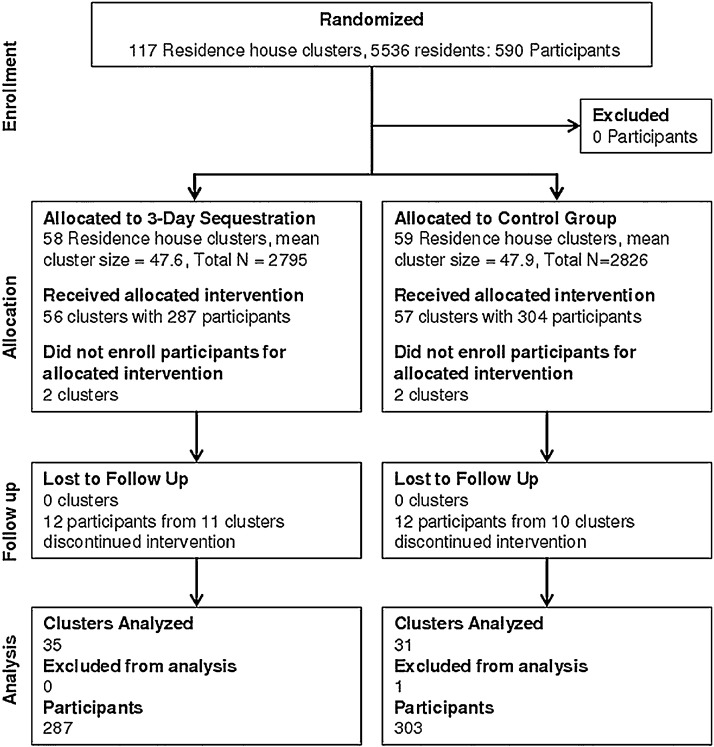
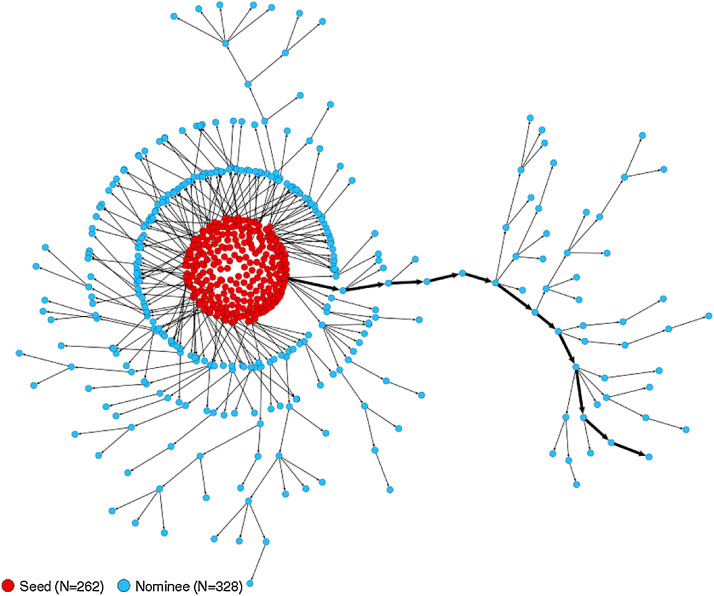
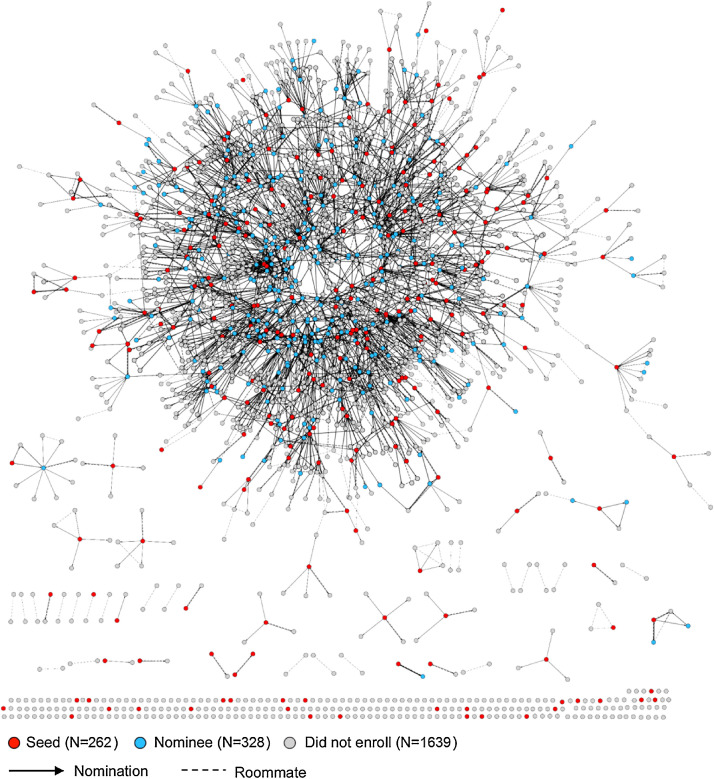
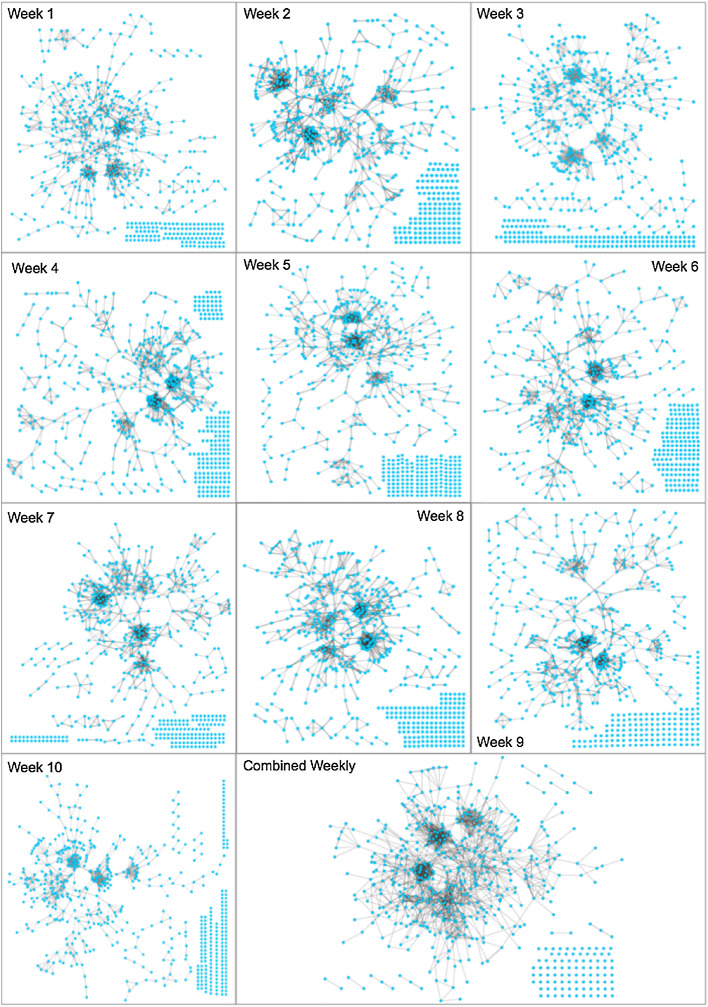
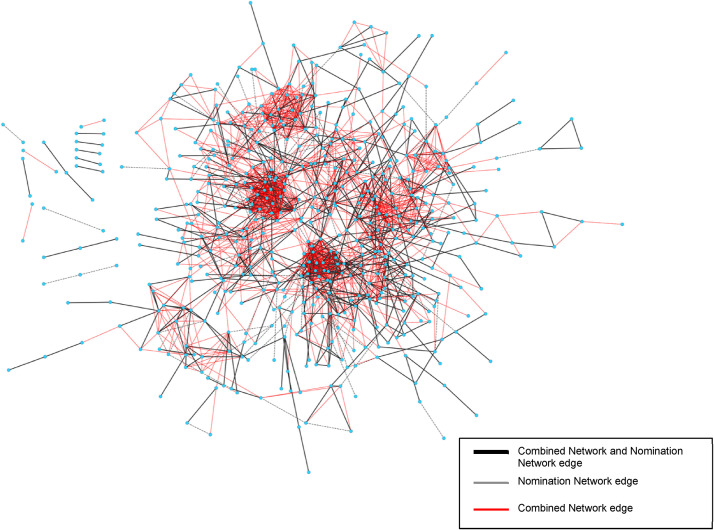
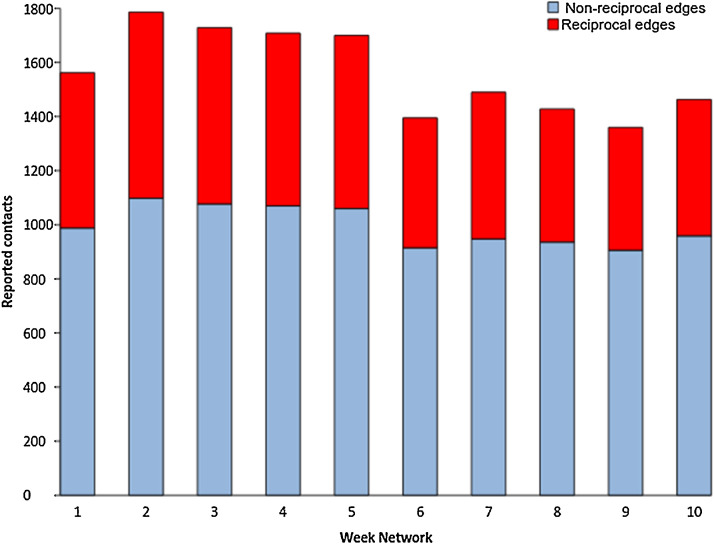
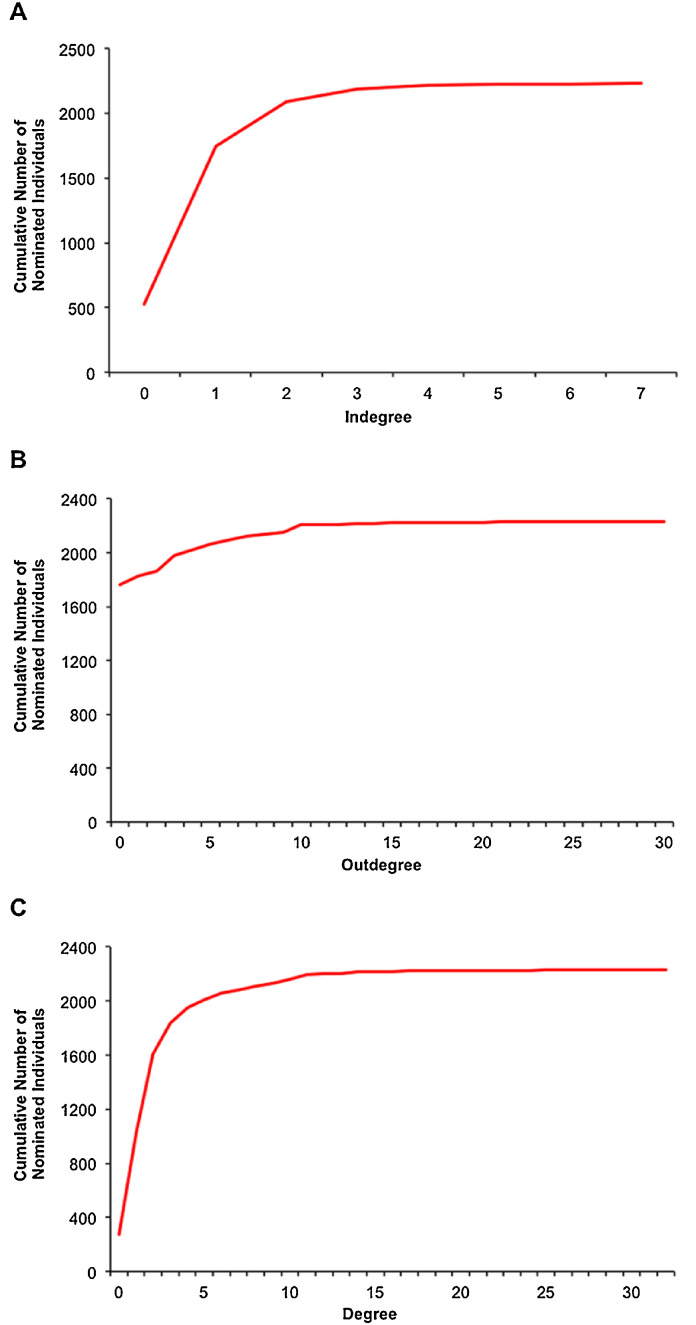
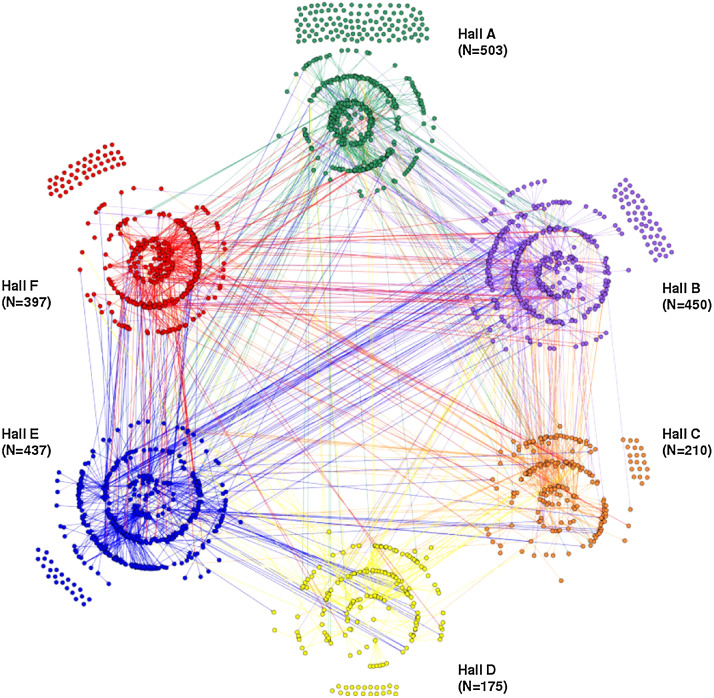
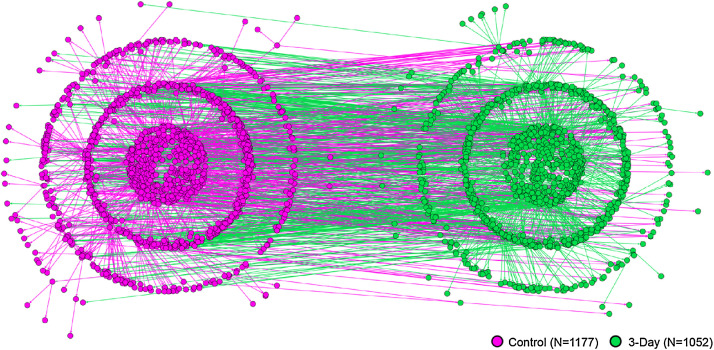
Methodology/principal findings: 590 students in six residence halls enrolled in the eX-FLU study during a chain-referral recruitment process from September 2012-January 2013. Of these, 262 joined as "seed" participants, who nominated their social contacts to join the study, of which 328 "nominees" enrolled. Participants were cluster-randomized by 117 residence halls. Participants were asked to respond to weekly surveys on health behaviors, social interactions, and influenza-like illness (ILI) symptoms. Participants were randomized to either a 3-Day dorm room isolation intervention or a control group (no isolation) upon illness onset. ILI cases reported on their isolation behavior during illness and provided throat and nasal swab specimens at onset, day-three, and day-six of illness. A subsample of individuals (N=103) participated in a sub-study using a novel smartphone application, iEpi, which collected sensor and contextually-dependent survey data on social interactions. Within the social network, participants were significantly positively assortative by intervention group, enrollment type, residence hall, iEpi participation, age, gender, race, and alcohol use (all P<0.002).

Conclusions/significance: We identified a feasible study design for testing the impact of isolation from social networks in a university setting. These data provide an unparalleled opportunity to address questions about isolation and infection transmission, as well as insights into social networks and behaviors among college-aged students. Several important lessons were learned over the course of this project, including feasible isolation durations, the need for extensive organizational efforts, as well as the need for specialized programmers and server space for managing survey and smartphone data.

Keywords: Influenza; Isolation; Respiratory infection; Social distancing; Social network.


Figures

Fig. 1
Fig. 1
eX-FLU Consort diagram.
Fig. 2
Fig. 2
Cluster example. An example showing how clusters are determined within a residence hall, based on a range of factors, including resident advisor jurisdiction, geographic proximity of residence hall rooms, and physical building barriers such as location of shared bathrooms, staircases, doors, and/or firewall dividers.
Fig. 3
Fig. 3
eX-FLU chain referral process (N = 590). Each node (circle) in the network represents an enrolled eX-FLU participant. Nodes are colored according to enrollment status: seed (enrolled independently) or nominee (accepted an invitation, i.e., nomination, from a participant). Each accepted invitation from a participant is represented by an arrow, directed at the nominated individual. The highlighted arrows show an example of the longest chain in the chain-referral network, with a single seed initiating 11 subsequent waves of accepted nominations. The complete chain-referral process with these edges, as well as unaccepted nominations, is shown in Fig. 4. (For interpretation of the references to color in this figure legend, the reader is referred to the web version of this article.)
Fig. 4
Fig. 4
eX-FLU Nomination Network (N = 2229). Each node (circle) in the network represents an eligible individual who received a nomination from an enrolled participant or an enrollment email from eX-FLU staff. Nodes are linked by a nomination edge (arrow), with the arrowhead directed at the nominee, and/or by a roommate edge (dashed line). Individuals who joined the study are colored according to seed (enrolled independently) or nominee (accepted an invitation, i.e., nomination, from a participant) status. Individuals who did not join the study are not colored. (For interpretation of the references to color in this figure legend, the reader is referred to the web version of this article.)
Fig. 5
Fig. 5
Individual Week and Combined Weekly Networks. Each node (circle) in the network represents an enrolled participant in the eX-FLU study (N = 590) and the edges between them represent a face-to-face contact reported on a given weekly survey. In the individual Week Networks, edges are directed with an arrow from the individual who reported the contact to the participant with whom they reported contact and may be reciprocal, if both participants reported the contact. In the Combined Weekly Network, each undirected edge represents contact between two participants reported at least once during the study period, by one or both participants.
Fig. 6
Fig. 6
Nomination Network and Combined Weekly Network. Each node (circle) in the network represents an enrolled participant in the eX-FLU study (N = 532 (excludes isolate participants)). Thick, black edges represent an edge between two participants that was both a nomination link (i.e., in the Nomination Network) as well as a face-to-face contact reported on a weekly survey (i.e., in the Combined Weekly Network) (number of edges = 556). Dotted edges were nominations between two participants that were not subsequently captured as a face-to-face contact on a weekly survey (number of edges = 99) and red edges were face-to-face contacts found in the Combined Weekly Network that were not also nominations (number of edges = 1310). (For interpretation of the references to color in this figure legend, the reader is referred to the web version of this article.)
Fig. 7
Fig. 7
Proportions of reciprocal and non-reciprocal reported face-to-face contacts in each Week Network.
Fig. 8
Fig. 8
Cumulative degree distributions for the eX-FLU Nomination Network. Cumulative number of nominated individuals by (A) indegree, (B) outdegree, and (C) total degree.
Fig. 9
Fig. 9
Assortativity by residence hall for the eX-FLU Nomination Network (N = 2172). Each node (circle) in the network represents an individual nominated to join the eX-FLU study. Nodes are grouped and colored according to residence hall and colored lines represent nominations sent from residents of a particular hall. Individuals who moved out of an eligible hall prior to the intervention period (N = 57) were excluded. (For interpretation of the references to color in this figure legend, the reader is referred to the web version of this article.)
Fig. 10
Fig. 10
Assortativity by intervention group for the eX-FLU Nomination Network (N = 2229). Each node (circle) in the network represents an individual nominated to join the eX-FLU study. Nodes are grouped and colored according to intervention arm (Control, 3-Day) and colored lines represent nominations sent from residents in a particular intervention group. (For interpretation of the references to color in this figure legend, the reader is referred to the web version of this article.)
Fig. 11
Fig. 11
iEpi Bluetooth network (N = 103). Network of Bluetooth contacts between smartphones in the iEpi sub-study. Each node (circle) represents an individual in the iEpi Sub-study, and the links (edges) between nodes represent Bluetooth detections between smartphones of individuals in the sub-study. Nodes are colored by intervention arm (yellow = Control, blue = 3-Day). Node size is proportional to the total number of Bluetooth detections by that individual's smartphone with any other sub-study phone, and link thickness indicates the number of Bluetooth contacts between those two nodes over the entire study (from thinnest to thickest: ≤10 contacts, 11–100 contacts, 101–1000 contacts, > 1000 contacts). A small number of individuals had over 10,000 contacts with one another, indicated by red edges. (For interpretation of the references to color in this figure legend, the reader is referred to the web version of this article.)

References

    1. Aiello A.E., Murray G.F., Perez V., Coulborn R.M., Davis B.M. Mask use, hand hygiene, and seasonal influenza-like illness among young adults: a randomized intervention trial. J. Infect. Dis. 2010;201(4):491–498. - PubMed
    1. Aiello A.E., Perez V., Coulborn R.M., Davis B.M., Uddin M., Monto A.S. Facemasks, hand hygiene, and influenza among young adults: a randomized intervention trial. PLoS ONE. 2012;7(1):e29744. - PMC - PubMed
    1. Aledort J.E., Lurie N., Wasserman J., Bozzette S.A. Non-pharmaceutical public health interventions for pandemic influenza: an evaluation of the evidence base. BMC Public Health. 2007;7(1):208. - PMC - PubMed
    1. Ali M.M., Amialchuk A., Nikaj S. Alcohol consumption and social network ties among adolescents: evidence from add health. Addict. Behav. 2014;39(5):918–922. - PubMed
    1. Anthonisse J.M. Sticht. Math. Centrum. Math. Besliskd.; 1971. The Rush in a Directed Graph; pp. 1–10.

Publication types