. 2016 Jul 17;15(14):1908-18.
doi: 10.1080/15384101.2016.1191706. Epub 2016 Jun 6.

Metformin is also effective on lactic acidosis-exposed melanoma cells switched to oxidative phosphorylation

Affiliations

Metformin is also effective on lactic acidosis-exposed melanoma cells switched to oxidative phosphorylation

Silvia Peppicelli et al. Cell Cycle. .

Abstract

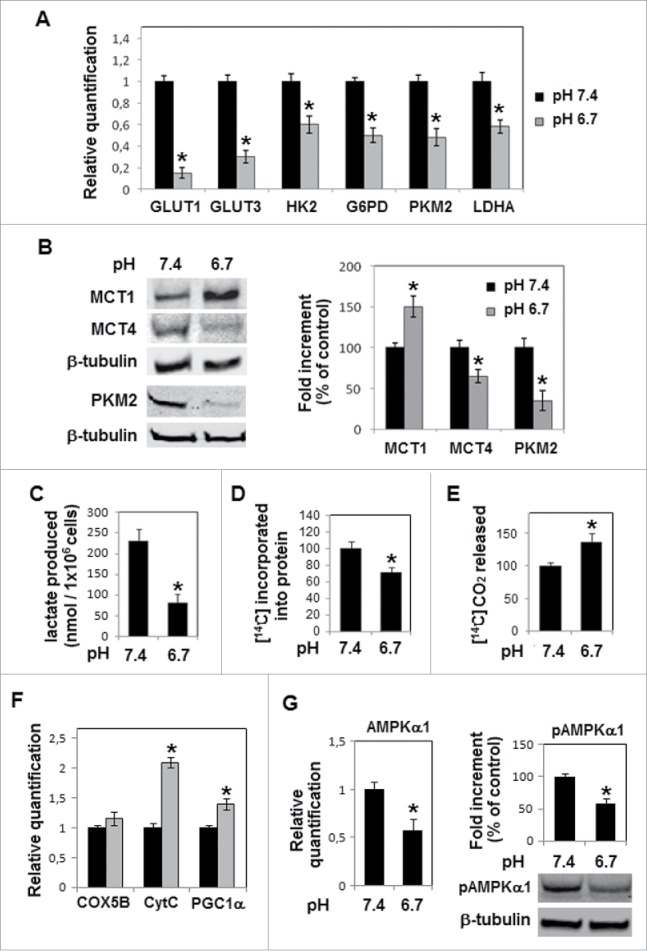
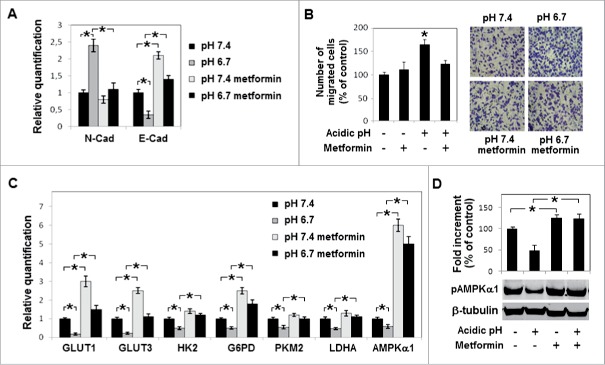
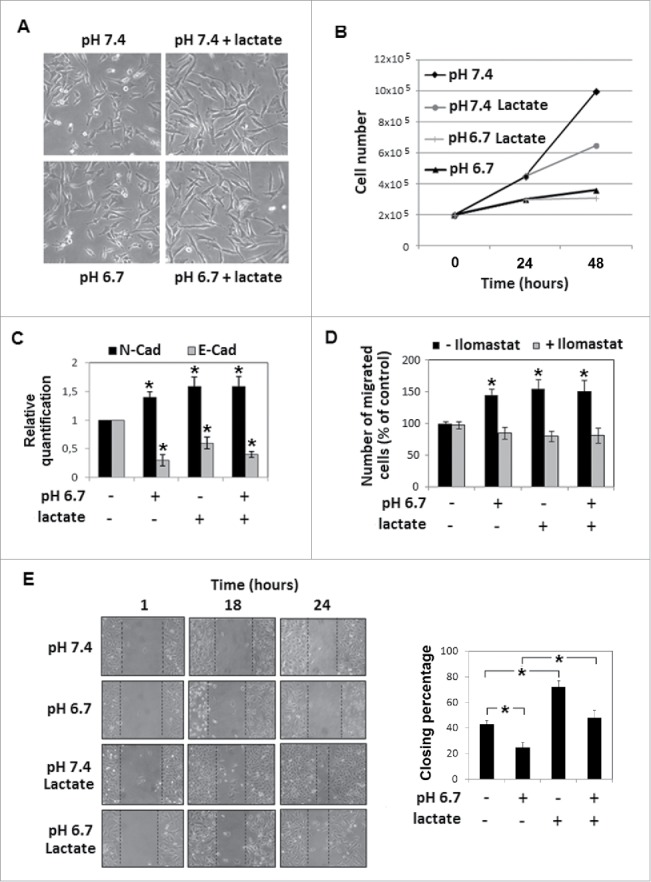
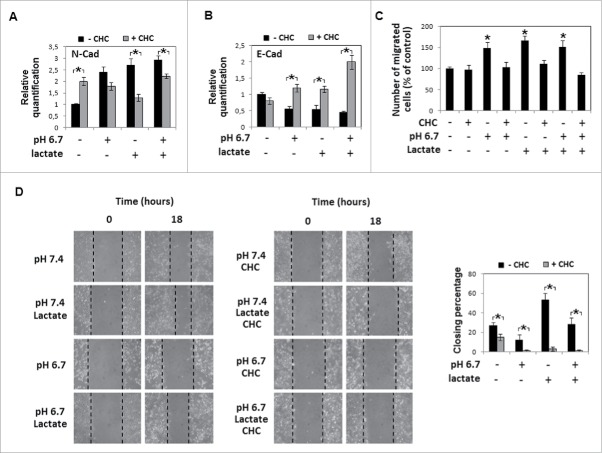
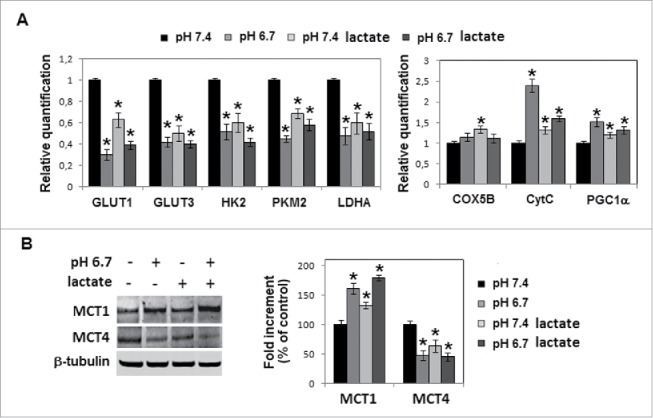
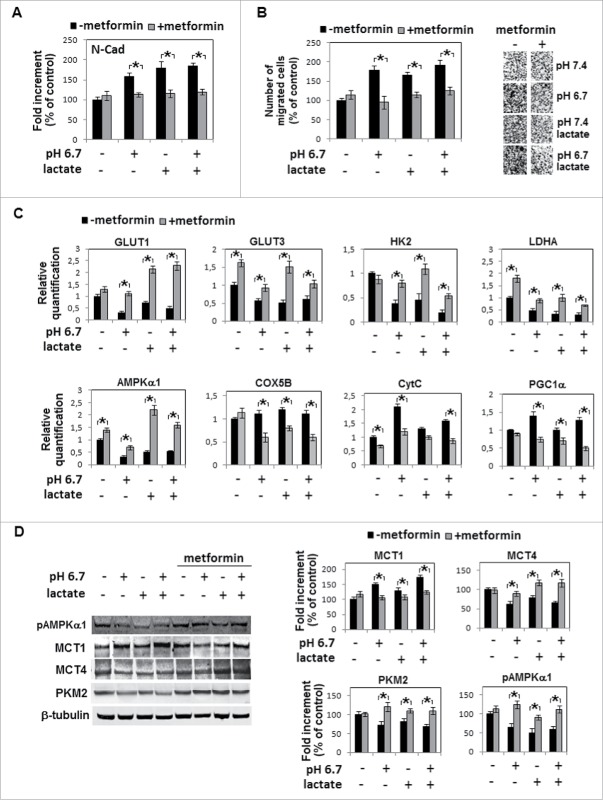
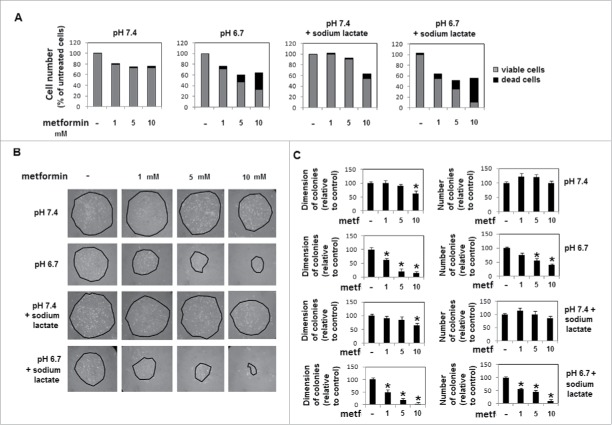
Low extracellular pH promotes in melanoma cells a malignant phenotype characterized by an epithelial-to-mesenchymal transition (EMT) program, endowed with mesenchymal markers, high invasiveness and pro-metastatic property. Here, we demonstrate that melanoma cells exposed to an acidic extracellular microenvironment, 6.7±0.1, shift to an oxidative phosphorylation (Oxphos) metabolism. Metformin, a biguanide commonly used for type 2 diabetes, inhibited the most relevant features of acid-induced phenotype, including EMT and Oxphos. When we tested effects of lactic acidosis, to verify whether sodium lactate might have additional effects on acidic melanoma cells, we found that EMT and Oxphos also characterized lactic acid-treated cells. An increased level of motility was the only gained property of lactic acidic-exposed melanoma cells. Metformin treatment inhibited both EMT markers and Oxphos and, when its concentration raised to 10 mM, it induced a striking inhibition of proliferation and colony formation of acidic melanoma cells, both grown in protons enriched medium or lactic acidosis. Thus, our study provides the first evidence that metformin may target either proton or lactic acidosis-exposed melanoma cells inhibiting EMT and Oxphox metabolism. These findings disclose a new potential rationale of metformin addition to advanced melanoma therapy, e.g. targeting acidic cell subpopulation.

Keywords: Acidic microenvironment; cell metabolism; lactic acidosis; melanoma cells; metformin.


Figures

Figure 1.
Figure 1.
Metabolic profile of acidic melanoma cells: A) Quantitative real-time PCR of GLUT1, GLUT3, HK2, G6PD, PKM2, LDHA expression in melanoma cells grown for 24 hours in acidic (pH 6.7) or non-acidic medium (pH 7.4). B) Western blot analysis of MCT-1, MCT-4 and PKM2 in acidic and non-acidic melanoma cells. Each band of Western blot was quantified by densitometric analysis and a corresponding histogram was constructed as relative to β-tubulin. Representative Western blot panels on the left. C) Lactate extruded by acidic or non-acidic melanoma cells normalized on number of cells. D) Incorporation of [14C] into proteins and E) respiration of [14C]-lactate, evaluated as [14C]-CO2 released. F) Expression of Oxphos genes (COX5B, CytC, PGC1α) and, G) AMPKα1 expression and phosphorylation (pAMPKα1). Values presented are mean ± SEM of 3 independent experiments. * p < 0.05.
Figure 2.
Figure 2.
Metformin inhibition mesenchymal profile and metabolic adaptation of acidic melanoma cells: A) Evaluation by quantitative real-time PCR of N- and E-Cadherin expression in metformin-treated (1 mM for 24 hours) melanoma cells grown in acidic (pH 6.7) or non-acidic medium (pH 7.4). B) Change in invasiveness through Matrigel-coated filters of metformin-treated acidic melanoma cells. C) Quantitative real-time PCR of GLUT1, GLUT3, HK2, G6PD, PKM2, LDHA and AMPKα1 expression in metformin-treated acidic or non-acidic melanoma cells. D) Metformin promotion of AMPKα1 activity evaluated by western blot of pAMPKα1. Values presented are mean ± SEM of 3 independent experiments. * p < 0.05.
Figure 3.
Figure 3.
Effects of sodium lactate addition to the acidic medium on melanoma cells: A) Cell morphology and B) growth of A375M6 human melanoma cells in acidic medium containing 10 mM sodium lactate. C) Quantitative real-time PCR of N- and E-Cadherin expression in melanoma cells grown in acidic (pH 6.7) medium containing or not sodium lactate. 18s ribosomal RNA was used as reference gene. D) Invasiveness through Matrigel-coated filters of melanoma cells grown in acidic medium containing or not sodium lactate, and in the presence or absence of Ilomastat. Migration is reported as a percentage of control cells. E) Wound healing assay of melanoma cells grown in acidic (pH 6.7) or non-acidic (pH 7.4) medium with or without sodium lactate. Efficiency of closure was evaluated 18 and 24 hours after wounding (see histogram and statistics at the 24th hour). Data are expressed as mean ± SEM of 3 independent experiments.* p < 0.05.
Figure 4.
Figure 4.
Effects of CHC treatment on melanoma cells grown in an acidic medium with sodium lactate: Quantitative real-time PCR of A) N-Cadherin and B) E-Cadherin mRNA expression in melanoma cells grown in acidic (pH 6.7) or non-acidic medium in the presence or absence of 10 mM sodium lactate and treated with 5mM CHC. C) Change in invasiveness through Matrigel-coated filters of CHC-treated A375M6 melanoma cells grown in an acidic medium containing sodium lactate. Data are expressed as mean ± SEM of 3 independent experiments. * p < 0.05. D) Wound healing assay of melanoma cells grown in acidic (pH 6.7) or non-acidic (pH 7.4) medium with or without sodium lactate. The wound closure was evaluated 18 hours since its creation (see histograms and statistics). *p < 0.05.
Figure 5.
Figure 5.
Metabolic profile of acidic cells treated with sodium lactate: A) Quantitative real-time PCR of glucose transporters GLUT1 and GLUT3, glycolytic enzymes HK2, PKM2, LDHA and oxphos genes (COX5B, CytC, PGC1α) expression in melanoma cells grown in acidic (pH 6.7) or non-acidic medium (pH 7.4) in the presence or absence of 10 mM sodium lactate. B) Western blot analysis of MCT-1 and MCT-4 expression in melanoma cells grown for 24 hours in acidic medium in the presence or absence of sodium lactate. Each band of western blot was quantified by densitometric analysis and the corresponding histogram was constructed as relative to β-tubulin. Representative Western blot panels on the left. Data are expressed as mean ± SEM of 3 independent experiments. * p< 0.05.
Figure 6.
Figure 6.
Metformin inhibition of both mesenchymal profile and metabolic adaptation of lactic acidosis-exposed melanoma cells: A) Densitometric analysis of N-cadherin protein level, B) invasiveness and C) quantitative real-time PCR of GLUT1, GLUT3, HK2, LDHA, AMPKα1, COX5B, CytC and PGC1α in melanoma cells grown in acidic (pH 6.7) or non-acidic medium containing sodium lactate and treated with 1mM metformin. D) Western blot analysis of MCT-1, MCT-4, PKM2 and pAMPKα1 of melanoma cells grown in acidic medium in the presence of sodium lactate and/or metformin. Each band of western blot was quantified by densitometric analysis and the corresponding histogram was constructed as relative to β-tubulin. Representative Western blot panels on the left. Data are expressed as mean ± SEM of 3 independent experiments. * p < 0.05.
Figure 7.
Figure 7.
Viability and colony-forming ability of melanoma cells exposed to proton or lactic acidosis and treated with metformin at different dosages: A) Growth of melanoma cells for 24 hours in a medium of pH 7.4 or 6.7 and treated with 1, 5 or 10 mM metformin. Histograms refer percentage of viable (in gray) and dead (in black) cells. B) Representative images and C) histograms of diameter and number of colonies obtained by seeding, in a 4 cm dish, 4 × 10³ cells collected from metformin-treated (1, 5 or 10 mM for 24 hours) acidic and non-acidic melanoma cultures. Data are expressed as mean ± SEM of 3 independent experiments. * p < 0.05.

Similar articles

Cited by

References

    1. Gatenby RA, Gillies RJ. Why do cancers have high aerobic glycolysis? Nat Rev Cancer 2004; 4:891-9; PMID:15516961; http://dx.doi.org/10.1038/nrc1478 - DOI - PubMed
    1. Vander Heiden MG, Cantley LC, Thompson CB. Understanding the Warburg effect: the metabolic requirements of cell proliferation. Science 2009; 324:1029-33; PMID:19460998; http://dx.doi.org/10.1126/science.1160809 - DOI - PMC - PubMed
    1. Delbeke D, Coleman RE, Guiberteau MJ, Brown ML, Royal HD, Siegel BA, Townsend DW, Berland LL, Parker JA, Hubner K, et al.. Procedure guideline for tumor imaging with 18F-FDG PET/CT 1.0. J Nucl Med 2006; 47:885-95; PMID:16644760 - PubMed
    1. Denko NC. Hypoxia, HIF1 and glucose metabolism in the solid tumour. Nat Rev Cancer 2008; 8:705-713; PMID:19143055; http://dx.doi.org/10.1038/nrc2468 - DOI - PubMed
    1. Spugnini EP, Sonveaux P, Stock C, Perez-Sayans M, De Milito A, Avnet S, Garcìa AG, Harguindey S, Fais S. Proton channels and exchangers in cancer. Biochim Biophys Acta 2015; 1848:2715-26; PMID:25449995; http://dx.doi.org/10.1016/j.bbamem.2014.10.015 - DOI - PubMed

Publication types

MeSH terms

LinkOut - more resources