Review
. 2016 Jun 7:5:26.
doi: 10.1186/s13742-016-0132-7.

Recommendations on e-infrastructures for next-generation sequencing

Affiliations
Review

Recommendations on e-infrastructures for next-generation sequencing

Ola Spjuth et al. Gigascience. .

Abstract

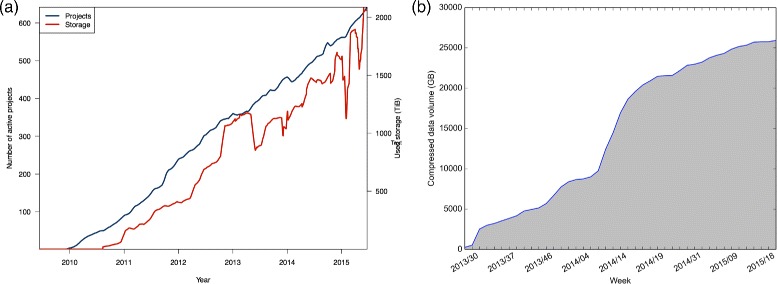
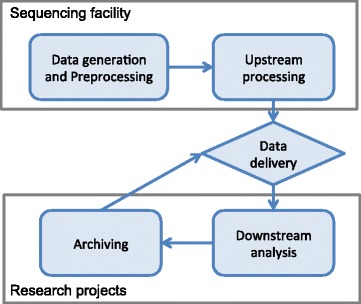
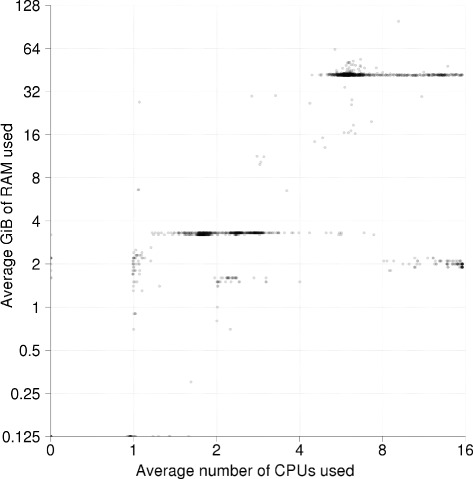
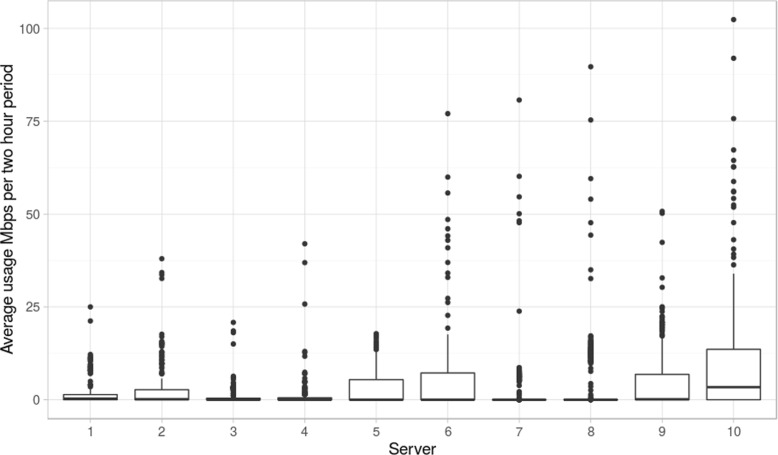
With ever-increasing amounts of data being produced by next-generation sequencing (NGS) experiments, the requirements placed on supporting e-infrastructures have grown. In this work, we provide recommendations based on the collective experiences from participants in the EU COST Action SeqAhead for the tasks of data preprocessing, upstream processing, data delivery, and downstream analysis, as well as long-term storage and archiving. We cover demands on computational and storage resources, networks, software stacks, automation of analysis, education, and also discuss emerging trends in the field. E-infrastructures for NGS require substantial effort to set up and maintain over time, and with sequencing technologies and best practices for data analysis evolving rapidly it is important to prioritize both processing capacity and e-infrastructure flexibility when making strategic decisions to support the data analysis demands of tomorrow. Due to increasingly demanding technical requirements we recommend that e-infrastructure development and maintenance be handled by a professional service unit, be it internal or external to the organization, and emphasis should be placed on collaboration between researchers and IT professionals.

Keywords: Cloud computing; E-infrastructure; High-performance computing; Next-generation sequencing.


Figures

Fig. 1
Fig. 1
Active projects and used storage by bioinformatics projects. a UPPMAX HPC center in Sweden; b storage space dedicated to compressed sequencing data at CRS4. UPPMAX started logging storage utilization in 2011. We observe that the storage demand increases with the number of active projects. The irregularities in storage use are due to: at the end of 2012 a new storage system was installed, resulting in temporary data duplication as the systems were synchronized; at the beginning of 2015, the two sharp dips are due to problems with data collection. The storage usage plot from CRS4 has data ranging from mid-2013 to the first quarter of 2015. The plot only includes the space dedicated to storing compressed raw sequence data (fastq files; no raw data or aligned sequences), but still illustrates the upward trend in storage requirements
Fig. 2
Fig. 2
Overview of the different data analysis stages in a typical next-generation sequencing project with different requirements for e-infrastructures. Data is generated at the sequencing facility where it is preprocessed and commonly subjected to upstream processing that can be automated (such as alignment and variant calling). Data is then delivered to research projects for downstream analysis and archiving on project completion. Archived data can then be brought back as a new delivery when needed
Fig. 3
Fig. 3
Average resource usage for the human whole genome sequencing pipeline at the National Genomics Infrastructure at SciLifeLab during the 6 month period May to October 2015. The pipeline consists of the GATK best practice variant calling workflow [33, 34] plus a number of quality control jobs. Each point in the figure is a job and the axes show the average number of CPUs and GiB RAM used by the corresponding job. The graph illustrates how this standard high-throughput production pipeline has a very clear resource usage pattern that does not achieve full CPU utilization on the 16 core nodes it runs on
Fig. 4
Fig. 4
Average network usage for servers connected to sequencers. Average network usage (across a 2 hour window) measured during a 1 month period for ten servers with ten Illumina sequencers attached (one MiSeq, four HiSeq 2500, five HiSeqX) at the SNP&SEQ Technology platform. This data includes all traffic to and from the server, including writes from the sequencer and synchronization of data to other internal and external systems

References

    1. Wheeler DA, Srinivasan M, Egholm M, Shen Y, Chen L, McGuire A, He W, Chen YJ, Makhijani V, Roth GT, Gomes X, Tartaro K, Niazi F, Turcotte CL, Irzyk GP, Lupski JR, Chinault C, Song X-Z, Liu Y, Yuan Y, Nazareth L, Qin X, Muzny DM, Margulies M, Weinstock GM, Gibbs RA, Rothberg JM. The complete genome of an individual by massively parallel DNA sequencing. Nature. 2008;452(7189):872–6. doi: 10.1038/nature06884. - DOI - PubMed
    1. Metzker ML. Sequencing technologies – the next generation. Nat Rev Genet. 2010;11(1):31–46. doi: 10.1038/nrg2626. - DOI - PubMed
    1. Yang Y, Muzny DM, Reid JG, Bainbridge MN, Willis A, Ward PA, Braxton A, Beuten J, Xia F, Niu Z, Hardison M, Person R, Bekheirnia MR, Leduc MS, Kirby A, Pham P, Scull J, Wang M, Ding Y, Plon SE, Lupski JR, Beaudet AL, Gibbs RA, Eng CM. Clinical whole-exome sequencing for the diagnosis of mendelian disorders. N Engl J Med. 2013;369(16):1502–11. doi: 10.1056/NEJMoa1306555. - DOI - PMC - PubMed
    1. Lampa S, Dahlö M, Olason PI, Hagberg J, Spjuth O. Lessons learned from implementing a national infrastructure in sweden for storage and analysis of next-generation sequencing data. Gigascience. 2013;2(1):9. doi: 10.1186/2047-217X-2-9. - DOI - PMC - PubMed
    1. Baker M. Next-generation sequencing: adjusting to data overload. Nat Methods. 2010;7(7):495–9. doi: 10.1038/nmeth0710-495. - DOI

Publication types