

Transcriptomic comparison of Drosophila snRNP biogenesis mutants reveals mutant-specific changes in pre-mRNA processing: implications for spinal muscular atrophy
- PMID: 27268418
- PMCID: PMC4931114
- DOI: 10.1261/rna.057208.116
Transcriptomic comparison of Drosophila snRNP biogenesis mutants reveals mutant-specific changes in pre-mRNA processing: implications for spinal muscular atrophy
Abstract
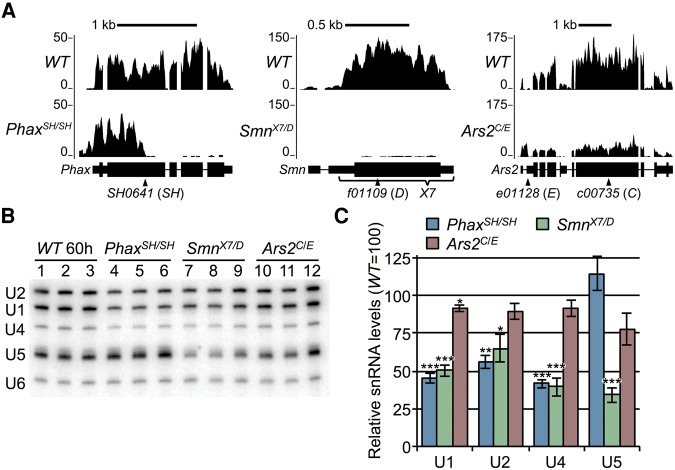
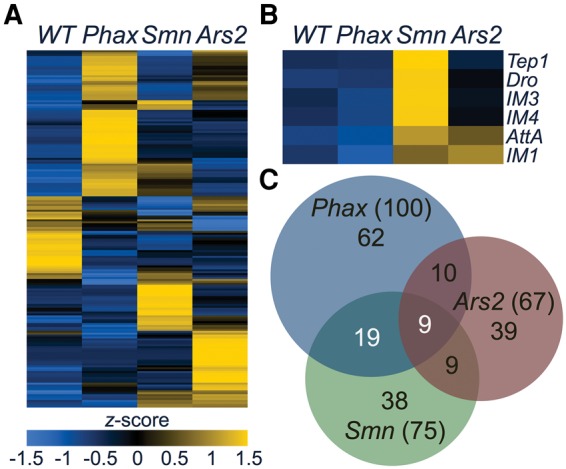
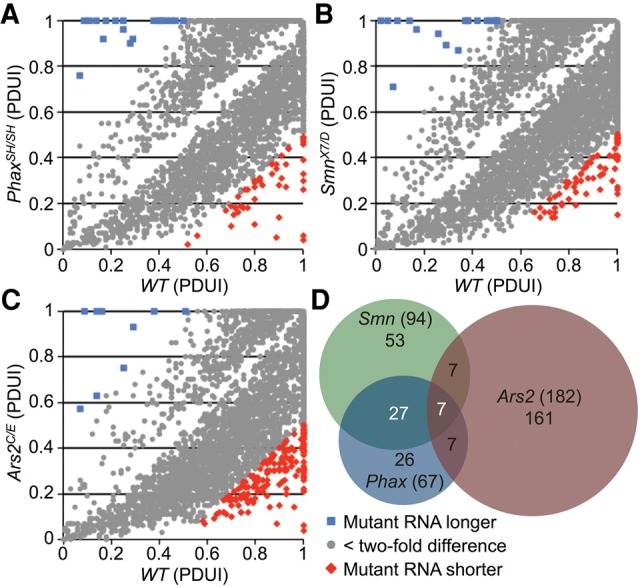
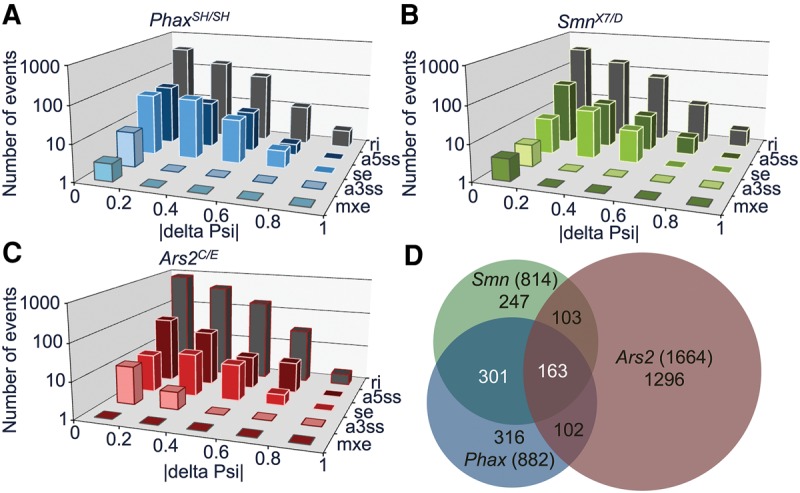
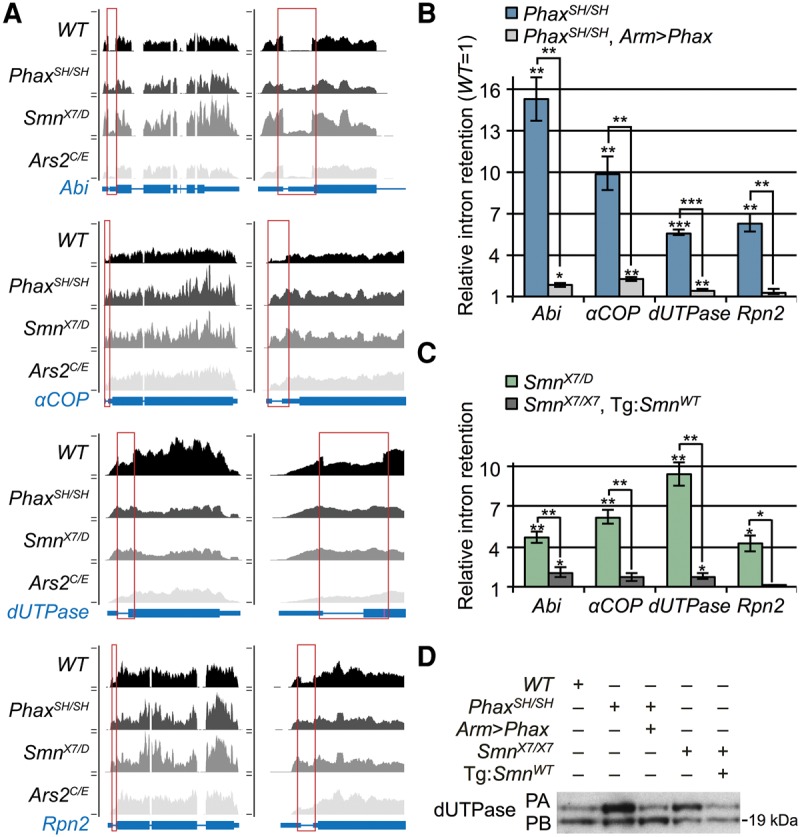
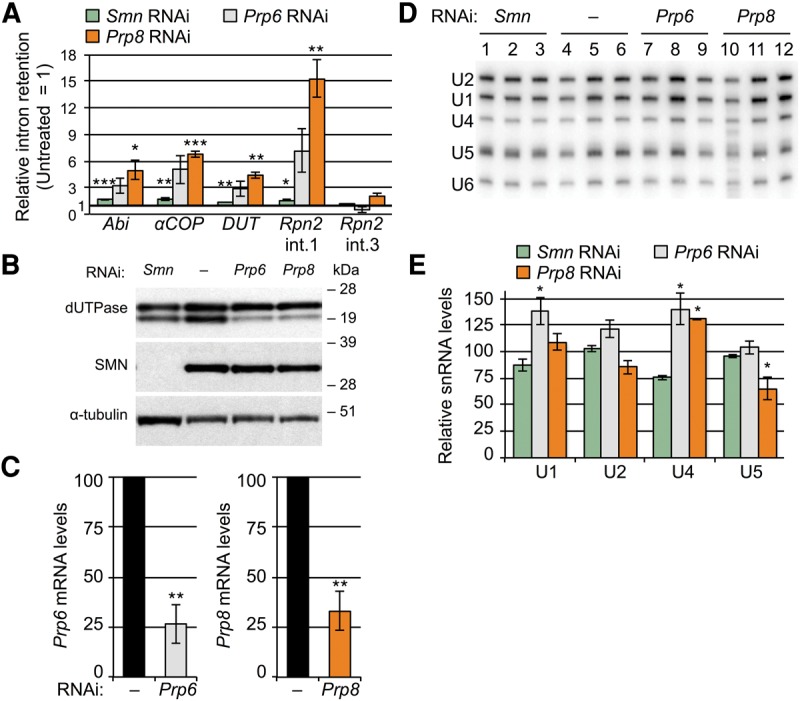
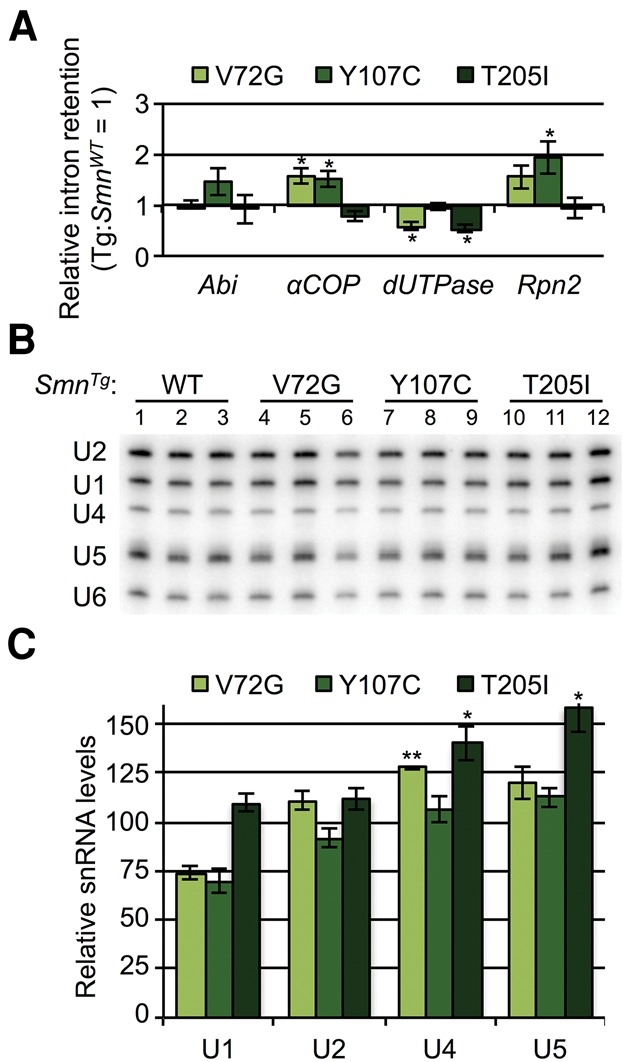
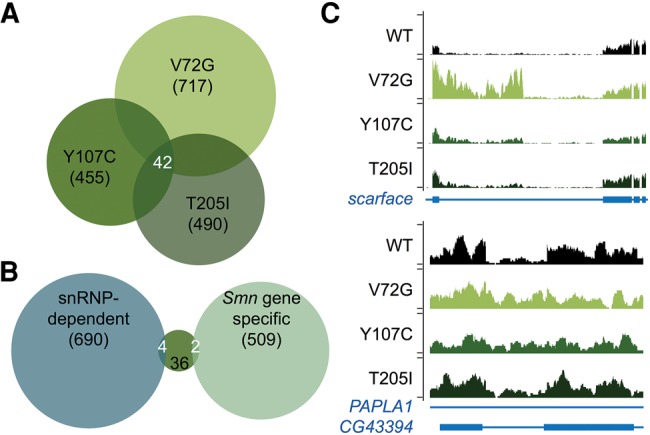
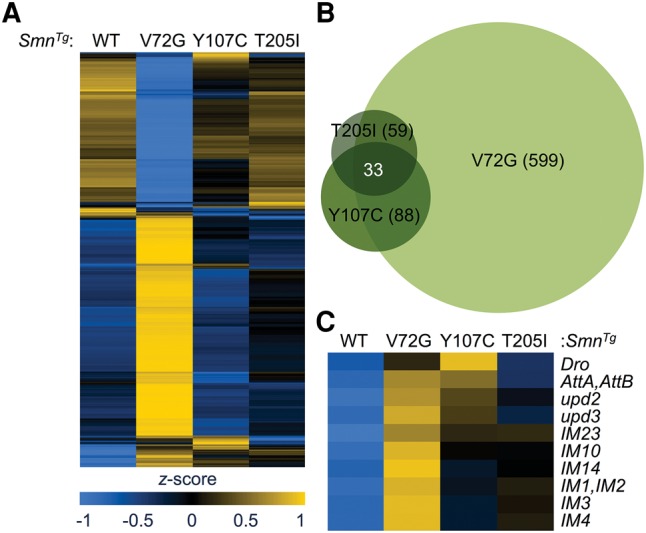
Survival motor neuron (SMN) functions in the assembly of spliceosomal small nuclear ribonucleoproteins (snRNPs) that catalyze pre-mRNA splicing. Here, we used disruptions in Smn and two additional snRNP biogenesis genes, Phax and Ars2, to classify RNA processing differences as snRNP-dependent or gene-specific in Drosophila Phax and Smn mutants exhibited comparable reductions in snRNAs, and comparison of their transcriptomes uncovered shared sets of RNA processing changes. In contrast, Ars2 mutants displayed only small decreases in snRNA levels, and RNA processing changes in these mutants were generally distinct from those identified in Phax and Smn animals. Instead, RNA processing changes in Ars2 mutants support the known interaction of Ars2 protein with the cap-binding complex, as splicing changes showed a clear bias toward the first intron. Bypassing disruptions in snRNP biogenesis, direct knockdown of spliceosomal proteins caused similar changes in the splicing of snRNP-dependent events. However, these snRNP-dependent events were largely unaltered in three Smn mutants expressing missense mutations that were originally identified in human spinal muscular atrophy (SMA) patients. Hence, findings here clarify the contributions of Phax, Smn, and Ars2 to snRNP biogenesis in Drosophila, and loss-of-function mutants for these proteins reveal differences that help disentangle cause and effect in SMA model flies.
Keywords: Abelson interacting protein; Ars2; GARS; PHAX; Prp6; Prp8; RNA-sequencing; SMA; SMN; alternative polyadenylation; alternative splicing; dUTPase; phosphorylated adaptor for RNA export; snRNA; snRNP biogenesis; spinal muscular atrophy; survival motor neuron; αCOP.
© 2016 Garcia et al.; Published by Cold Spring Harbor Laboratory Press for the RNA Society.
Figures
Similar articles
-
Developmental arrest of Drosophila survival motor neuron (Smn) mutants accounts for differences in expression of minor intron-containing genes.RNA. 2013 Nov;19(11):1510-6. doi: 10.1261/rna.038919.113. Epub 2013 Sep 4. RNA. 2013. PMID: 24006466 Free PMC article.
-
A novel function for SMN, the spinal muscular atrophy disease gene product, in pre-mRNA splicing.Cell. 1998 Nov 25;95(5):615-24. doi: 10.1016/s0092-8674(00)81632-3. Cell. 1998. PMID: 9845364
-
SMN mutants of spinal muscular atrophy patients are defective in binding to snRNP proteins.Proc Natl Acad Sci U S A. 1999 Sep 28;96(20):11167-72. doi: 10.1073/pnas.96.20.11167. Proc Natl Acad Sci U S A. 1999. PMID: 10500148 Free PMC article.
-
SMN in spinal muscular atrophy and snRNP biogenesis.Wiley Interdiscip Rev RNA. 2011 Jul-Aug;2(4):546-64. doi: 10.1002/wrna.76. Epub 2011 Feb 17. Wiley Interdiscip Rev RNA. 2011. PMID: 21957043 Review.
-
Small nuclear RNAs and mRNAs: linking RNA processing and transport to spinal muscular atrophy.Biochem Soc Trans. 2013 Aug;41(4):871-5. doi: 10.1042/BST20120016. Biochem Soc Trans. 2013. PMID: 23863147 Review.
Cited by
-
Defective Expression of Mitochondrial, Vacuolar H+-ATPase and Histone Genes in a C. elegans Model of SMA.Front Genet. 2019 May 3;10:410. doi: 10.3389/fgene.2019.00410. eCollection 2019. Front Genet. 2019. PMID: 31130987 Free PMC article.
-
Comprehensive Modeling of Spinal Muscular Atrophy in Drosophila melanogaster.Front Mol Neurosci. 2019 May 16;12:113. doi: 10.3389/fnmol.2019.00113. eCollection 2019. Front Mol Neurosci. 2019. PMID: 31156382 Free PMC article.
-
Ovule identity mediated by pre-mRNA processing in Arabidopsis.PLoS Genet. 2018 Jan 12;14(1):e1007182. doi: 10.1371/journal.pgen.1007182. eCollection 2018 Jan. PLoS Genet. 2018. PMID: 29329291 Free PMC article.
-
Self-oligomerization regulates stability of survival motor neuron protein isoforms by sequestering an SCFSlmb degron.Mol Biol Cell. 2018 Jan 15;29(2):96-110. doi: 10.1091/mbc.E17-11-0627. Epub 2017 Nov 22. Mol Biol Cell. 2018. PMID: 29167380 Free PMC article.
-
SMN deficiency in severe models of spinal muscular atrophy causes widespread intron retention and DNA damage.Proc Natl Acad Sci U S A. 2017 Mar 21;114(12):E2347-E2356. doi: 10.1073/pnas.1613181114. Epub 2017 Mar 7. Proc Natl Acad Sci U S A. 2017. PMID: 28270613 Free PMC article.
References
-
- Aghamaleky Sarvestany A, Hunter G, Tavendale A, Lamont DJ, Llavero Hurtado M, Graham LC, Wishart TM, Gillingwater TH. 2014. Label-free quantitative proteomic profiling identifies disruption of ubiquitin homeostasis as a key driver of Schwann cell defects in spinal muscular atrophy. J Proteome Res 13: 4546–4557. - PubMed
-
- Baillat D, Hakimi MA, Naar AM, Shilatifard A, Cooch N, Shiekhattar R. 2005. Integrator, a multiprotein mediator of small nuclear RNA processing, associates with the C-terminal repeat of RNA polymerase II. Cell 123: 265–276. - PubMed
Publication types
MeSH terms
Substances
Grants and funding
LinkOut - more resources
Full Text Sources
Other Literature Sources
Medical
Molecular Biology Databases
Miscellaneous