. 2016 Jun;28(6):1422-39.
doi: 10.1105/tpc.16.00078. Epub 2016 Jun 7.

CASEIN KINASE1-LIKE PROTEIN2 Regulates Actin Filament Stability and Stomatal Closure via Phosphorylation of Actin Depolymerizing Factor

Affiliations

CASEIN KINASE1-LIKE PROTEIN2 Regulates Actin Filament Stability and Stomatal Closure via Phosphorylation of Actin Depolymerizing Factor

Shuangshuang Zhao et al. Plant Cell. 2016 Jun.

Abstract

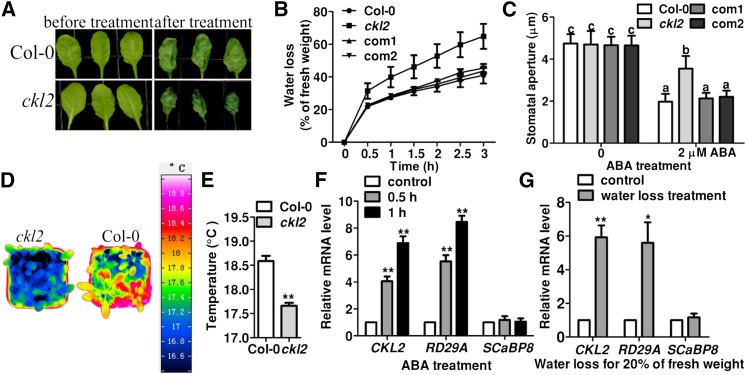
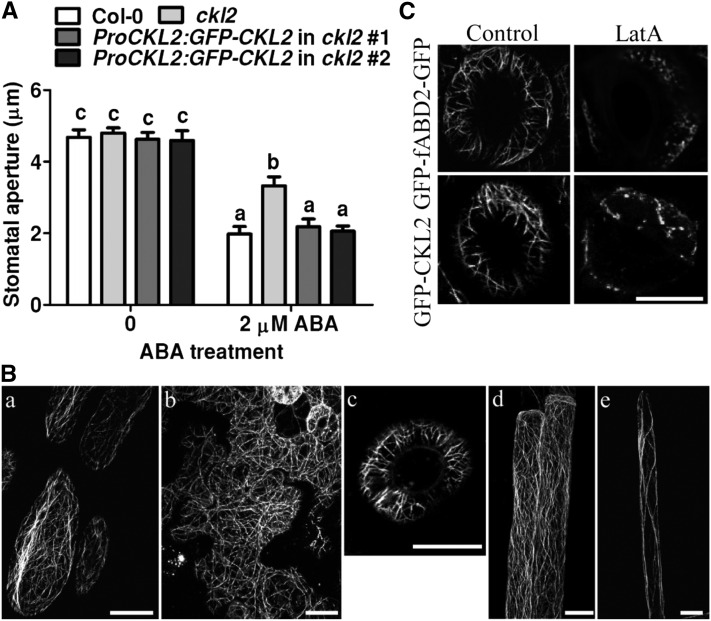
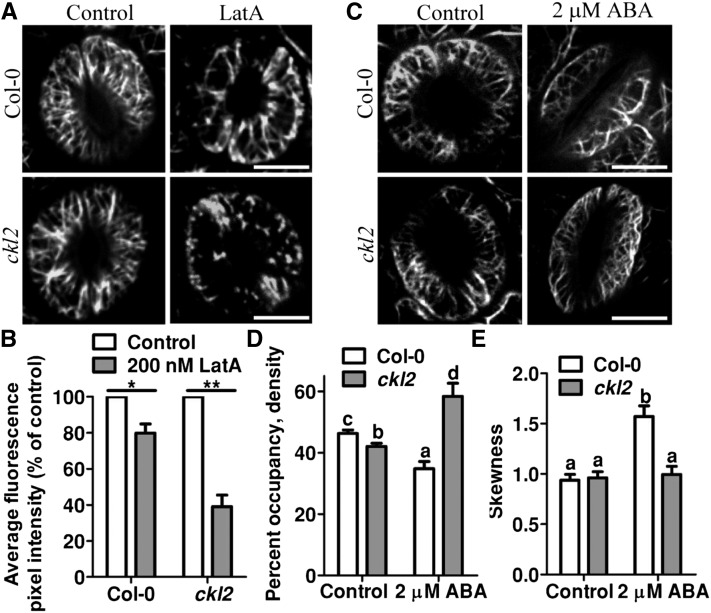
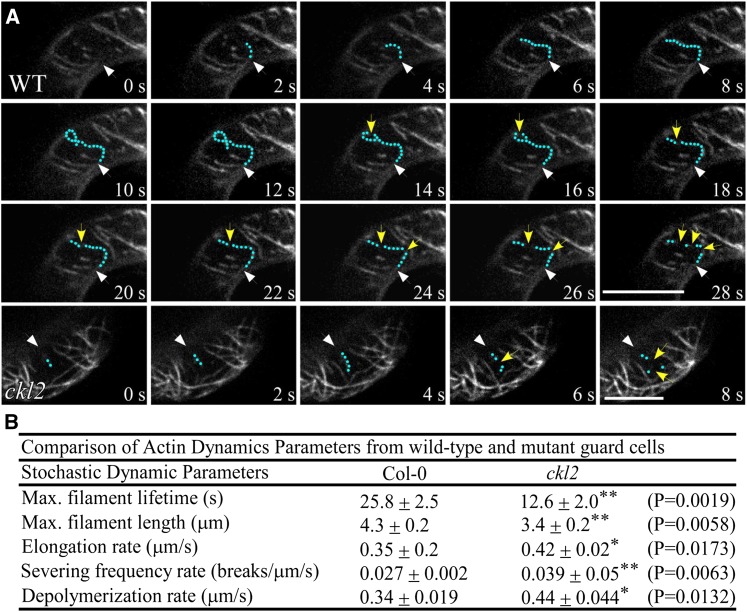
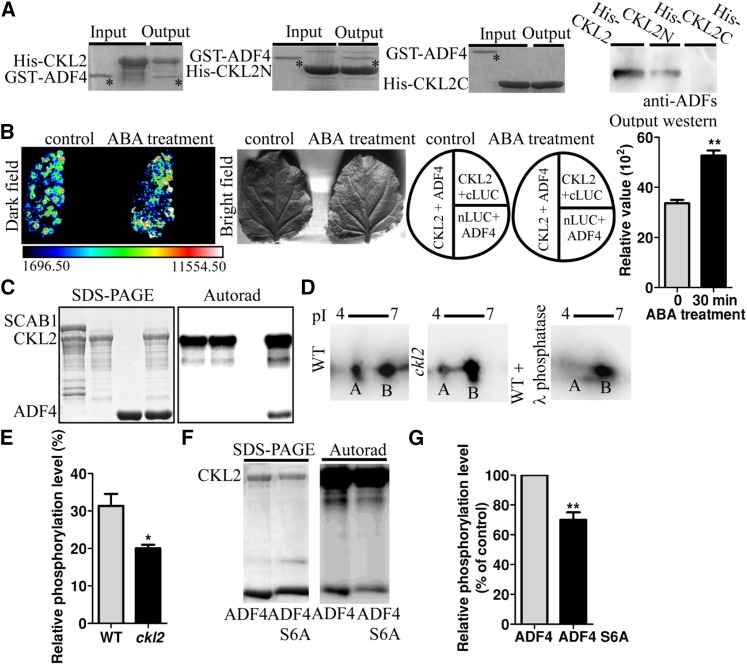
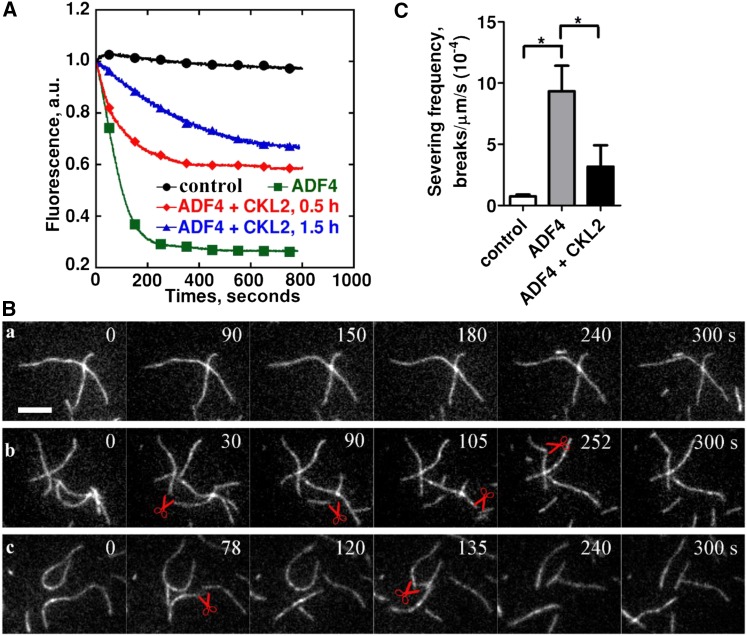
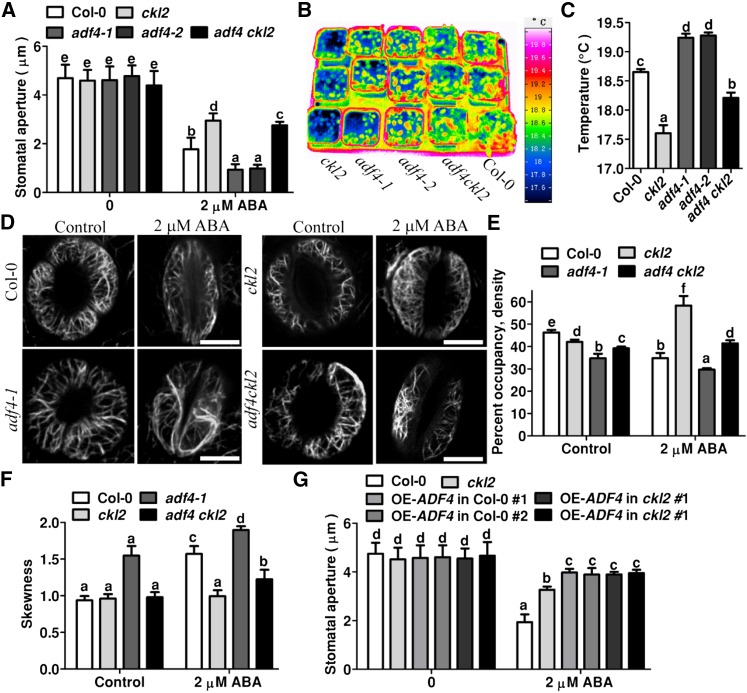
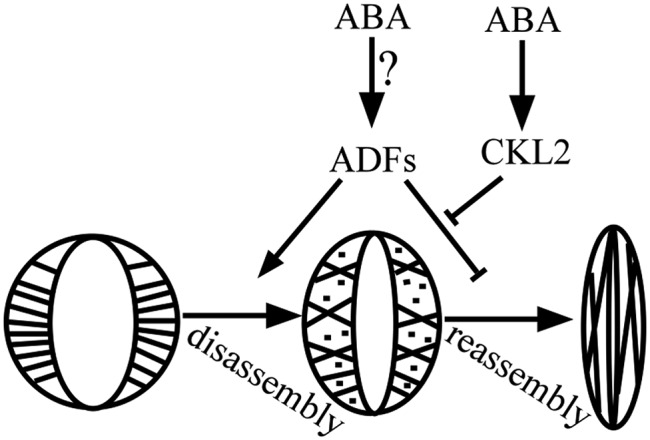
The opening and closing of stomata are crucial for plant photosynthesis and transpiration. Actin filaments undergo dynamic reorganization during stomatal closure, but the underlying mechanism for this cytoskeletal reorganization remains largely unclear. In this study, we identified and characterized Arabidopsis thaliana casein kinase 1-like protein 2 (CKL2), which responds to abscisic acid (ABA) treatment and participates in ABA- and drought-induced stomatal closure. Although CKL2 does not bind to actin filaments directly and has no effect on actin assembly in vitro, it colocalizes with and stabilizes actin filaments in guard cells. Further investigation revealed that CKL2 physically interacts with and phosphorylates actin depolymerizing factor 4 (ADF4) and inhibits its activity in actin filament disassembly. During ABA-induced stomatal closure, deletion of CKL2 in Arabidopsis alters actin reorganization in stomata and renders stomatal closure less sensitive to ABA, whereas deletion of ADF4 impairs the disassembly of actin filaments and causes stomatal closure to be more sensitive to ABA Deletion of ADF4 in the ckl2 mutant partially recues its ABA-insensitive stomatal closure phenotype. Moreover, Arabidopsis ADFs from subclass I are targets of CKL2 in vitro. Thus, our results suggest that CKL2 regulates actin filament reorganization and stomatal closure mainly through phosphorylation of ADF.


Figures

Figure 1.
Figure 1.
The ckl2 Mutant Shows Impaired Stomatal Closure. (A) Leaves detached from wild-type and ckl2 plants for 0 (left) and 3 h (right) of water loss treatment. (B) Cumulative leaf transpirational water loss in Col-0, ckl2, and two rescued lines (com1 and com2) at the indicated times after detachment (means ± sd, n = 3). (C) Stomatal bioassays for ABA-induced closure in Col-0, ckl2, and two rescued lines (com1 and com2). The data represent the means ± sd of three independent experiments; 50 stomata were analyzed per line. The data sets were tested as normal distribution by the Shapiro-Wilk test. Statistical significance was determined by Student’s t test; significant differences are indicated by different lowercase letters. The t test analysis of the data indicates the levels of significance to be P = 0.0034, 0.9986, and 0.9347 for ckl2 and the two rescued lines, respectively, compared with Col-0 after ABA treatment. Before ABA treatment, the levels of significance were P = 0.8075, 0.2705, and 0.6197 for ckl2 and the two rescued lines, respectively, compared with Col-0. (D) Representative pseudocolored infrared images of leaf temperature of Col-0 and ckl2 mutant plants. (E) Leaf (surface) temperature of Col-0 and ckl2 mutant plants measured from images obtained by infrared thermography, as in (D), and analyzed by InfraTec reporter software. Twenty leaves were analyzed per line. Data are means ± sd (n = 3). The data sets were tested for normal distribution by Shapiro-Wilk test. Statistical significance (**P < 0.01) was determined by Student’s t test. (F) and (G) Real-time PCR analysis revealed the induced expression of CKL2 by ABA treatment or water loss treatment. Seven-day-old seedlings were treated with 20 μM ABA for 0.5 or 1 h (F) or were treated for water loss until leaves had lost 20% of their fresh weight (G). RD29A and SCaBP8 were used as controls. Expression levels of CKL2, RD29A, and SCaBP8 without ABA/water loss treatment were set as 1.0, respectively. The experiments were repeated three times. Data are means ± sd. Statistical significance (**P < 0.01 and *P < 0.05) was determined by Student’s t test. t test analysis of the data shown in (F) indicates the level of significance to be P = 0.0042 and 0.0023 for the data of CKL2 relative mRNA level at 0.5 and 1 h after ABA treatment, respectively, compared with the control. The positive control RD29A also had a higher relative mRNA level when treated with ABA for 0.5 h (P = 0.0033) and 1 h (P = 0.0012) compared with the control. The negative control SCaBP8 showed no obvious difference when treated with ABA for 0.5 h (P = 0.6890) and 1 h (0.7891) compared with the control. As shown in (G), CKL2 was induced by water loss treatment (P = 0.0066). The positive control RD29A also had a higher relative mRNA level when treated with water loss until seedlings lost 20% of their fresh weight (P = 0.0225). As a negative control, the relative mRNA level of SCaBP8 was not significantly different when treated with water loss until seedlings lost 20% of their fresh weight (P = 0.5851) compared with the control.
Figure 2.
Figure 2.
Localization of GFP-CKL2 Expressed from the Native CKL2 Promoter. (A) Stomatal bioassays for ABA-induced closure in Col-0, ckl2, and two ProCKL2:GFP-CKL2 transgenic lines. The data represent the means ± sd of three independent experiments; 50 stomata were analyzed per line. The data sets were tested for normal distribution by the Shapiro-Wilk test. Statistical significance was determined by Student’s t test; significant differences are indicated by different lowercase letters. The t test analysis of the data indicated the levels of significance to be P = 0.0024, 0.8673, and 0.8358 for ckl2 and two rescued lines data, respectively, compared with Col-0 after ABA treatment. Before ABA treatment, the levels of significance were P = 0.9023, 0.3251, and 0.6601 for ckl2 and two rescued lines, respectively, compared with Col-0. (B) Confocal images were taken of epidermal cells of hypocotyls (A), leaves (B), guard cells (C), roots (D), and root hairs (E) of ProCKL2:GFP-CKL2 transgenic seedlings in the Col-0 background. Bars = 10 μm. (C) GFP-CKL2 driven by the CKL2 native promoter and GFP-fABD2-GFP transgenic seedlings were treated with 200 nM LatA for 0.5 h. Confocal images were taken of guard cells. Bars = 10 μm.
Figure 3.
Figure 3.
CKL2 Stabilizes Actin Filaments in Guard Cells. (A) Actin filament organization in guard cells of Col-0 and ckl2 35Sp:GFP-fABD2-GFP transgenic plants before (right) and after (left) 200 nM LatA treatment for 30 min. (B) Quantification of the relative average fluorescence pixel density of GFP-fABD2 signal in guard cells as shown in (A). After LatA treatment, Col-0 and ckl2 mutant had lower relative average fluorescence pixel density of GFP-fABD2 signal compared with control (P = 0.0204, 0.0037). (C) Actin filament organization in guard cells of Col-0 and ckl2 35Sp:GFP-fABD2-GFP transgenic plants before (right) and after (left) 2 μM ABA treatment for 0.5 h. (D) The extent of filament bundling (skewness) of guard cells shown in (C). The ckl2 mutant had significantly increased average actin filament density compared with Col-0 after ABA treatment (P = 0.0029). The ckl2 mutant had significantly decreased average actin filament density than Col-0 before ABA treatment (P = 0.0056). (E) Average filament density of Col-0 and ckl2 guard cells before and after 2 μM ABA treatment as shown in (C). ckl2 mutant had significantly decreased average actin filament skewness values compared with Col-0 after ABA treatment (P = 0.0068). No significant difference of average actin filament skewness values between Col-0 and ckl2 mutant was observed before ABA treatment (P = 0.0993). Values of (B), (D), and (E) represent the means ± sd of three independent experiments; 50 stomata were analyzed per line. The data sets were tested for normal distribution by the Shapiro-Wilk test. Statistical significance was determined by Student’s t test. Significant differences are denoted with asterisks (**P < 0.01 and *P < 0.05) in (B). Significant differences (P < 0.01) are indicated by different lowercase letters in (D) and (E).
Figure 4.
Figure 4.
The ckl2 Mutant Shows Different Actin Dynamics from the Wild Type. (A) Time-lapse images of single actin filaments in guard cells of Col-0 and ckl2 35Sp:GFP-fABD2-GFP transgenic plants. Green dots highlight a representative single actin filament. Yellow arrows indicate actin filament-severing events. White arrows indicate the position at which growth of the single actin filament began. Bars = 5 μm. (B) Actin filament dynamic parameters in Col-0 and ckl2. The parameters associated with single actin filament dynamics in Col-0 and ckl2 guard cells were quantified from spinning disk confocal micrographs. Values represent means ± sd, n = 30. The data sets were tested for normal distribution by the Shapiro-Wilk test. Statistical significance was determined by Student’s t test. Quantification of *P < 0.05 and **P < 0.01.
Figure 5.
Figure 5.
CKL2 Interacts with and Phosphorylates ADF4. (A) CKL2 interacts with ADF4 in pull-down assays. Equal amounts of affinity-purified His-CKL2 (left first panel), His-CKL2N (second panel), or His-CKL2C fusion protein (third panel) were incubated with GST-ADF4. The input and output proteins were stained with Coomassie blue on a SDS-PAGE gel. The output proteins were also subject to immunoblot assay with anti-ADF antibodies (right panel). The asterisks indicate the GST-ADF4 bands. (B) Split-luciferase complementation imaging assays in N. benthamiana. Quantitative analysis of luminescence intensity was determined. Relative values are mean ± sd, n = 3. Higher luminescence intensity was observed after ABA treatment compared with control (denoted by asterisk, P = 0.0022, t test). (C) CKL2 phosphorylates ADF4 in vitro. The input proteins His-CKL2 and His-ADF4 were detected by Coomassie blue staining (left). Phosphorylation activity was detected by [γ-32P]ATP autoradiography (right). (D) Two-dimensional immunoblotting. The Flag-ADF4 protein was immunoprecipitated with anti-Flag agarose from Col-0 or ckl2 mutant plants. Equal amounts of Flag-ADF4 protein immunoprecipitated from Col-0 were treated with λ phosphatase as a control. Anti-Flag antibody was used for immunoblot assays. Arrowheads point to the location of the more acidic ADF4 spot, representing phosphorylated ADF4. Experiments were repeated three times. (E) Quantification of relative ADF4 phosphorylation level in (D). Values represent mean ± sd, n = 3. Statistical significance was determined by Student’s t test; significant differences (P < 0.05) are indicated with asterisks. The ckl2 mutant had a lower relative ADF4 phosphorylation level compared with control (P = 0.0258). (F) ADF4 Ser-6 is important for the phosphorylation of CKL2. Purified His-ADF4 and His-ADF4S6A as substrates were phosphorylated in the in vitro kinase assays. (G) Quantification of relative ADF4 phosphorylation level in (F). Values represent mean ± sd, n = 3. The data sets were tested for normal distribution by the Shapiro-Wilk test. Statistical significance was determined by Student’s t test; significant differences (P < 0.01) are indicated with asterisks. ADF4 Ser-6 mutation led to a lower relative phosphorylation level compared with the wild type (P = 0.0091).
Figure 6.
Figure 6.
Phosphorylation of ADF4 by CKL2 Affects ADF4 Activity. (A) The effect of ADF4 on F-actin disassembly was determined by a pyrene-actin assay. ADF4, after being phosphorylated by CKL2, was able to depolymerize actin filaments but was less potent than nonphosphorylated ADF4. Preassembled actin filaments (from 2 µM G-actin, 10% pyrene-labeled) were incubated with 250 nM ADF4 or 250 nM CKL2-phosphorylated ADF4 to induce actin disassembly at pH 7.0. Black closed circles, 0.5 µM F-actin; green closed squares, 0.5 µM F-actin + 4 µM ADF4; red closed diamonds, 0.5 µM F-actin + 4 µM ADF4 after phosphorylation by CKL2 for 0.5 h; blue closed triangles, 0.5 µM F-actin + 4 µM ADF4 after phosphorylation by CKL2 for 1.5 h. a.u., arbitrary units. (B) Time-lapse TIRF microscopy analysis of actin filament severing by ADF4 after being phosphorylated by CKL2. Time-lapse images were recorded at 3-s intervals with TIRF microscopy. Actin filaments (from 1 µM G-actin, 50% Oregon-green labeled) were monitored for 300 s without ADF4 (A), in the presence of 500 nM nonphosphorylated ADF4 (B) or 500 nM CKL2-phosphorylated ADF4 (C). The red pairs of scissors indicate severing events. See Supplemental Movie 3 for the entire series. (C) Quantification of ADF4-mediated actin-filament-severing frequency. Averages for each condition are from at least 30 individual filaments obtained from three independent trials. Error bars represent means ± sd (n = 3). Statistical significance (*P < 0.5) was determined by Student’s t test. The t test analysis of the data indicated the level of significance to be P = 0.0186 and 0.1380 for ADF4 and ADF4 + CKL2 data relative to the control data, respectively. The level of significance between ADF4 and ADF4 + CKL2 data was P = 0.0219.
Figure 7.
Figure 7.
ADF4 Is Required for CKL2-Mediated Stomatal Closure. (A) Stomatal bioassays for ABA-induced closure in Col-0, ckl2, adf4-1, adf4-2, and adf4 ckl2 plants. The data represent the means ± sd of three independent experiments; at least 50 stomata were analyzed per genetic background. The data sets were tested for normal distribution by the Shapiro-Wilk test. Statistical significance was determined by Student’s t test; significant differences (P < 0.01) are indicated by different lowercase letters. The ckl2 mutants had wider stomatal apertures than Col-0 (P = 0.0052). Both adf4-1 and adf4-2 mutants had smaller stomatal apertures than Col-0 (P = 0.0017 and P = 0.0043). The adf4 ckl2 mutants had smaller apertures than the ckl2 mutants (P = 0.0019) and wider apertures than Col-0 (P = 0.0012). Before ABA treatment, there were no significant differences in the data for ckl2, adf4-1, adf4-2, and adf4 ckl2 compared with Col-0 (P = 0.8216, 0.4420, 0.5870, and 0.2290, respectively). (B) Representative pseudocolored infrared images of leaf temperature of Col-0, ckl2, adf4-1, adf4-2, and adf4 ckl2 plants were obtained by infrared thermography. (C) Leaf (surface) temperatures of Col-0, ckl2, adf4-1, adf4-2, and adf4 ckl2 plants were analyzed by InfraTec reporter software from images in (B). Twenty leaves were analyzed per line. Data are means ± sd (n = 3). The data sets were tested for normal distribution by the Shapiro-Wilk test. Statistical significance was determined by Student’s t test; significant differences (P < 0.01) are indicated by different lowercase letters. The ckl2 mutant had lower leaf temperatures than Col-0 (P = 0.0053). Both adf4-1 and adf4-2 had higher leaf temperatures than Col-0 (P = 0.0012 and P = 0.0091). adf4 ckl2 had higher leaf temperatures than ckl2 (P = 0.0036) and lower leaf temperatures than Col-0 (P = 0.0065). (D) Actin filament organization in guard cells from Col-0, ckl2, adf4-1, adf4-2, and adf4 ckl2 transgenic plants harboring 35Sp:GFP-fABD2-GFP before and after 2 μM ABA treatment for 0.5 h. (E) Quantitative analysis of actin filament density in guard cells as shown in (D). Before ABA treatment, the levels of significance were P = 0.0059, 0.0063, and 0.0052 for actin filament density in ckl2, adf4-1, and adf4 ckl2 mutants, respectively, relative to Col-0. After ABA treatment, the levels of significance were P = 0.0041, 0.0033, and 0.0045 for ckl2, adf4-1, and adf4 ckl2, respectively, relative to Col-0. (F) Bundling (skewness) quantitative analysis in guard cells shown in (D). Before ABA treatment, the levels of significance were P = 0.0845, 0.0048, and 0.137 for ckl2, adf4-1, and adf4 ckl2, respectively, relative to the Col-0 skewness value. After ABA treatment the levels of significance were P = 0.0072, 0.0013, and 0.0025 for ckl2, adf4-1, and adf4 ckl2, respectively, relative to Col-0. (G) Stomatal bioassays for ABA-induced closure in leaves of Col-0, ckl2, and plants overexpressing ADF4 in Col-0 and ckl2 mutant. Before ABA treatment, no significant differences were observed when comparing the stomatal apertures of ckl2 and plants overexpressing ADF4 in Col-0 and ckl2 mutant with Col-0, respectively (P = 0.66, 0.5830, 0.3932, 0.4523, and 0.6488). After ABA treatment, the levels of significance changed significantly (P = 0.0029, 0.0046, 0.0065, 0.0035, and 0.0073, respectively). Values of (E) to (G) represent the means ± sd of three independent experiments; 50 stomata were analyzed per line. The data sets were tested for normal distribution by Shapiro-Wilk test. Statistical significance was determined by Student’s t test; significant differences (P < 0.01) are indicated by different lowercase letters.
Figure 8.
Figure 8.
A Simplified Working Model for the Role of CKL2 and ADF4 in Regulating Actin Reorganization during ABA-Induced Stomatal Closure. During stomatal closure, microfilaments reorganize, first disassembling and then reassembling. ABA/drought-induced CKL2 represses ADF activity to stabilize microfilaments and keep stomata closed.

Comment in

Similar articles

Cited by

References

    1. Agnew B.J., Minamide L.S., Bamburg J.R. (1995). Reactivation of phosphorylated actin depolymerizing factor and identification of the regulatory site. J. Biol. Chem. 270: 17582–17587. - PubMed
    1. Akashi M., Tsuchiya Y., Yoshino T., Nishida E. (2002). Control of intracellular dynamics of mammalian period proteins by casein kinase I epsilon (CKIepsilon) and CKIdelta in cultured cells. Mol. Cell. Biol. 22: 1693–1703. - PMC - PubMed
    1. Allwood E.G., Anthony R.G., Smertenko A.P., Reichelt S., Drobak B.K., Doonan J.H., Weeds A.G., Hussey P.J. (2002). Regulation of the pollen-specific actin-depolymerizing factor LlADF1. Plant Cell 14: 2915–2927. - PMC - PubMed
    1. Allwood E.G., Smertenko A.P., Hussey P.J. (2001). Phosphorylation of plant actin-depolymerising factor by calmodulin-like domain protein kinase. FEBS Lett. 499: 97–100. - PubMed
    1. Amann K.J., Pollard T.D. (2001). Direct real-time observation of actin filament branching mediated by Arp2/3 complex using total internal reflection fluorescence microscopy. Proc. Natl. Acad. Sci. USA 98: 15009–15013. - PMC - PubMed

Publication types

MeSH terms

LinkOut - more resources