

Differences in incomes of physicians in the United States by race and sex: observational study
- PMID: 27268490
- PMCID: PMC4897176
- DOI: 10.1136/bmj.i2923
Differences in incomes of physicians in the United States by race and sex: observational study
Abstract
Objectives: To estimate differences in annual income of physicians in the United States by race and sex adjusted for characteristics of physicians and practices.
Design: Cross sectional survey study.
Setting: Nationally representative samples of US physicians.
Participants: The 2000-13 American Community Survey (ACS) included 43 213 white male, 1698 black male, 15 164 white female, and 1252 black female physicians. The 2000-08 Center for Studying Health System Change (HSC) physician surveys included 12 843 white male, 518 black male, 3880 white female, and 342 black female physicians.
Main outcome measures: Annual income adjusted for age, hours worked, time period, and state of residence (from ACS data). Income was adjusted for age, specialty, hours worked, time period, years in practice, practice type, and percentage of revenue from Medicare/Medicaid (from HSC physician surveys).
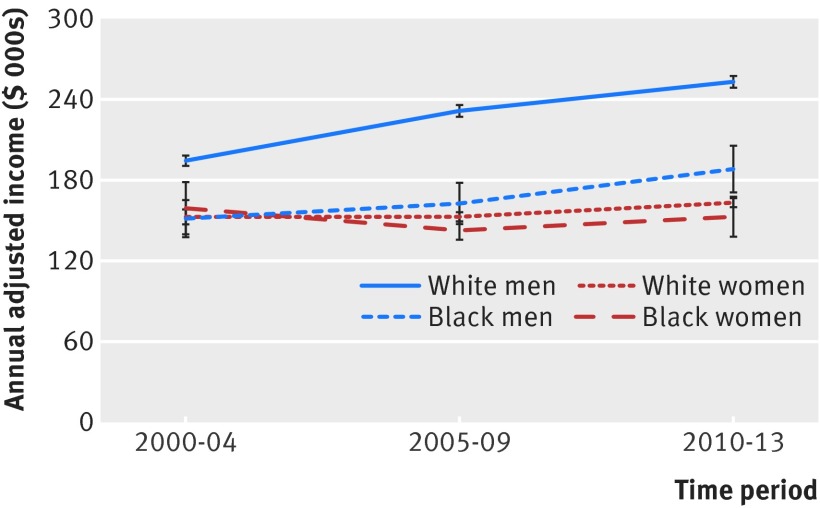
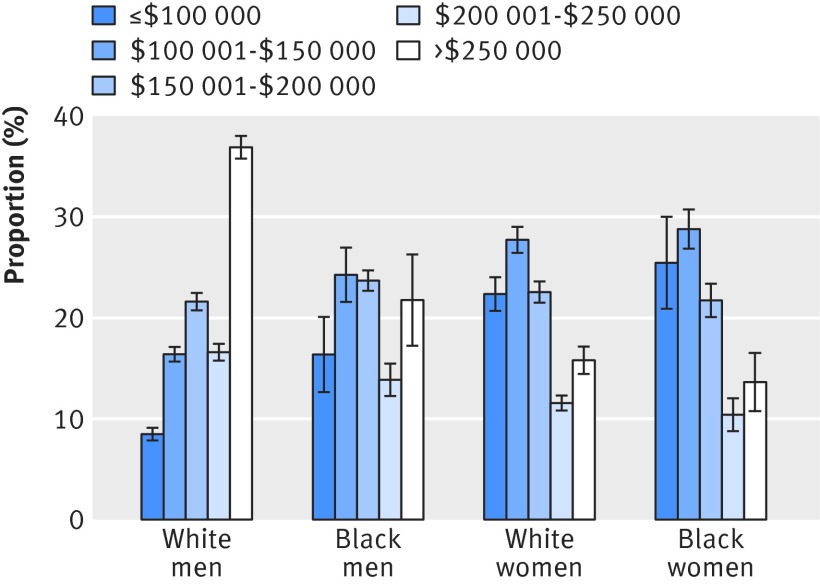
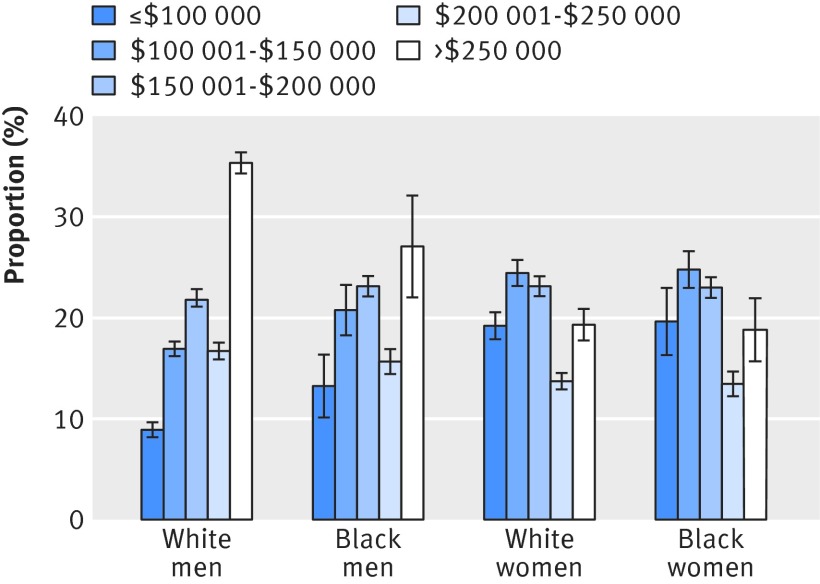
Results: White male physicians had a higher median annual income than black male physicians, whereas race was not consistently associated with median income among female physicians. For example, in 2010-13 in the ACS, white male physicians had an adjusted median annual income of $253 042 (95% confidence interval $248 670 to $257 413) compared with $188 230 ($170 844 to $205 616) for black male physicians (difference $64 812; P<0.001). White female physicians had an adjusted median annual income of $163 234 ($159 912 to 166 557) compared with $152 784 ($137 927 to $167 641) for black female physicians (difference $10 450; P=0.17). $100 000 is currently equivalent to about £69 000 (€89 000). Patterns were unaffected by adjustment for specialty and characteristics of practice in the HSC physician surveys.
Conclusions: White male physicians earn substantially more than black male physicians, after adjustment for characteristics of physicians and practices, while white and black female physicians earn similar incomes to each other, but significantly less than their male counterparts. Whether these differences reflect disparities in job opportunities is important to determine.
Published by the BMJ Publishing Group Limited. For permission to use (where not already granted under a licence) please go to http://group.bmj.com/group/rights-licensing/permissions.
Conflict of interest statement
Contributors: All authors contributed to the design and conduct of the study; data collection and management; analysis and interpretation of the data; and preparation, review, or approval of the manuscript. ABJ is guarantor.
Competing interests: All authors have completed the ICMJE uniform disclosure form at
Figures
References
-
- Canon M, Marifian E. Changes in the racial earnings gap since 1960. St. Louis Fed, 2013.
-
- Black DA, Kolesnikova NA, Taylor LJ. The Economic Progress of African Americans in Urban Areas: A Tale of 14 Cities. Federal Reserve Bank of St. Louis’ RE:view 2010;92:353-79.
-
- U.S. Census Bureau. U.S. Census Bureau. Income.Poverty, and Health Insurance Coverage in the United States, 2011.
-
- Lasser KE, Woolhandler S, Himmelstein DU. Sources of U.S. physician income: the contribution of government payments to the specialist-generalist income gap. J Gen Intern Med 2008;23:1477-81. 10.1007/s11606-008-0660-7 pmid:18592323. - DOI - PMC - PubMed
-
- Leigh JP, Tancredi D, Jerant A, Kravitz RL. Physician wages across specialties: informing the physician reimbursement debate. Arch Intern Med 2010;170:1728-34. 10.1001/archinternmed.2010.350 pmid:20975019. - DOI - PubMed
Publication types
MeSH terms
Grants and funding
LinkOut - more resources
Full Text Sources
Other Literature Sources