

Early Childhood Developmental Status in Low- and Middle-Income Countries: National, Regional, and Global Prevalence Estimates Using Predictive Modeling
- PMID: 27270467
- PMCID: PMC4896459
- DOI: 10.1371/journal.pmed.1002034
Early Childhood Developmental Status in Low- and Middle-Income Countries: National, Regional, and Global Prevalence Estimates Using Predictive Modeling
Erratum in
-
Correction: Early Childhood Developmental Status in Low- and Middle-Income Countries: National, Regional, and Global Prevalence Estimates Using Predictive Modelling.PLoS Med. 2017 Jan 30;14(1):e1002233. doi: 10.1371/journal.pmed.1002233. eCollection 2017 Jan. PLoS Med. 2017. PMID: 28135271 Free PMC article.
Abstract
Background: The development of cognitive and socioemotional skills early in life influences later health and well-being. Existing estimates of unmet developmental potential in low- and middle-income countries (LMICs) are based on either measures of physical growth or proxy measures such as poverty. In this paper we aim to directly estimate the number of children in LMICs who would be reported by their caregivers to show low cognitive and/or socioemotional development.
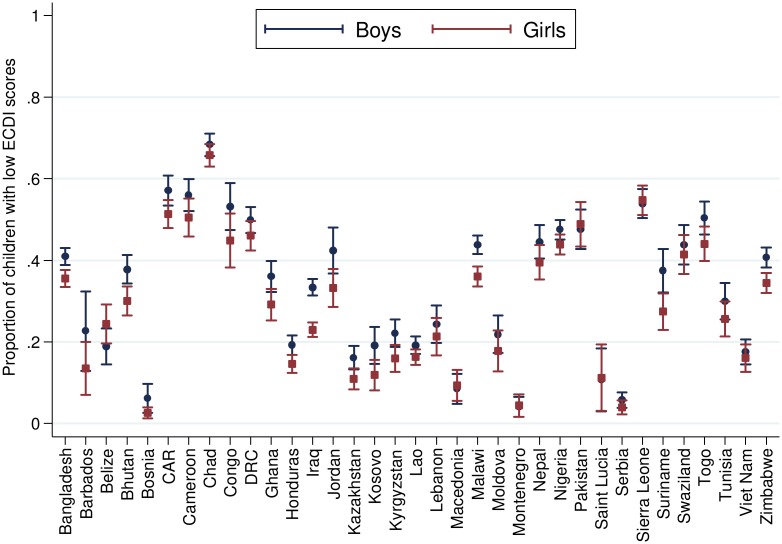
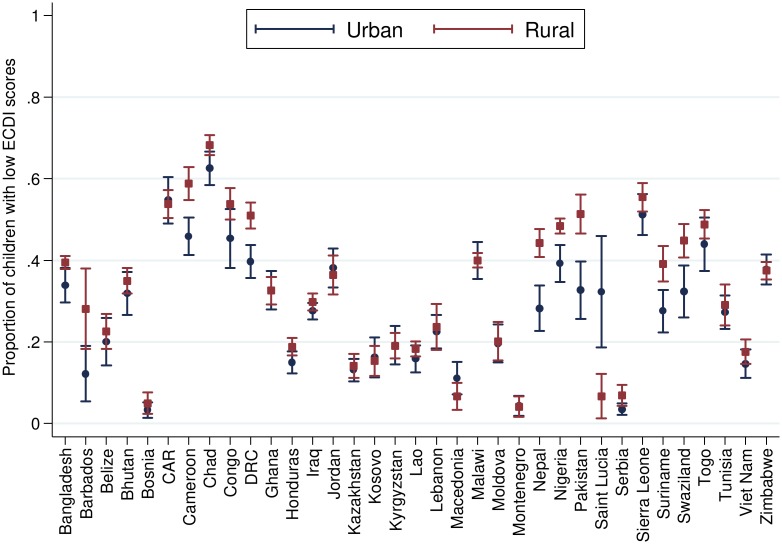
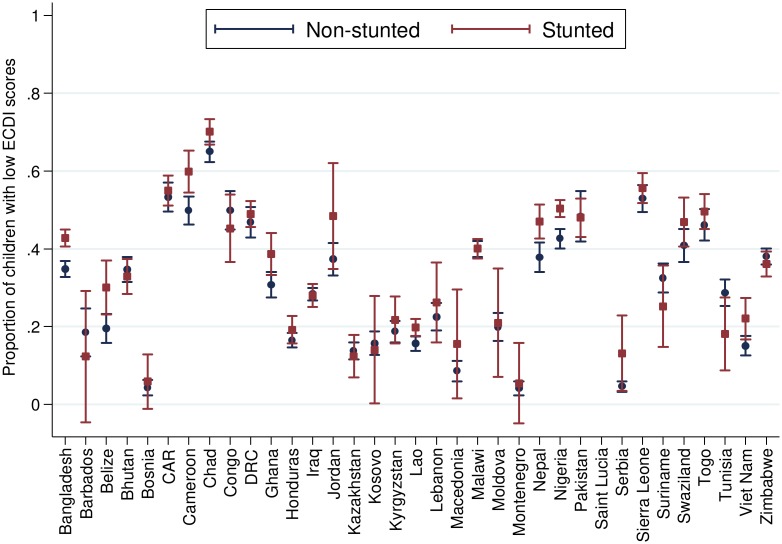
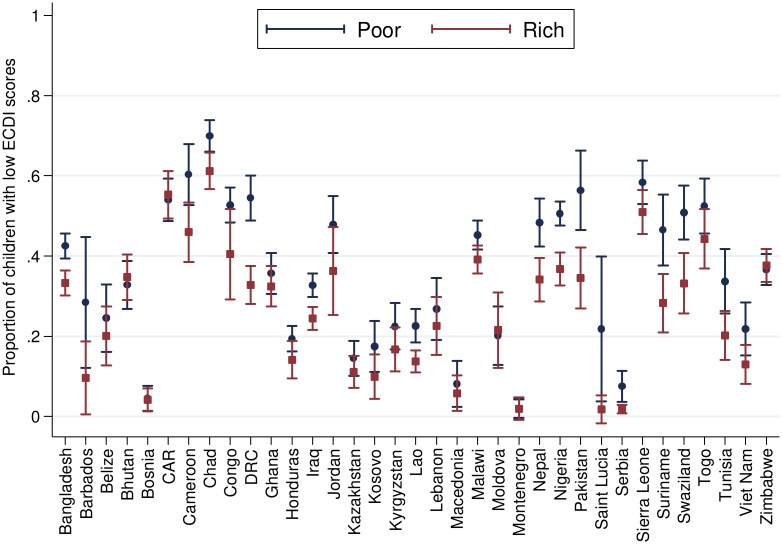
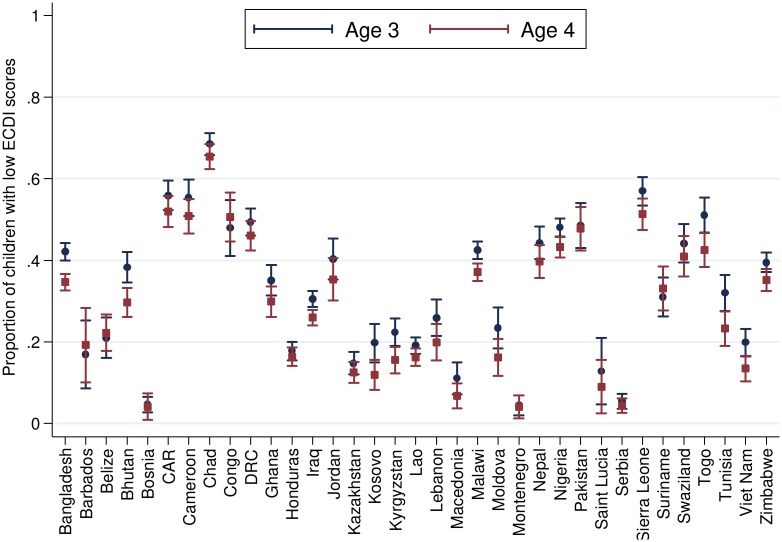
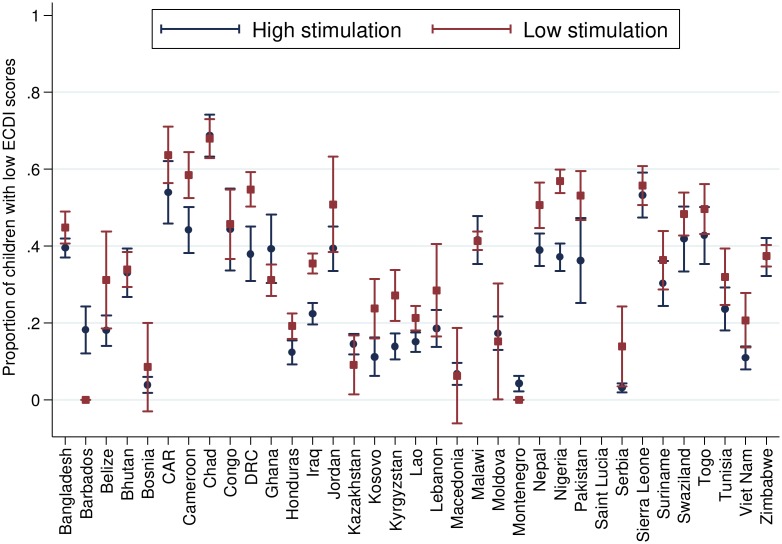
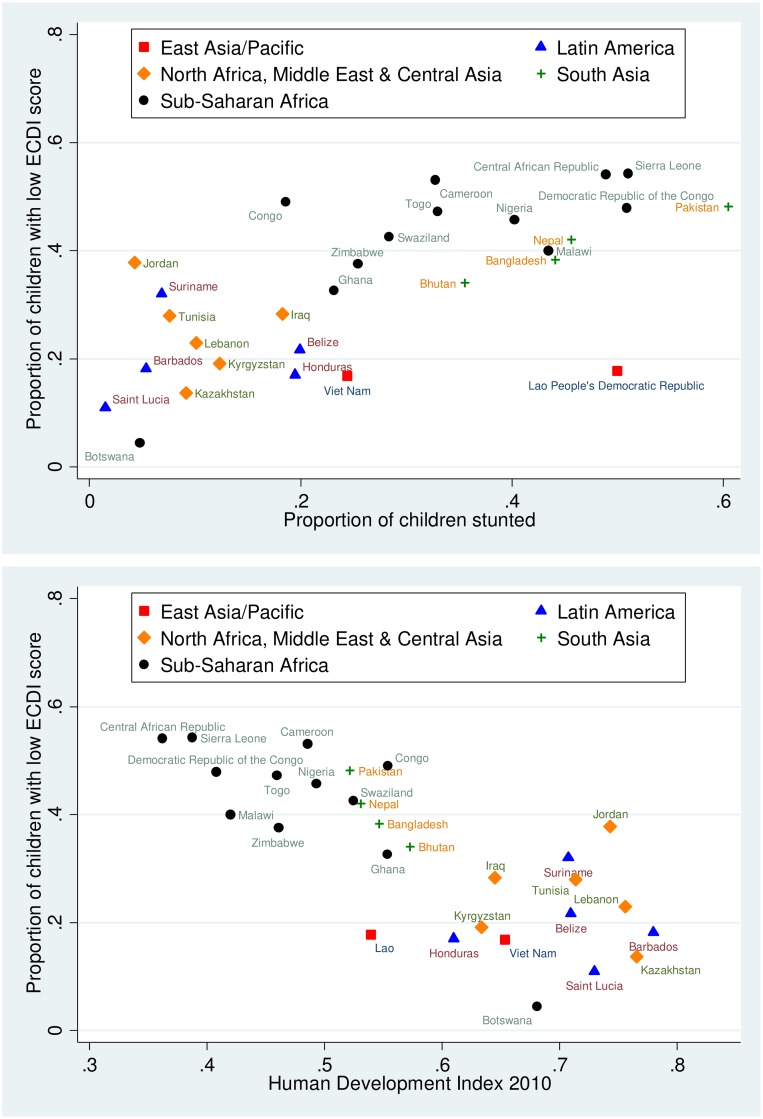
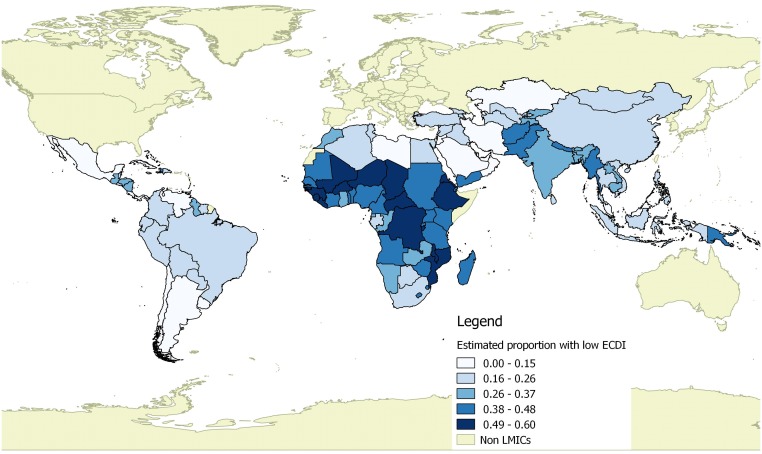
Methods and findings: The present paper uses Early Childhood Development Index (ECDI) data collected between 2005 and 2015 from 99,222 3- and 4-y-old children living in 35 LMICs as part of the Multiple Indicator Cluster Survey (MICS) and Demographic and Health Surveys (DHS) programs. First, we estimate the prevalence of low cognitive and/or socioemotional ECDI scores within our MICS/DHS sample. Next, we test a series of ordinary least squares regression models predicting low ECDI scores across our MICS/DHS sample countries based on country-level data from the Human Development Index (HDI) and the Nutrition Impact Model Study. We use cross-validation to select the model with the best predictive validity. We then apply this model to all LMICs to generate country-level estimates of the prevalence of low ECDI scores globally, as well as confidence intervals around these estimates. In the pooled MICS and DHS sample, 14.6% of children had low ECDI scores in the cognitive domain, 26.2% had low socioemotional scores, and 36.8% performed poorly in either or both domains. Country-level prevalence of low cognitive and/or socioemotional scores on the ECDI was best represented by a model using the HDI as a predictor. Applying this model to all LMICs, we estimate that 80.8 million children ages 3 and 4 y (95% CI 48.1 million, 113.6 million) in LMICs experienced low cognitive and/or socioemotional development in 2010, with the largest number of affected children in sub-Saharan Africa (29.4.1 million; 43.8% of children ages 3 and 4 y), followed by South Asia (27.7 million; 37.7%) and the East Asia and Pacific region (15.1 million; 25.9%). Positive associations were found between low development scores and stunting, poverty, male sex, rural residence, and lack of cognitive stimulation. Additional research using more detailed developmental assessments across a larger number of LMICs is needed to address the limitations of the present study.
Conclusions: The number of children globally failing to reach their developmental potential remains large. Additional research is needed to identify the specific causes of poor developmental outcomes in diverse settings, as well as potential context-specific interventions that might promote children's early cognitive and socioemotional well-being.
Conflict of interest statement
The authors have declared that no competing interests exist.
Figures
References
-
- Adair LS, Fall CHD, Osmond C, Stein AD, Martorell R, et al. (2013) Associations of linear growth and relative weight gain during early life with adult health and human capital in countries of low and middle income: findings from five birth cohort studies. Lancet 382: 525–534. 10.1016/S0140-6736(13)60103-8 - DOI - PMC - PubMed
-
- Duncan GJ, Dowsett CJ, Claessens A, Magnuson K, Huston AC, et al. (2007) School readiness and later achievement. Dev Psychol 43: 1428–1446. - PubMed
Publication types
MeSH terms
Grants and funding
LinkOut - more resources
Full Text Sources
Other Literature Sources
Medical
