. 2016 Jun 7:7:11833.
doi: 10.1038/ncomms11833.

Overfishing and nutrient pollution interact with temperature to disrupt coral reefs down to microbial scales

Affiliations

Overfishing and nutrient pollution interact with temperature to disrupt coral reefs down to microbial scales

Jesse R Zaneveld et al. Nat Commun. .

Abstract

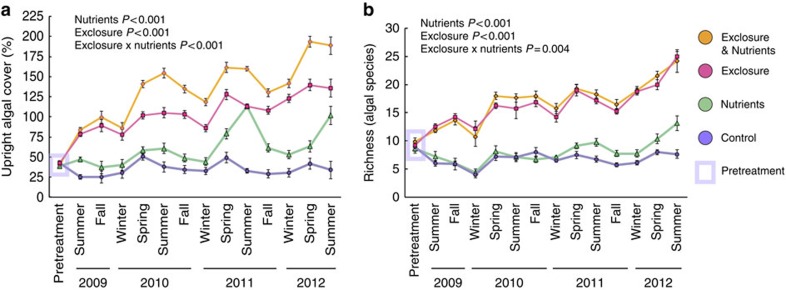
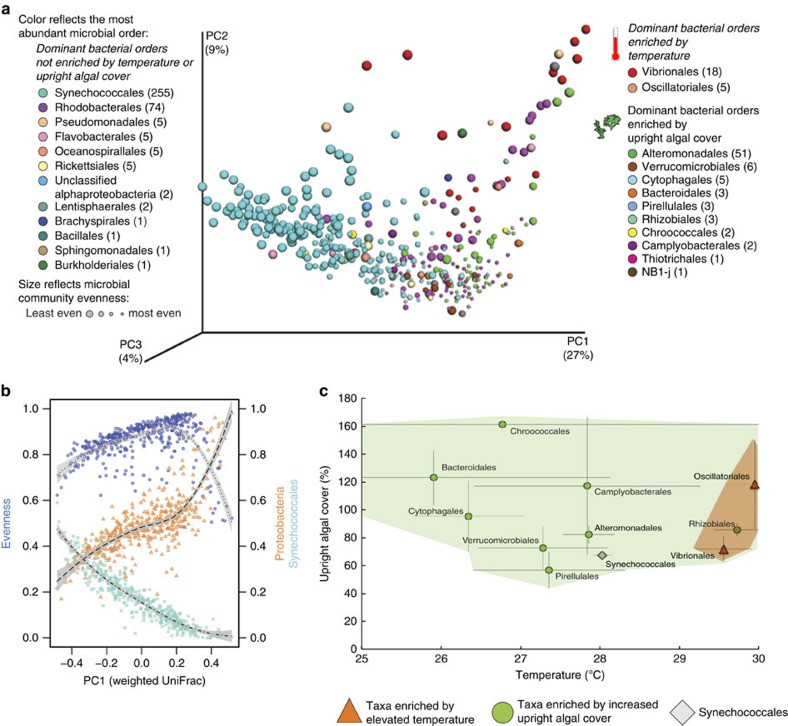
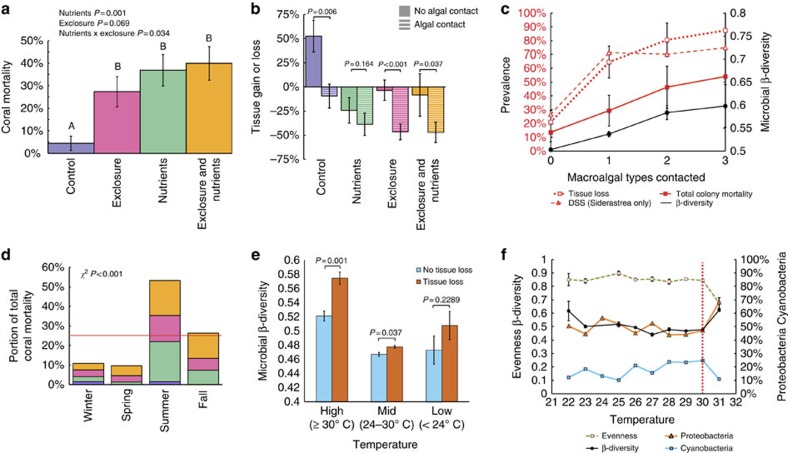
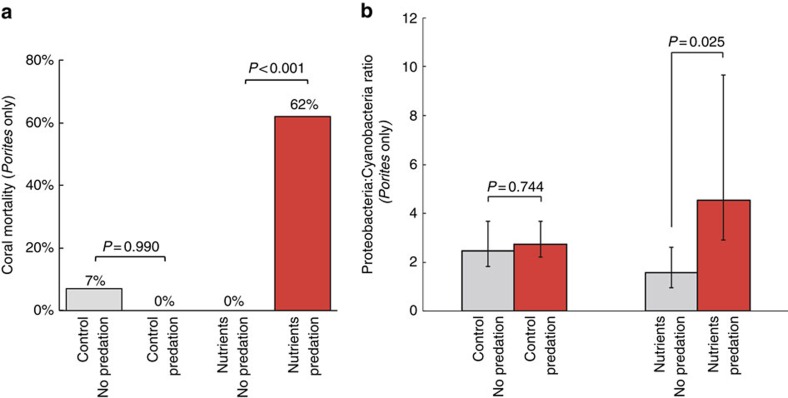
Losses of corals worldwide emphasize the need to understand what drives reef decline. Stressors such as overfishing and nutrient pollution may reduce resilience of coral reefs by increasing coral-algal competition and reducing coral recruitment, growth and survivorship. Such effects may themselves develop via several mechanisms, including disruption of coral microbiomes. Here we report the results of a 3-year field experiment simulating overfishing and nutrient pollution. These stressors increase turf and macroalgal cover, destabilizing microbiomes, elevating putative pathogen loads, increasing disease more than twofold and increasing mortality up to eightfold. Above-average temperatures exacerbate these effects, further disrupting microbiomes of unhealthy corals and concentrating 80% of mortality in the warmest seasons. Surprisingly, nutrients also increase bacterial opportunism and mortality in corals bitten by parrotfish, turning normal trophic interactions deadly for corals. Thus, overfishing and nutrient pollution impact reefs down to microbial scales, killing corals by sensitizing them to predation, above-average temperatures and bacterial opportunism.


Figures

Figure 1
Figure 1. Herbivore exclusion and nutrient pollution alter algal communities.
(a) Upright algal cover (macroalgae, cyanobacteria and tall turf algae), with herbivore exclusion and/or nutrient pollution over time. Total cover often exceeds 100% due to the three-dimensional algal canopy. (b) Macroalgal species richness over time. P values are from mixed effect models (Supplementary Table Data 1c). Data are means±s.e.m.
Figure 2
Figure 2. Algal competition and temperature combine to alter coral microbiomes by driving bacterial blooms.
(a) Principle coordinates analysis plot, summarizing weighted UniFrac distances between coral microbial samples (n=435). The main pattern we seek to show here is a shift from Synechococcus-dominated communities (cyan) to dominance by a wide variety of other orders as one moves from left to right along PC1. Points are coloured to reflect the most dominant (numerically abundant) microbial order in each sample. Sizes reflect quartiles of microbial community evenness (measured by equitability). Orders that were significantly enriched by temperature or upright algal cover (Pearson regression, FDR q<0.05, Supplementary Table Data 3f and 3g) are grouped together in the legend. Parentheses next to each order note the number of samples, in which that order was dominant. Orders that were dominant in ≥15 samples are marked in bold. (b) Displacement of Synechococcales by varied Proteobacteria structured differences between stressed coral microbiomes. Points plot the 1st PC axis (a) against the relative abundance of Synechococcales (cyan squares, dot-dashed line), Proteobacteria (orange triangles, dashed line) and overall microbial community evenness (blue circles, dotted line). Lines show local regression (Loess regression, span=0.75), with grey bars shading extending to twice the s.e. of the regression. (c) Combinations of algal cover (macroalgae, cyanobacteria and tall turf algae) and naturally occurring seawater temperature that allowed algae- or temperature- enriched bacterial orders (a) to dominate coral microbiomes. The position of each point, and its associated error bars, represents mean algal cover and temperature, and their s.e.'s, for all samples that were dominated by the labelled bacterial order. Synechococcales, which dominated most (258/435) coral microbiome samples, are included as a reference. Taxa dominating ≥15 samples are marked in bold. Coloured polygons enclose suites of taxa whose mean abundance increased with temperature (orange) or upright algal cover (green; Supplementary Data 3 sheets f–h). Vibrionales and Oscillatoriales responded to both temperature and algal cover, but for Vibrionales only temperature was significant.
Figure 3
Figure 3. Multiple stressors disrupt coral microbial communities and produce coral mortality.
(a) Cumulative coral mortality at end of experiment. P values are from mixed effect models, letters over bars show differences in Tukey's post hoc tests. Herbivore removal significantly increased coral mortality relative to controls (Tukey's post hoc test P<0.05), but not relative to nutrient pollution alone (post hoc test and mixed effects model P>0.05). (b) Effects of algal contact on coral tissue area, across treatments. P values from ANOVAs test the effect of algal contact within each treatment. (c) Number of algal taxa contacting corals versus microbiome β-diversity (weighted UniFrac distance), and the prevalence of coral tissue loss, mortality and Siderastrea dark spot syndrome (DSS). (d) Seasonal distribution of coral mortality, coloured by treatment (a). Red line marks null expectation of equal mortality across seasons. P value is from a χ2-test. (e) Microbial community β-diversity for corals with or without tissue loss, split by temperature. P values reflect non-parametric t-tests of distances. (f) Temperature effects on coral microbial variability, evenness and relative abundance of Proteobacteria or Cyanobacteria. Evenness and β-diversity data are means±s.e.m. Microbial and coral health data are averaged within each 1 °C interval on the x axis. The vertical red line at 30 °C indicates the point nearest to the MMM +1 °C value for our site (30.26 °C); temperatures beyond this result in accumulation of degree heating weeks of coral thermal stress (Methods).
Figure 4
Figure 4. Effects of nutrient pollution and parrotfish predation on coral mortality and microbiology.
(a) Mortality after predation on Porites corals in control or nutrient pollution plots. P values reflect Fisher's exact test. (b) Effects of predation on the relative abundance of Proteobacteria and Cyanobacteria in Porites corals in control or nutrient pollution plots. Parrotfish predation columns (in red) reflect samples taken after the first evidence of parrotfish predation. Error bars in b reflect the 95% CI of the ratio. P values are from non-parametric t-tests.

References

    1. Jackson J., Donovan M. K., Cramer K. L. & Lam V. V. Status and Trends of Caribbean Coral Reefs: 1970–2012 Global Coral Reef Monitoring Network, IUCN, Gland (2014).
    1. Bruno J. F. & Selig E. R. Regional decline of coral cover in the Indo-Pacific: timing, extent, and subregional comparisons. PLoS One 2, e711 (2007). - PMC - PubMed
    1. Wilkinson C. Status of Coral Reefs of the World: 2008 (Global Coral Reef Monitoring Network and Reef and Rainforest Research Centre (2008).
    1. Bruno J. F. et al. Thermal stress and coral cover as drivers of coral disease outbreaks. PLoS Biol. 5, 1220–1227 (2007). - PMC - PubMed
    1. Eakin C. M. et al. Caribbean corals in crisis: record thermal stress, bleaching, and mortality in 2005. PLoS One 5, e13969 (2010). - PMC - PubMed

Publication types

LinkOut - more resources