. 2016 Jun 8:6:27558.
doi: 10.1038/srep27558.

Glucose induced activation of canonical Wnt signaling pathway in hepatocellular carcinoma is regulated by DKK4

Affiliations

Glucose induced activation of canonical Wnt signaling pathway in hepatocellular carcinoma is regulated by DKK4

Surbhi Chouhan et al. Sci Rep. .

Abstract

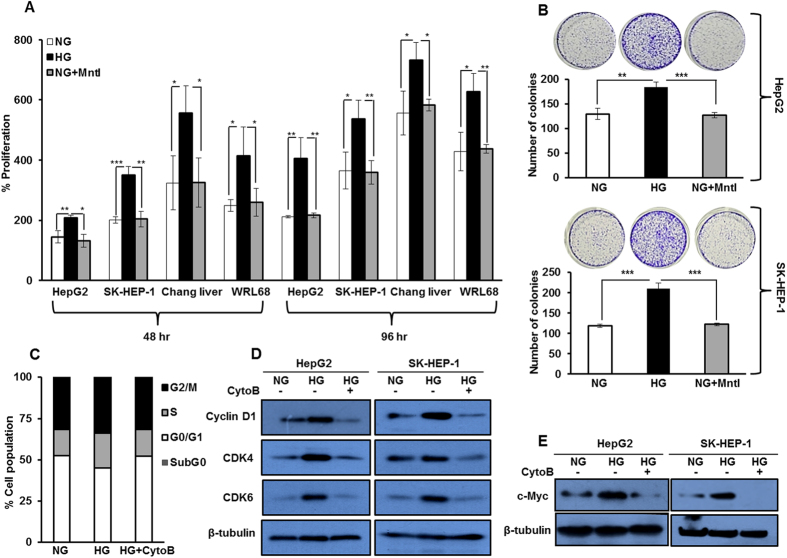
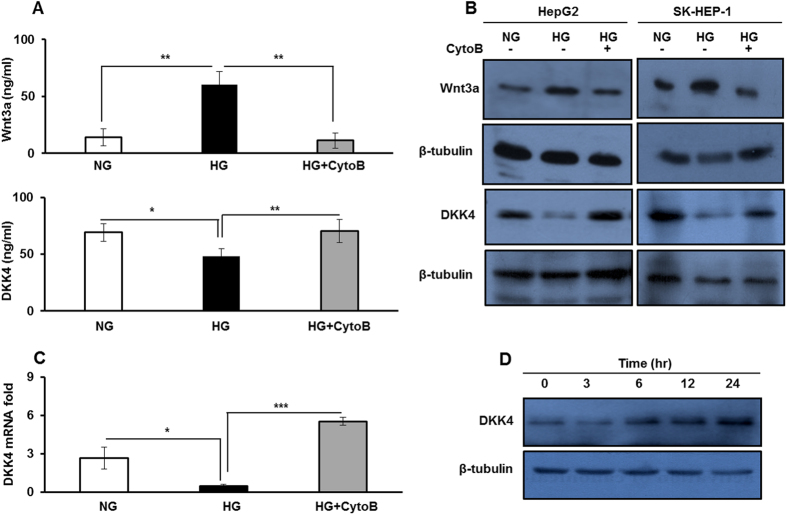
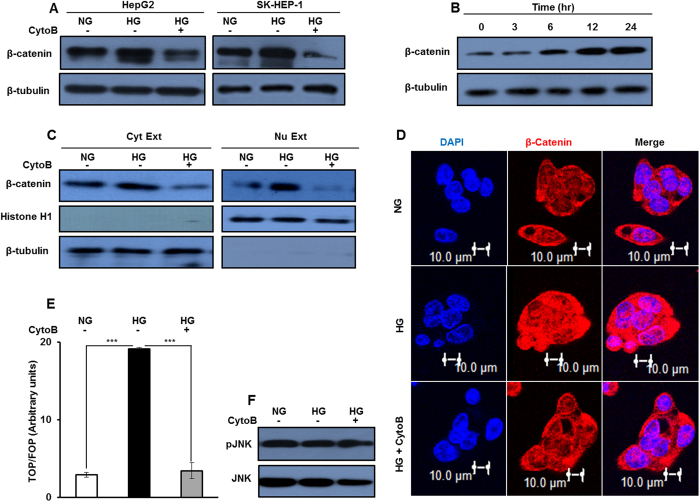
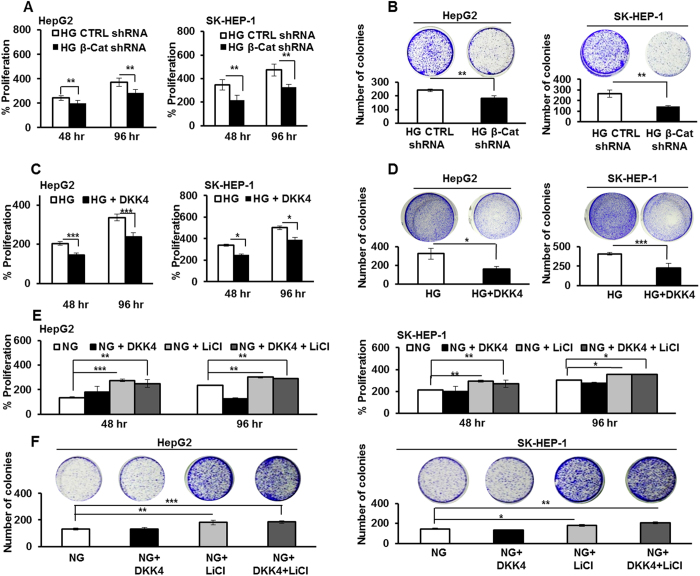
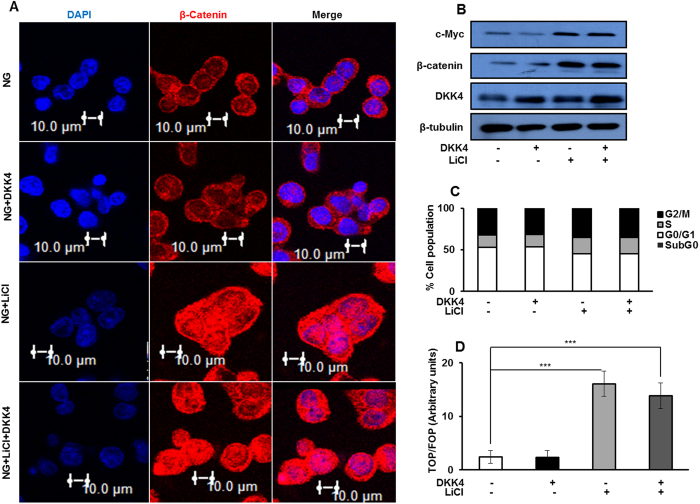
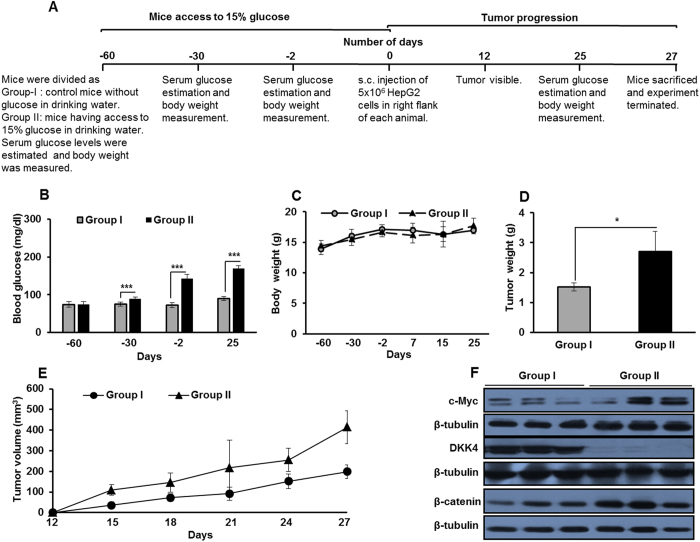
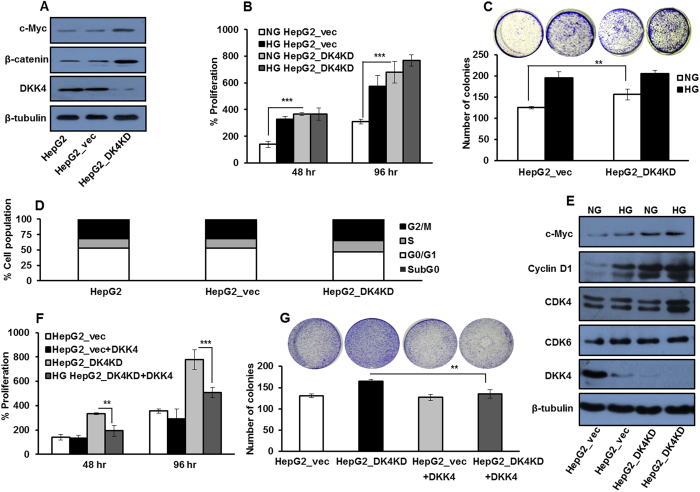
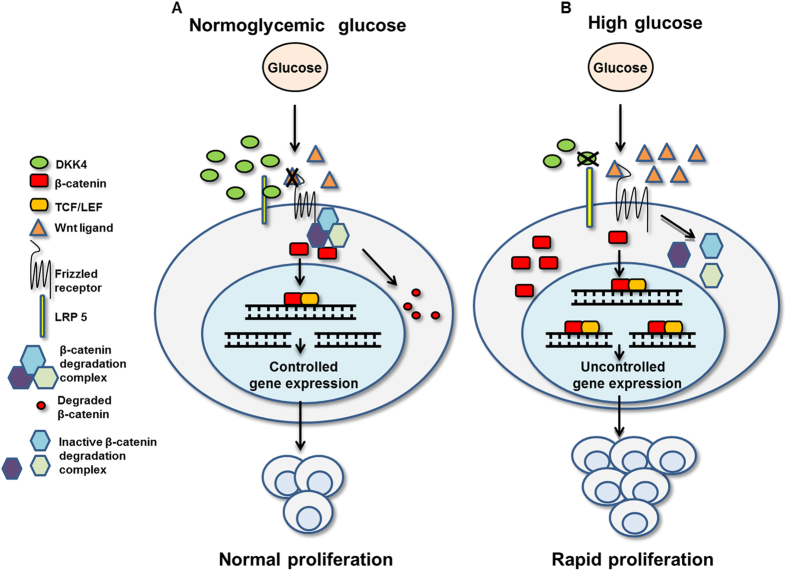
Elevated glycemic index, an important feature of diabetes is implicated in an increased risk of hepatocellular carcinoma (HCC). However, the underlying molecular mechanisms of this association are relatively less explored. Present study investigates the effect of hyperglycemia over HCC proliferation. We observed that high glucose culture condition (HG) specifically activates canonical Wnt signaling in HCC cells, which is mediated by suppression of DKK4 (a Wnt antagonist) expression and enhanced β-catenin level. Functional assays demonstrated that a normoglycemic culture condition (NG) maintains constitutive expression of DKK4, which controls HCC proliferation rate by suppressing canonical Wnt signaling pathway. HG diminishes DKK4 expression leading to loss of check at G0/G1/S phases of the cell cycle thereby enhancing HCC proliferation, in a β-catenin dependent manner. Interestingly, in NOD/SCID mice supplemented with high glucose, HepG2 xenografted tumors grew rapidly in which elevated levels of β-catenin, c-Myc and decreased levels of DKK4 were detected. Knockdown of DKK4 by shRNA promotes proliferation of HCC cells in NG, which is suppressed by treating cells exogenously with recombinant DKK4 protein. Our in vitro and in vivo results indicate an important functional role of DKK4 in glucose facilitated HCC proliferation.


Figures

Figure 1
Figure 1. Glucose enhances proliferation in hepatocellular carcinoma cell lines.
(A) HCC cells (HepG2, SK-HEP-1, Chang liver and WRL 68) were cultured in HG and NG conditions for 48 hr and 96 hr. Thereafter, percent proliferation was determined by MTT assay. Mannitol (Mntl) treated NG conditions served as an osmolarity control. (B) HCC cells were cultured in NG, NG + Mntl and HG, and colonies were visualized by crystal violet stain and counted after 21 days. (C) Cell cycle profile of HepG2 cells cultured in NG, HG and HG + CytoB for 16 hr. Bar graphs represent percentage of cells in different phases of cell cycle by flow cytometry of an experiment done in triplicate. (D,E) HepG2 cells were cultured in NG, HG and HG + CytoB for 16 hr and whole cell lysates were subjected to detection of Cyclin D1, CDK6, CDK4 and c-Myc by western blotting. All the bar graph represents the mean ± SD of an experiment done in triplicate (*P < 0.05, **P < 0.001, ***P < 0.0001). Cropped blots are used in the main figure and full length blots are included in Supplementary Figure 6.
Figure 2
Figure 2. High glucose increases Wnt3a level and suppresses the expression of its antagonist DKK4.
(A) ELISA measurements of Wnt3a and DKK4 secretory proteins in culture media collected after 16 hr from HepG2 cells in NG, HG and HG + CytoB. (B) HepG2 and SK-HEP-1 cells were cultured in NG, HG and HG + CytoB for 16 hr. Whole cell lysates were subjected to western blotting and levels of Wnt3a and DKK4 proteins were detected. (C) HepG2 cells were cultured in NG, HG and HG + CytoB for 16 hr. Total RNA was isolated and cDNA was prepared to determine relative mRNA fold expression of DKK4 by quantitative real-time RT-PCR. (D) HepG2 cells were cultured in HG for 16 hr and then allowed to grow in medium without glucose for indicated time course. Whole cell lysates were prepared for detection of DKK4 protein by western blotting. All the bar graphs represent the mean ± SD of an experiment done in triplicate (*P < 0.05, **P < 0.001, ***P < 0.0001). Cropped blots are used in the main figure and full length blots are included in Supplementary Figure 7.
Figure 3
Figure 3. High glucose induces activation of canonical Wnt signaling.
(A–F) HepG2 and SK-HEP-1 cells were cultured in NG, HG and HG + CytoB for 16 hr. Whole cell lysates were subjected to western blotting and levels of β–catenin, pJNK and JNK proteins were detected. (B) HepG2 cells were serum and glucose starved for 2 hr and then cultured in HG for indicated time intervals. Whole cell lysates were prepared and β-catenin protein level was detected by western blotting. (C) Cytosolic and nuclear extracts were prepared from HepG2 cells cultured in NG, HG and HG + CytoB for 16 hr and processed for immunodetection of β–catenin levels. Cropped blots are used in the main figure and full length blots are included in Supplementary Figure 8. (D) HepG2 cells were cultured in NG, HG and HG + CytoB for 16 hr and cells were processed for immunofluorosence based confocal imaging of β–catenin protein. Bars represent 10 μm. (E) β–catenin transcription activity was determined by TCF reporter assay in HepG2 cells cultured in NG, HG and HG + CytoB for 16 hr. The luciferase intensities were normalized with Renilla intensities and data is represented as ratio of TOP/FOP. Bar graph represents mean ± SE of three independent experiments (*P < 0.05, **P < 0.001, ***P < 0.0001).
Figure 4
Figure 4. Glucose induced proliferation is dependent on β-catenin expression.
(A) HepG2 and SK-HEP-1 cells were cultured in HG and transfected with β-catenin shRNA or control shRNA and percentage proliferation was determined by MTT assay. (B) HCC cells were transfected with β-catenin shRNA or control shRNA. Post 48 hr of transfection cells were cultured for additional 21 days. Thereafter, colonies were visualized by crystal violet stain and counted. (C) HCC cells were cultured in HG and HG + DKK4 protein in culture medium for 48 hr and 96 hr. MTT assay was performed and percentage proliferation was determined. (D) HCC cells were cultured in HG and HG + DKK4 recombinant protein in culture medium for 48 hr and cells were cultured for additional 21 days. Thereafter, colonies were visualized by crystal violet stain and counted. (E) HepG2 and SK-HEP-1 cells were cultured in NG, NG + LiCl, NG + DKK4 and NG + LiCl + DKK4 protein, for 48 hr and 96 hr. Percentage proliferation was determined by MTT assay. (F) Colony formation assay in HCC cells cultured in NG, NG + LiCl or NG + DKK4 or NG + LiCl + DKK4 protein, for 48 hr and cells were cultured for additional 21 days. Thereafter, colonies were visualized by crystal violet stain and counted. All the bar graphs represent the mean ± SD of an experiment done in triplicate (*P < 0.05, **P < 0.001, ***P < 0.0001).
Figure 5
Figure 5. β-catenin stabilization in NG reverses effect of DKK4.
(A) Immunofluorosence based confocal imaging of β–catenin protein in HepG2 cells cultured under indicated conditions for 16 hr. Bars represent 10 μm. (B) Immunoblotting for DKK4, β-catenin and c-Myc in HepG2 cells cultured in NG, NG + LiCl, NG + DKK4 and NG + LiCl + DKK4 protein, for 16 hr. Cropped blots are used in the main figure and full length blots are included in Supplementary Figure 9. (C) Cell cycle profile of HepG2 cells cultured in NG, NG + LiCl, NG + DKK4 and NG + LiCl + DKK4 protein, for 16 hr. Bar graphs represent percentage of cells in different phases of cell cycle by flow cytometry. (D) TCF reporter activity assay in HepG2 cells cultured in NG, NG + LiCl, NG + DKK4 and NG + LiCl + DKK4, protein for 16 hr. The luciferase intensities were normalized with Renilla intensities and data is represented as ratio of TOP/FOP. Bar graphs represent mean ± SE of three independent experiments (*P < 0.05, **P < 0.001, ***P < 0.0001).
Figure 6
Figure 6. High glucose enhances HepG2 xenograft tumor growth in vivo.
(A) Experimental layout for studying the effects of hyperglycemia on initiation and progression of HCC. (B) Blood glucose (mg/dl). (C) Body weight (g). (D) Tumor weight (g). (E) HepG2 cells (5 × 106/mice) were injected s.c. on the right flank of each mouse. Tumor initiation and progression in Group-I and Group-II mice were recorded for 27 days. Data is represented as mean of five mice ± SD (*P < 0.05, **P < 0.001, ***P < 0.0001). (F) Protein level of c-Myc, β–catenin and DKK4 in representative three tumor samples each from mice of Group-I and Group-II were detected by western blotting. Cropped blots are used in the main figure and full length blots are included in Supplementary Figure 9.
Figure 7
Figure 7. DKK4 affects glucose induced proliferation in HCC.
(A) HepG2, HepG2_vec and HepG2_DK4KD cells were cultured in NG for 16 hr and western blotting was performed to detect protein levels of c-Myc, DKK4 and β–catenin. (B) HepG2_vec and HepG2_D4KD cells were cultured in NG and HG for 48 hr and 96 hr. Percentage cell proliferation was determined by MTT assay. (C) HepG2_vec and HepG2_D4KD cells were cultured in NG and HG and colonies were visualized by crystal violet stain and counted after 21 days. All the bar graphs represent the mean ± SD of an experiment done in triplicate (*P < 0.05, **P < 0.001, ***P < 0.0001). (D) Cell cycle profile of HepG2_vec and HepG2_D4KD cells cultured in NG for 16 hr. Bar graph represents percentage of cells in different phases of cell cycle by flow cytometry. (E) HepG2_vec and HepG2_D4KD cells were cultured in NG and HG for 16 hr and whole cell lysates were subjected to detection of c-Myc, Cyclin D1, CDK6, CDK4 and DKK4 proteins by western blotting. (F) HepG2_D4KD and HepG2_vec cells were cultured in NG and NG + DKK4 protein, for 48 hr and 96 hr. Thereafter, percentage cell proliferation was determined by MTT assay. (G) HepG2_D4KD and HepG2_vec cells were cultured in NG and NG + DKK4 protein. Colonies were visualized by crystal violet stain and counted after 21 days. All the bar graphs represent the mean ± SD of an experiment done in triplicate (*P < 0.05, **P < 0.001, ***P < 0.0001). Cropped blots are used in the main figure and full length blots are included in Supplementary Figure 10.
Figure 8
Figure 8. Schematic representation of glucose induced regulation of DKK4 and effect over HCC proliferation.
(A) Normoglycemic glucose promotes sustained expression of DKK4 protein. DKK4 antagonizes activation of canonical Wnt signaling by facilitating degradation of β–catenin in cytosol and thus reducing its transcriptional activation thereby causing decrease c-Myc level. Increased DKK4 expression affects progression of cells at S-phase of cell cycle and therefore limits proliferation of HCC cells. (B) High glucose diminishes DKK4 expression allowing activation of canonical Wnt signaling because of inactivation of β–catenin degradation complex, by Wnt3a proteins. Increase in β–catenin level enhances its transcriptional activity and promotes c-Myc expression which causes uncontrolled proliferation of HCC cells.

References

    1. Ferenci P. et al. Hepatocellular carcinoma (HCC): a global perspective. J. Clin. Gastroenterol. 44, 239–245 (2010). - PubMed
    1. Liu C. J. & Kao J. H. Global perspective on the natural history of chronic hepatitis B: role of hepatitis B virus genotypes A to J. Semin. Liver Dis. 33, 92–102 (2013). - PubMed
    1. Venook A. P., Papandreou C., Furuse J. & de Guevara L. L. The incidence and epidemiology of hepatocellular carcinoma: a global and regional perspective. Oncologist 15, 5–13 (2010). - PubMed
    1. Wang P., Kang D., Cao W., Wang Y. & Liu Z. Diabetes mellitus and risk of hepatocellular carcinoma: a systematic review and meta-analysis. Diabetes Metab. Res. Rev. 28, 109–122 (2012). - PubMed
    1. Tolman K. G., Fonseca V., Dalpiaz A. & Tan M. H. Spectrum of liver disease in type 2 diabetes and management of patients with diabetes and liver disease. Diabetes Care 30, 734–743 (2007). - PubMed

Publication types

MeSH terms