. 2016 Jun 7:7:11596.
doi: 10.1038/ncomms11596.

Th2 and eosinophil responses suppress inflammatory arthritis

Affiliations

Th2 and eosinophil responses suppress inflammatory arthritis

Zhu Chen et al. Nat Commun. .

Abstract

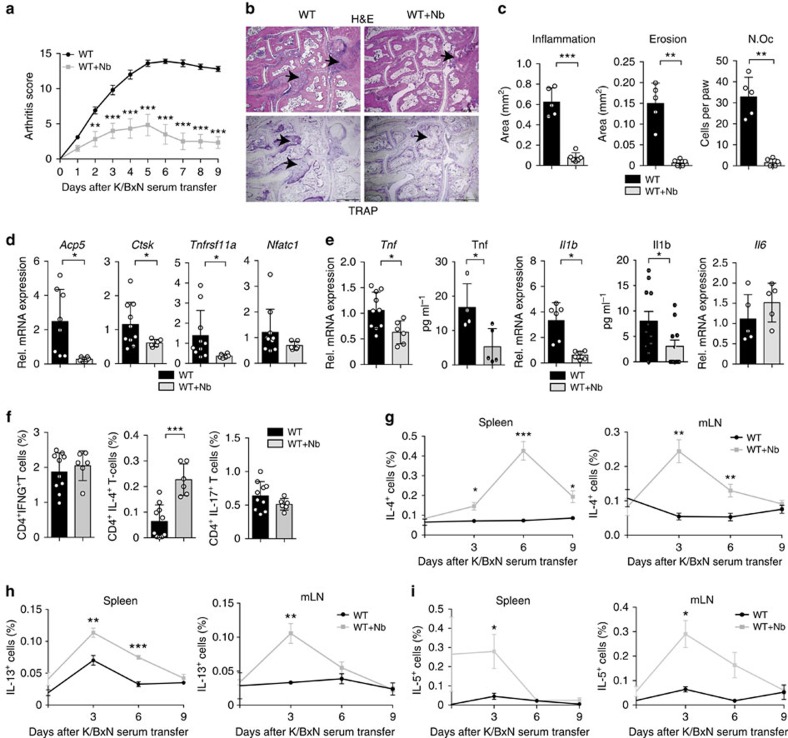
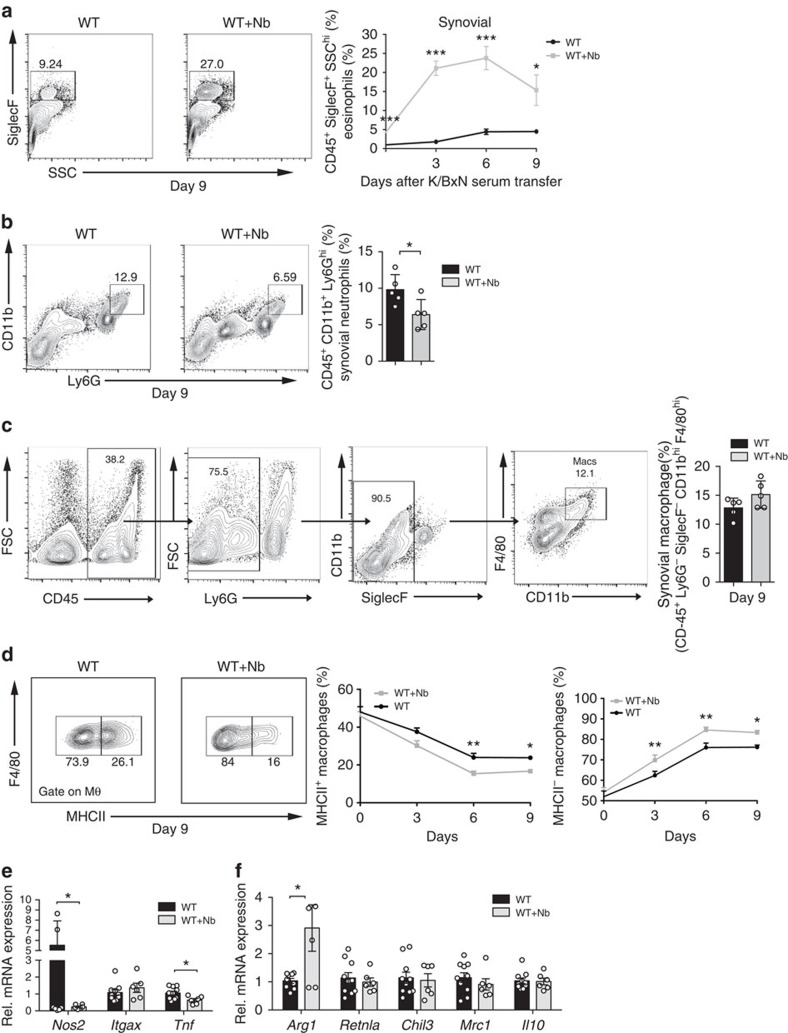
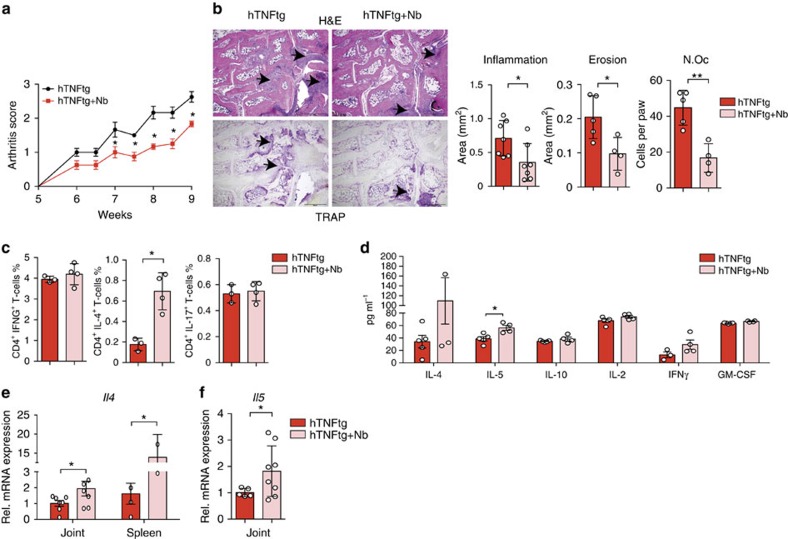
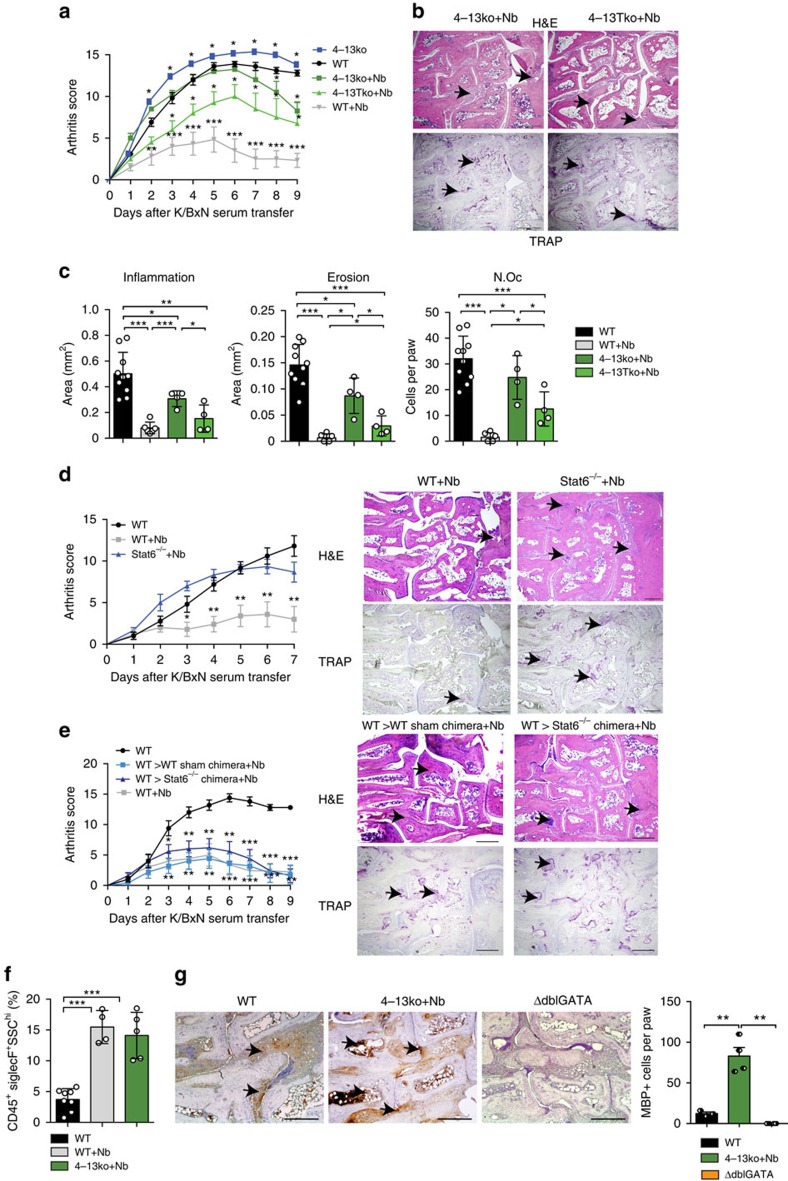
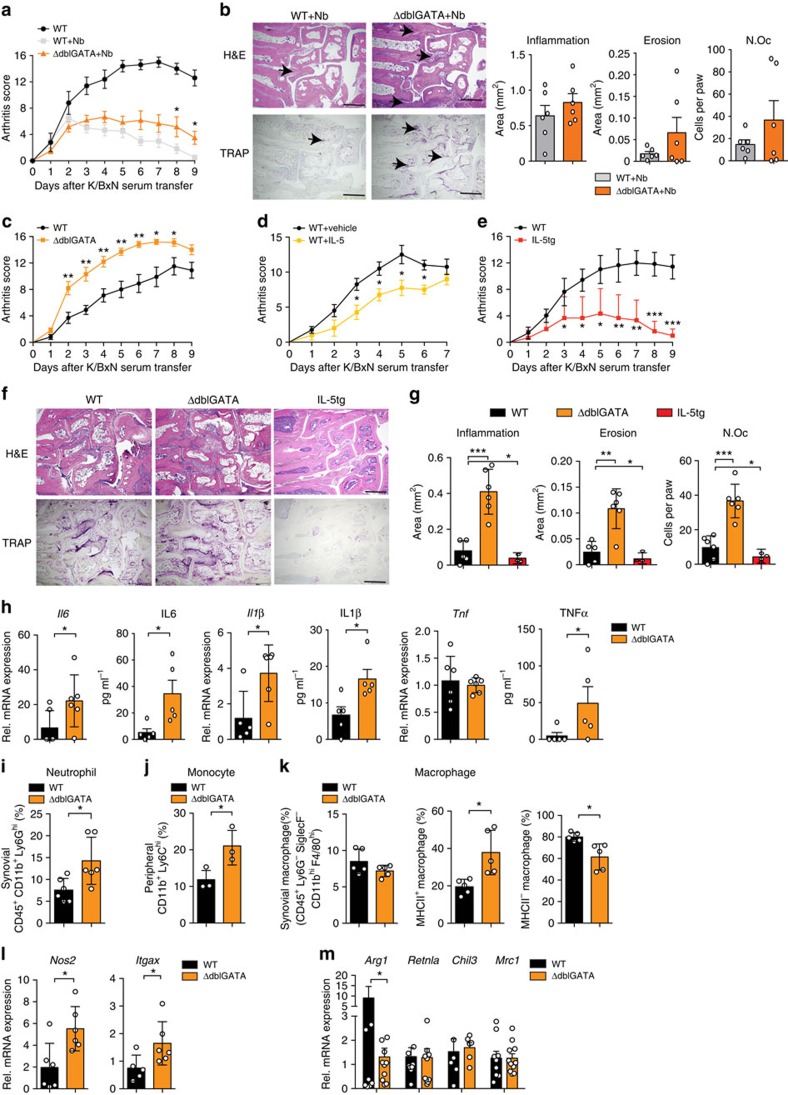
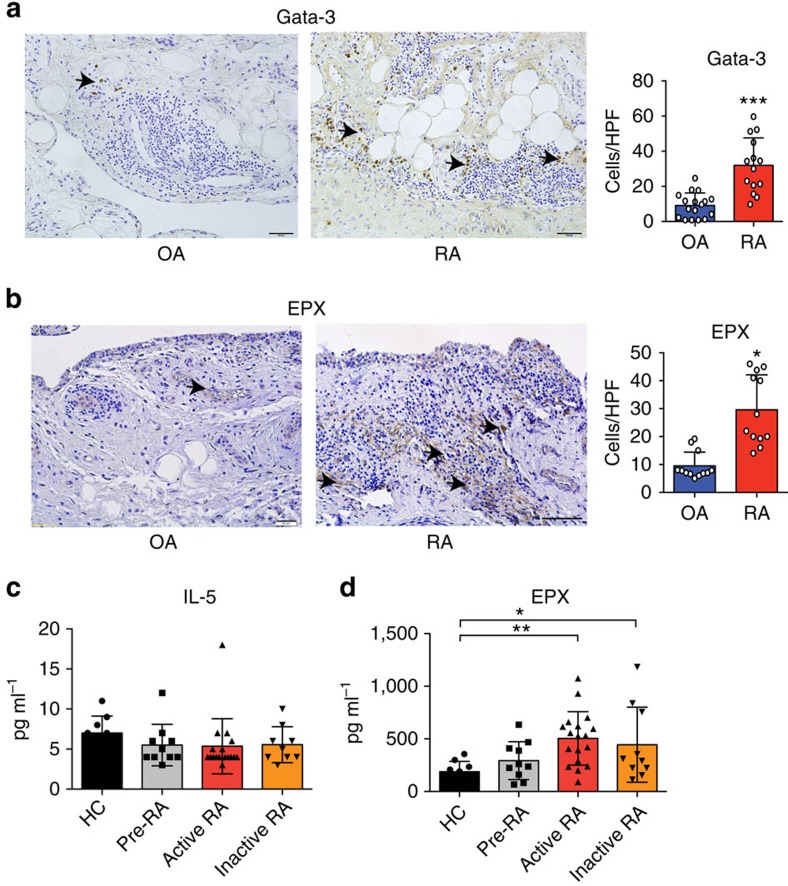
Th2-eosinophil immune responses are well known for mediating host defence against helminths. Herein we describe a function of Th2-eosinophil responses in counteracting the development of arthritis. In two independent models of arthritis, Nippostrongylus brasiliensis infection leads to Th2 and eosinophil accumulation in the joints associated with robust inhibition of arthritis and protection from bone loss. Mechanistically, this protective effect is dependent on IL-4/IL-13-induced STAT6 pathway. Furthermore, we show that eosinophils play a central role in the modulation of arthritis probably through the increase of anti-inflammatory macrophages into arthritic joints. The presence of these pathways in human disease is confirmed by detection of GATA3-positive cells and eosinophils in the joints of rheumatoid arthritis patients. Taken together, these results demonstrate that eosinophils and helminth-induced activation of the Th2 pathway axis effectively mitigate the course of inflammatory arthritis.


Figures

Figure 1
Figure 1. N. brasiliensis infection inhibits K/BxN SIA.
(a) Arthritis scores from WT mice infected or not with N. brasiliensis (Nb) (n=6–10 per group). (b,c) Hematoxylin and eosin (H&E) and tartrate-resistant acid phosphatase (TRAP) staining (b), and quantification of inflammation area, erosion area and number of osteoclasts per paw (N.Oc per paw) (c) in the hind paw of WT mice with or without Nb challenge at day 9 post serum transfer (n=6 per group). Scale bar, 500 μm. (d,e) Analyses of Acp5 (encoding TRAP), Ctsk (encoding cathepsin K), Tnfrsf11a (encoding RANK), Nfatc1 (encoding NFATc1) (d), Tnf, Il1b and Il6 (e) mRNA expression in synovial extracts and TNF and IL1β serum levels in WT mice with and without Nb challenge at day 9 post serum transfer (n=8–11 per group). (f) Frequency of CD4+IFN-γ+ (Th1), CD4+IL-4+ (Th2) and CD4+IL-17+ (Th17) cells in the spleen of WT mice with or without Nb challenge at day 9 post serum transfer (n=6–10 per group). (gi) Frequency of IL-4+ (g), IL-13+ (h) and IL-5+ (i) lymphocytes in the spleen and in mesenteric lymph node (mLN) from WT mice with or without Nb challenge at the indicated time points (n=3–5 per group). Data are shown as mean±s.e.m. Pictures are representative of 3 independent experiments. Asterisks mark statistically significant difference (*P<0.05, **P<0.01 and ***P<0.001 determined by Student's t-test).
Figure 2
Figure 2. N. brasiliensis infection increases eosinophil and anti-inflammatory macrophage numbers in the joints.
(a) Representative contour plots and eosinophil (CD45+SiglecF+) quantification in the ankle joint of WT mice with or without N. brasiliensis (Nb) challenge at day 9 post serum transfer (n=5 per group). Numbers represent percentage in CD45+ cells. Frequency of eosinophils in the joints of WT mice with or without Nb challenge at the indicated time points (n=5 per group). (b) Representative contour plots and percentage of neutrophil (CD45+CD11b+Ly6Ghi) in the joints of WT mice with or without Nb challenge at day 9 post serum transfer (n=5 per group). (c) Gating strategy for the identification of macrophages in the joints of WT mice. Percentage of total macrophages (defined as CD45+Ly6GSiglecFCD11bhiF4/80hi cells) in WT mice with or without Nb challenge 9 day post serum transfer (n=5 per group). Numbers represent percentage of the parent population. (d) Frequency of pro (MHC II+) and anti-inflammatory (MHC II) macrophages in the joints of WT mice with or without Nb challenge at the indicated time points (n=15 per group). (e,f) Quantitative reverse transcriptase–PCR (RT–PCR) analyses of (e) Nos2 (encoding inducible nitric oxide synthase), Itgax (encoding CD11c) and Tnf, as well as (f) Arg1 (encoding arginase-1), Retnla (encoding resistin-like alpha), Chil3 (encoding chitinase-like protein 3), Mrc1 (encoding macrophage mannose receptor 1) and Il10 expression in synovial extracts from WT mice with or without Nb challenge (n=6–10 per group). Data are shown as mean±s.e.m. Pictures are representative of 3 independent experiments, except for (d) where the data were pooled from three independent repeats. Asterisks mark statistically significant difference (*P<0.05, **P<0.01 and ***P<0.001, determined by Student's t-test).
Figure 3
Figure 3. N. brasiliensis infection induces Th2 response and alleviates arthritis in TNFα- mediated arthritis.
(a) Arthritis score from 5-week-old hTNFtg mice with or without N. brasiliensis (Nb) challenge. Data are pooled from two independent experiments (n=9 per group). (b) Haematoxylin/eosin (H&E) and tartrate-resistant acid phosphatase (TRAP) staining of the hind paw from 9-week-old hTNFtg mice with or without Nb challenge. Scale bar, 500 μm. Quantification of inflammation area, erosion area and osteoclast number (N.Oc) per paw in the hind paws of hTNFtg mice with or without Nb challenge (n=5–8 per group). (c) Frequency of CD4+IFN-γ+ (Th1), CD4+IL-4+ (Th2) and CD4+IL-17+ (Th17) cells in the spleen of hTNFtg mice with or without Nb challenge (n=4–5 per group). (d) Serum levels of IL-4, IL-5, IL-10, IL-2, IFN-γ and granulocyte–macrophage colony-stimulating factor (GM-CSF) in hTNFtg mice with or without Nb challenge (n=4–5 per group). (e) Quantitative reverse transcriptase–PCR (RT–PCR) analyses of Il4 expression in the spleen and synovial extracts from 9-week-old hTNFtg mice with or without Nb challenge (n=4–8 per group). (f) Quantitative RT–PCR analyses of Il5 expression in synovial extracts of hTNFtg mice with or without Nb challenge (n=4–8 per group). Data are expressed as mean±s.e.m. Pictures are representative of 3 independent experiments. Asterisks mark statistically significant difference (*P<0.05 and **P<0.01 determined by Student's t-test).
Figure 4
Figure 4. Attenuation of arthritis by N. brasiliensis depends on the activation of the IL-4/IL-13/STAT6 pathway.
(a) Arthritis score from WT, 4–13ko and 4–13Tko with or without N. brasiliensis (Nb) challenge (n=4–6 per group). (b,c) Haematoxylin/eosin (H&E) and tartrate-resistant acid phosphatase (TRAP) staining and quantification of inflammation area, erosion area and number of osteoclasts (N.Oc) per paw on day 9 post K/BxN serum transfer in the indicated group of mice (n=4–6 per group); scale bar, 500 μm. (d) Arthritis scores and corresponding H&E and TRAP stainings in unchallenged WT mice and Nb-challenged WT and Stat6−/− mice (n=3–5 per group); scale bar, 500 μm. (e) Arthritis score in unchallenged WT mice and Nb-challenged WT=>WT and WT=>Stat6−/− chimeras (n=5 per group); scale bar, 500 μm. (f) Percentage of eosinophils on day 9 post serum transfer in unchallenged WT and Nb-challenged WT and 4–13ko mice (n=4–8 per group). (g) Major Basic protein (MBP) staining in the joints of WT, Nb-challenged 4–13ko mice and eosinophil-deficient ΔdblGATA mice (negative control) on day 9 post K/BxN serum transfer and respective quantification of staining. All data are expressed as mean±s.e.m. Pictures are representative of 3 independent experiments. Asterisks mark statistically significant difference (*P<0.05, **P<0.01 and ***P<0.001 determined by Student's t-test for single comparison (a,d,e compared with WT without infection) or analysis of variance test for multiple comparisons (c,f,g)).
Figure 5
Figure 5. Eosinophil numbers control resolution of arthritis.
(a) Arthritis score in WT unchallenged and N. brasiliensis (Nb) challenged WT mice and eosinophil-deficient ΔdblGATA mice induced for K/BxN serum transfer arthritis (n=6 per group). (b) Haematoxylin/eosin (H&E) and tartrate-resistant acid phosphatase (TRAP) staining and quantification of inflammation area, erosion area and number of osteoclasts (Oc.N) per paw 9 days after serum transfer (n=6 per group); scale bar, 500 μm. (c) Arthritis score in WT and ΔdblGATA mice after K/BxN serum transfer (n=6 per group). (d) Arthritis scores in WT mice injected with vehicle or recombinant IL-5 during serum transfer (n=4 per group). (e) Arthritis scores in WT and IL-5tg mice after serum transfer (n=6 per group). (f) H&E and TRAP staining and (g) quantification of inflammation area, erosion area and N.Oc per paw 9 days after serum transfer (n=6 per group); scale bar, 500 μm. (h) Analyses of Il6, Il1β and Tnfα mRNA expression in synovial extracts and IL6, IL1β and TNFα serum level of WT and ΔdblGATA mice 9 days after serum transfer (n=6 per group). (i) Percentage of CD45+CD11b+Ly6Ghi neutrophils in the joints of arthritic WT and ΔdblGATA mice (n=5 per group). (j) Percentage of peripheral CD11b+Ly6Chi monocytes in arthritic WT and ΔdblGATA mice (n=3 per group). All analyses above were performed 9 days after serum transfer. (k) Percentage of total macrophages (CD45+Ly6GSiglecFCD11bhiF4/80hi cells), MHC II+ macrophages and MHC II macrophages in the joints of WT and ΔdblGATA mice 9 day after serum transfer (n=5 per group). (l) Quantitative reverse transcriptase–PCR (RT–PCR) analyses of Nos2 and Itgax expression in joint extracts of WT and ΔdblGATA arthritic mice (n=6 per group). (m) Quantitative RT–PCR analyses of Arg1, Retnla, Chil3 and Mrc1 expression in joint extracts of WT and ΔdblGATA mice 9 days after serum transfer (n=6–11 per group). Data are expressed as mean±s.e.m. Pictures are representative of 3 independent experiments. Asterisks mark statistically significant difference (*P<0.05, **P<0.01 and ***P<0.001 determined by Student's t-test for single comparison).
Figure 6
Figure 6. Expression of Th2 and eosinophil markers in human rheumatoid arthritis.
(a) Representative immunohistochemistry staining of GATA3 in the synovium of osteoarthritis (OA) and RA patients. Positive cells per high-power field were compared between groups (n=17 OA patients and 14 RA patients). (b) Representative immunohistochemistry staining of EPX in the synovium of OA and RA patients. Positive cells per high-power field were compared between groups (n=12 OA patients and 12 RA patients). (c) IL-5 serum levels in healthy controls, autoantibody-positive individuals without RA, active and inactive RA patients (n>10 patients per group). (d) Serum EPX levels in healthy controls, autoantibody-positive individuals without RA, active and inactive RA patients (n>10 patients per group). (*P<0.05, **P<0.01 and ***P<0.001 determined by Student's t-test for single comparison (a,b) or analysis of variance test for multiple comparisons (c,d)).

Comment in

References

    1. McInnes I. B. & Schett G. The pathogenesis of rheumatoid arthritis. N. Engl. J. Med. 365, 2205–2219 (2011). - PubMed
    1. Schett G. & Gravallese E. Bone erosion in rheumatoid arthritis: mechanisms, diagnosis and treatment. Nat. Rev. Rheumatol. 8, 656–664 (2012). - PMC - PubMed
    1. McNeil K. S., Knox D. P. & Proudfoot L. Anti-inflammatory responses and oxidative stress in Nippostrongylus brasiliensis-induced pulmonary inflammation. Parasite Immunol. 24, 15–22 (2002). - PubMed
    1. Anthony R. M., Rutitzky L. I., Urban J. F. Jr, Stadecker M.J. & Gause W. C. Protective immune mechanisms in helminth infection. Nat. Rev. Immunol. 7, 975–987 (2007). - PMC - PubMed
    1. Chen F. et al. An essential role for TH2-type responses in limiting acute tissue damage during experimental helminth infection. Nat. Med. 18, 260–266 (2012). - PMC - PubMed

Publication types

MeSH terms