. 2016 Jun 7:6:27541.
doi: 10.1038/srep27541.

Reversing diet-induced metabolic dysregulation by diet switching leads to altered hepatic de novo lipogenesis and glycerolipid synthesis

Affiliations

Reversing diet-induced metabolic dysregulation by diet switching leads to altered hepatic de novo lipogenesis and glycerolipid synthesis

Greg M Kowalski et al. Sci Rep. .

Abstract

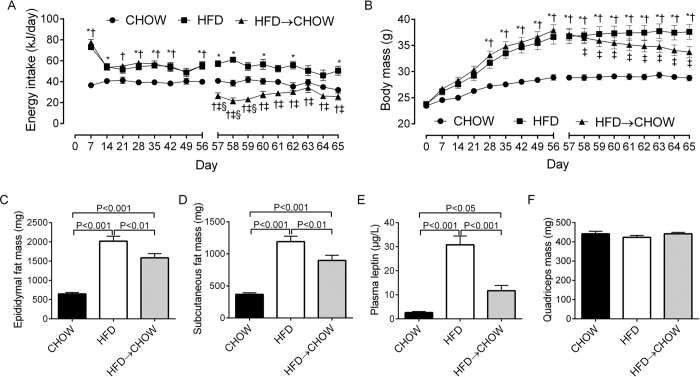
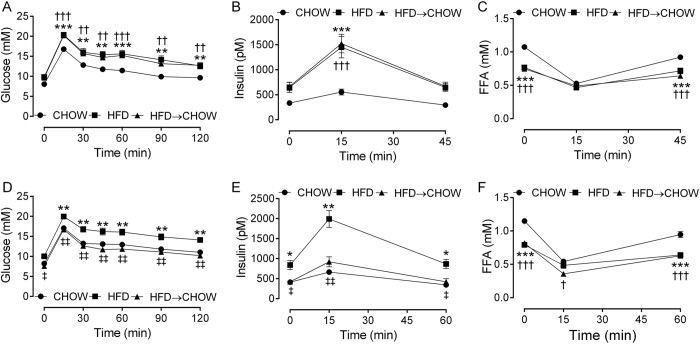
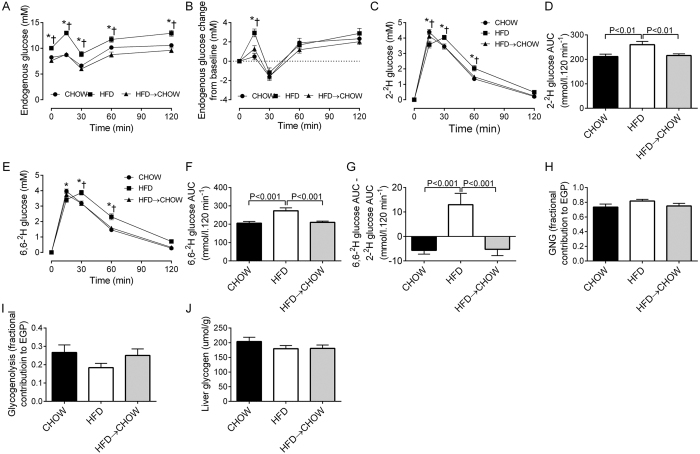
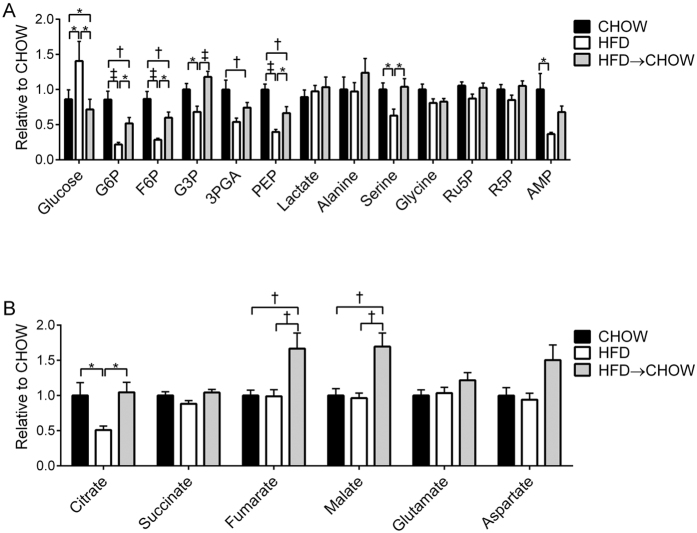
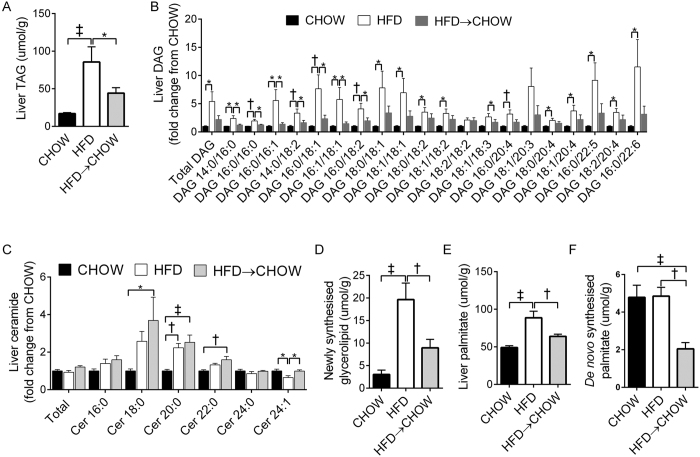
In humans, low-energy diets rapidly reduce hepatic fat and improve/normalise glycemic control. Due to difficulties in obtaining human liver, little is known about changes to the lipid species and pathway fluxes that occur under these conditions. Using a combination of stable isotope, and targeted metabolomic approaches we investigated the acute (7-9 days) hepatic effects of switching high-fat high-sucrose diet (HFD) fed obese mice back to a chow diet. Upon the switch, energy intake was reduced, resulting in reductions of fat mass and hepatic triacyl- and diacylglycerol. However, these parameters were still elevated compared to chow fed mice, thus representing an intermediate phenotype. Nonetheless, glucose intolerance and hyperinsulinemia were completely normalized. The diet reversal resulted in marked reductions in hepatic de novo lipogenesis when compared to the chow and HFD groups. Compared with HFD, glycerolipid synthesis was reduced in the reversal animals, however it remained elevated above that of chow controls, indicating that despite experiencing a net loss in lipid stores, the liver was still actively esterifying available fatty acids at rates higher than that in chow control mice. This effect likely promotes the re-esterification of excess free fatty acids released from the breakdown of adipose depots during the weight loss period.


Figures

Figure 1
Figure 1. Effects of diet on energy intake and body mass.
Energy intake (A), body mass (B), epididymal (C) and subcutaneous fat pad mass (D), plasma leptin levels (E) and quadriceps muscle mass (F). Data are mean ± SEM. N = 20 per group. *HFD vs. CHOW, P < 0.05; HFD → CHOW vs. CHOW, P < 0.05; HFD → CHOW significantly different to day 56, P < 0.05; §HFD vs. HFD → CHOW, P < 0.05.
Figure 2
Figure 2. Effects of diet on glucose tolerance.
Blood glucose (A), plasma insulin (B) and FFAs (C) during the OGTT performed 14 days prior to diet switch. Blood glucose (D), plasma insulin (E) and FFAs (F) during the stable isotope labelled OGTT performed 7 days after diet switch. Data are mean ± SEM. N = 20 per group. *HFD vs. CHOW, P < 0.05; **HFD vs. CHOW, P < 0.01; ***HFD vs. CHOW, P < 0.001; HFD → CHOW vs. CHOW, P < 0.05; ††HFD → CHOW vs. CHOW, P < 0.01; †††HFD → CHOW vs. CHOW, P < 0.001; HFD vs. HFD → CHOW, P < 0.05; ‡‡HFD vs. HFD → CHOW, P < 0.01.
Figure 3
Figure 3. Effects of diet on endogenous glucose, glucose disposal and sources of EGP.
Endogenous glucose levels (A), the pattern of endogenous glucose production (B), disposal of 2-2H glucose (C,D) and 6,6-2H glucose (E,F) and hepatic futile glucose cycling (G) during the stable isotope labelled OGTT. The fractional contribution of GNG (H), and glycogenolysis (I) to EGP and liver glycogen (J) following a 5 h fast. Data are mean ± SEM. N = 20 per group. *HFD vs. CHOW, P < 0.05; HFD → CHOW vs. CHOW, P < 0.05.
Figure 4
Figure 4. Metabolomic profiling of liver.
Glycolytic (A) and TCA cycle (B) metabolites. Data are mean ± SEM. N = 10 per group *P < 0.05; P < 0.01; P < 0.001 for specified comparisons.
Figure 5
Figure 5. Effects of diet on hepatic lipid metabolism.
Liver TAG (A), DAG (B) and ceramide (C) levels as well as the newly synthesized glycerolipid (D), total palmitate concentration (E) and de novo synthesized palmitate (F). Data are mean ± SEM. Figure A. N = 20, Figs B-F N = 10/group. *P < 0.05; P < 0.01; P < 0.001 for specified comparisons. TAG, triacylglycerol; DAG, diacylglycerol; Cer, ceramide.

References

    1. Hu F. B. Globalization of diabetes: the role of diet, lifestyle, and genes. Diabetes Care 34, 1249–1257, doi: 10.2337/dc11-0442 (2011). - DOI - PMC - PubMed
    1. Kowalski G. M. & Bruce C. R. The regulation of glucose metabolism: implications and considerations for the assessment of glucose homeostasis in rodents. Am J Physiol Endocrinol Metab 307, E859–E871, doi: 10.1152/ajpendo.00165.2014 (2014). - DOI - PubMed
    1. Brons C. et al. Impact of short-term high-fat feeding on glucose and insulin metabolism in young healthy men. J Physiol 587, 2387–2397, doi: 10.1113/jphysiol.2009.169078 (2009). - DOI - PMC - PubMed
    1. Clore J. N., Helm S. T. & Blackard W. G. Loss of hepatic autoregulation after carbohydrate overfeeding in normal man. J Clin Invest 96, 1967–1972, doi: 10.1172/JCI118243 (1995). - DOI - PMC - PubMed
    1. Cornier M. A., Bergman B. C. & Bessesen D. H. The effects of short-term overfeeding on insulin action in lean and reduced-obese individuals. Metabolism: clinical and experimental 55, 1207–1214, doi: 10.1016/j.metabol.2006.05.003 (2006). - DOI - PubMed

Publication types