. 2016 Jul;19(7):926-934.
doi: 10.1038/nn.4319. Epub 2016 Jun 6.

SHANK3 controls maturation of social reward circuits in the VTA

Affiliations

SHANK3 controls maturation of social reward circuits in the VTA

Sebastiano Bariselli et al. Nat Neurosci. 2016 Jul.

Abstract

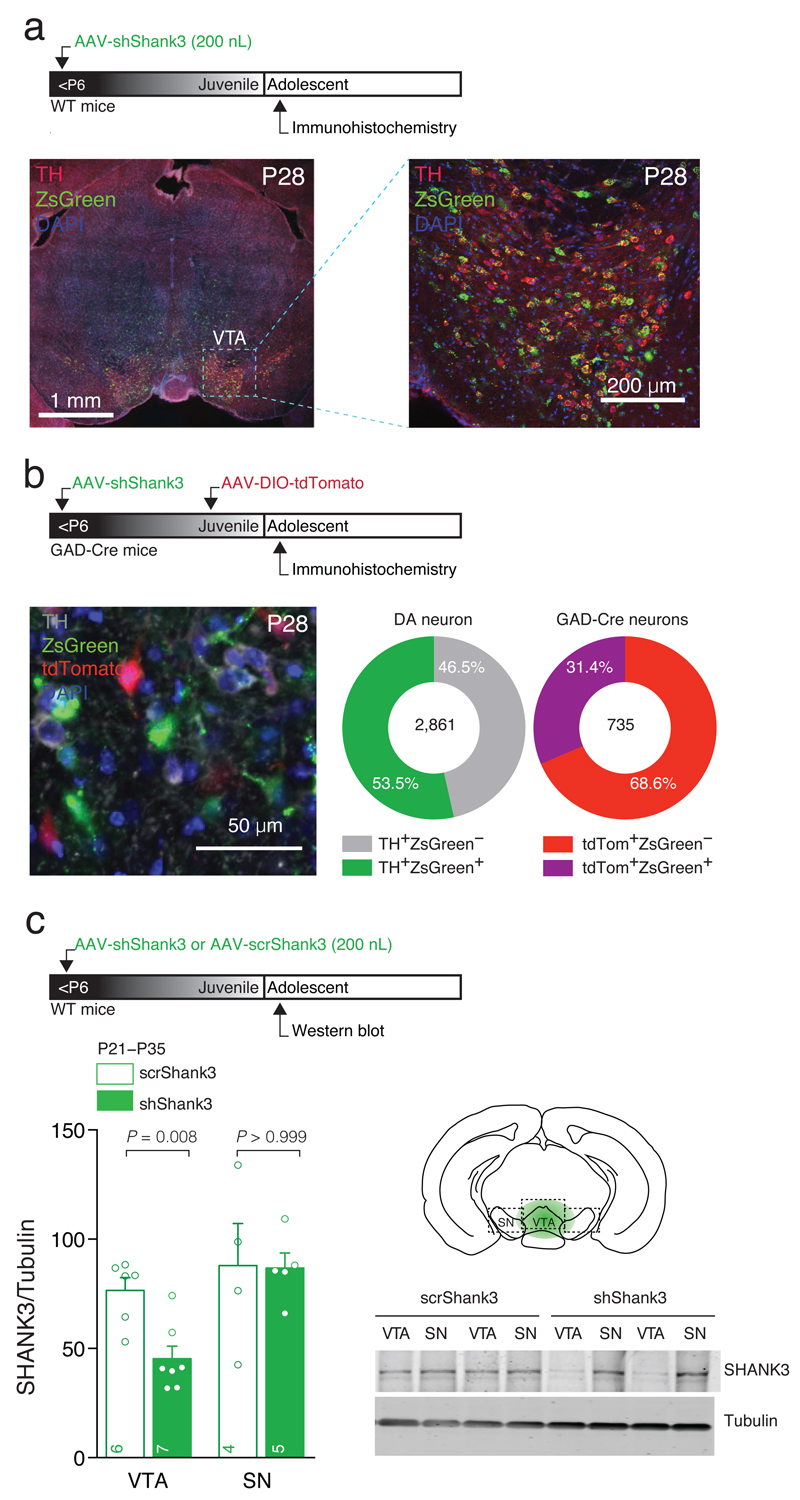
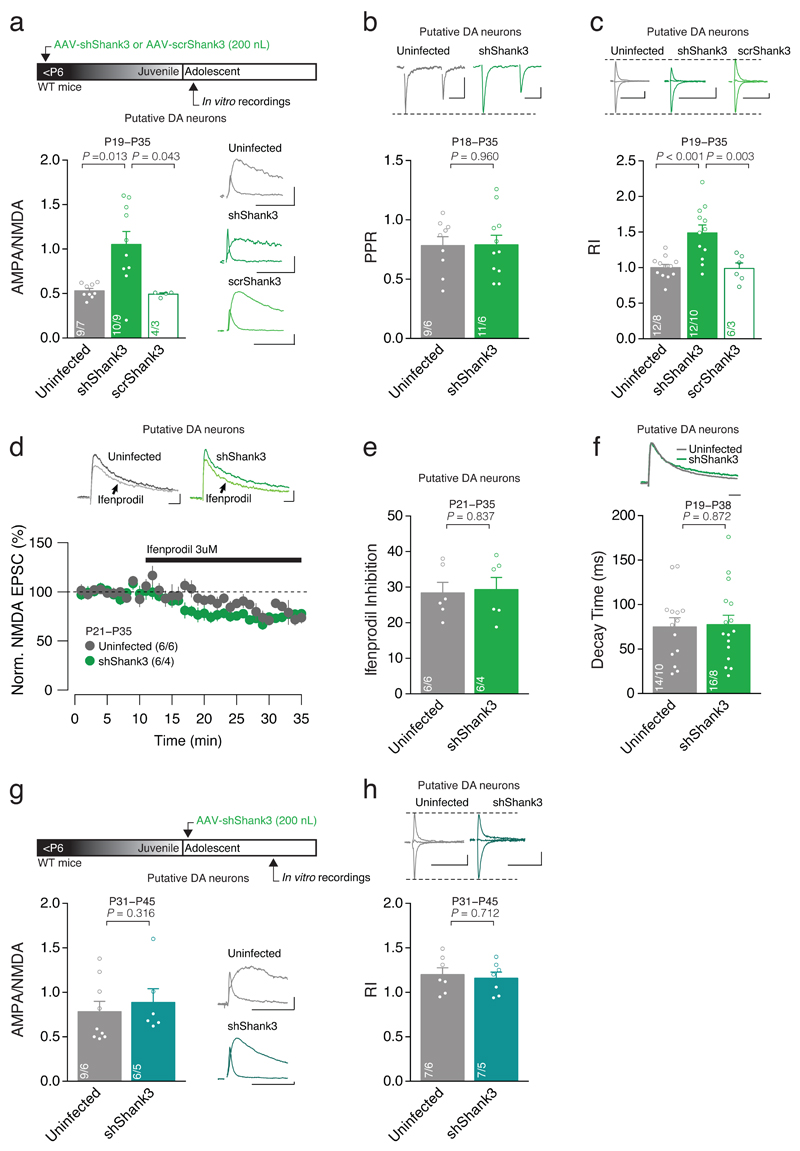
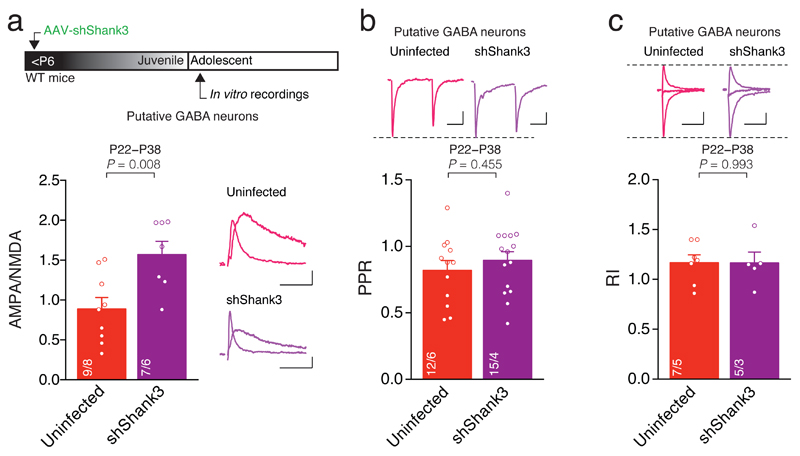
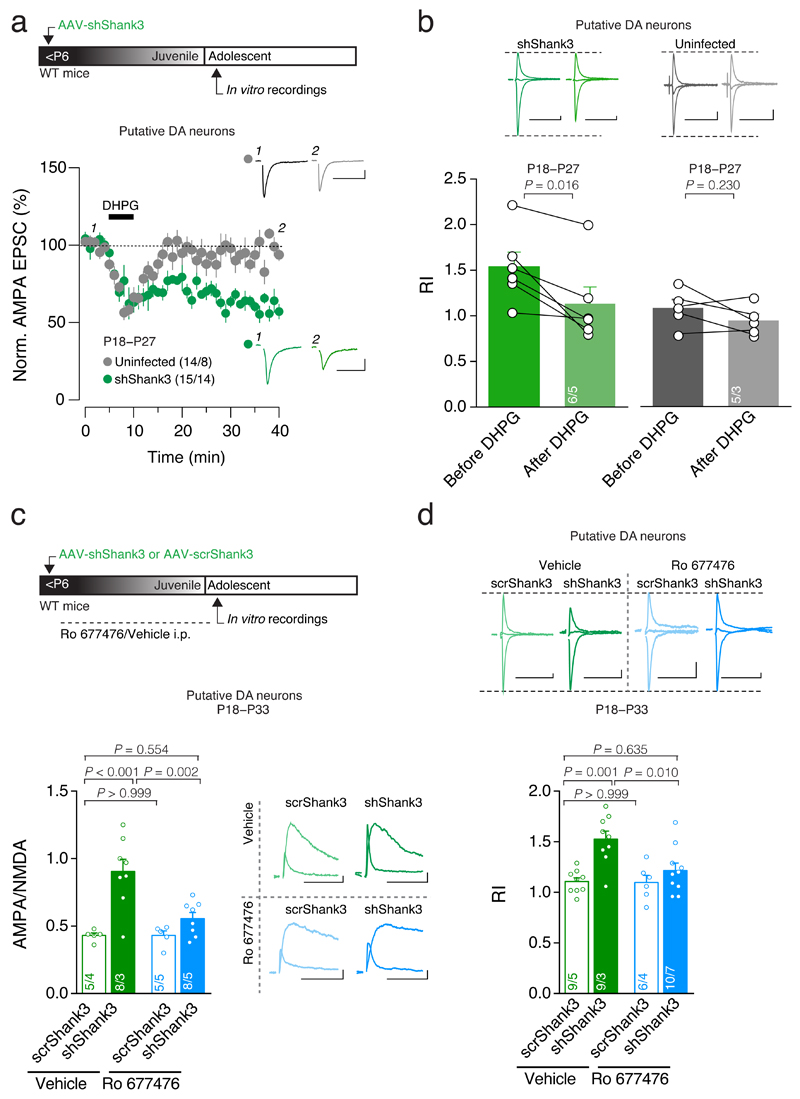
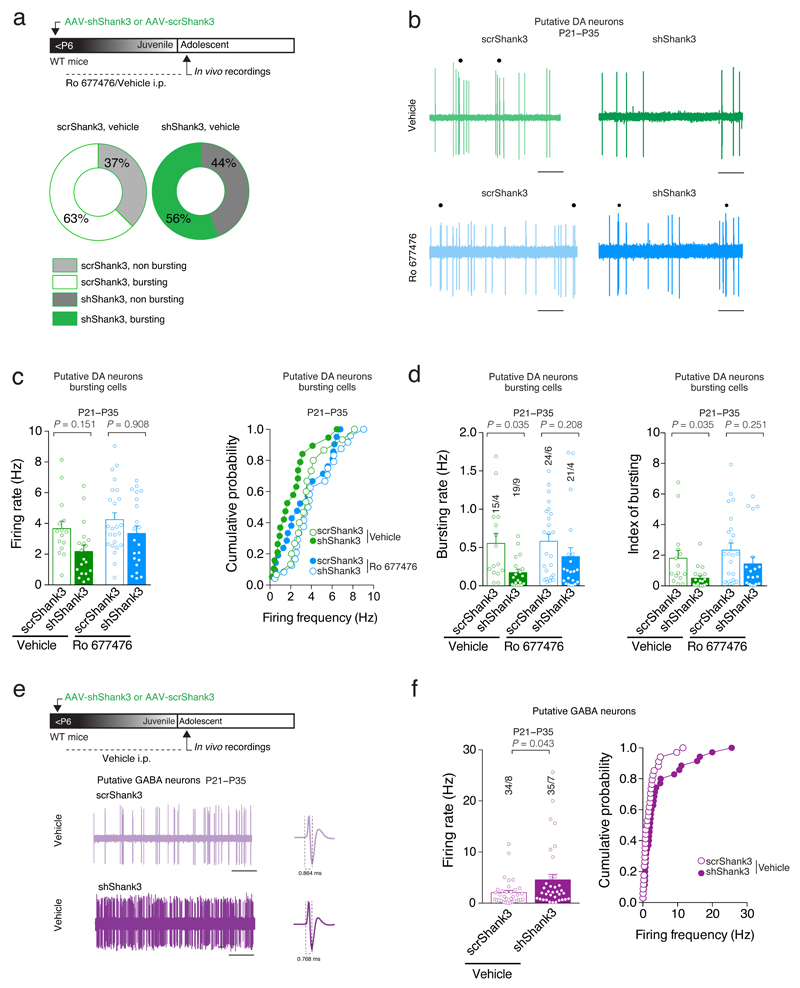
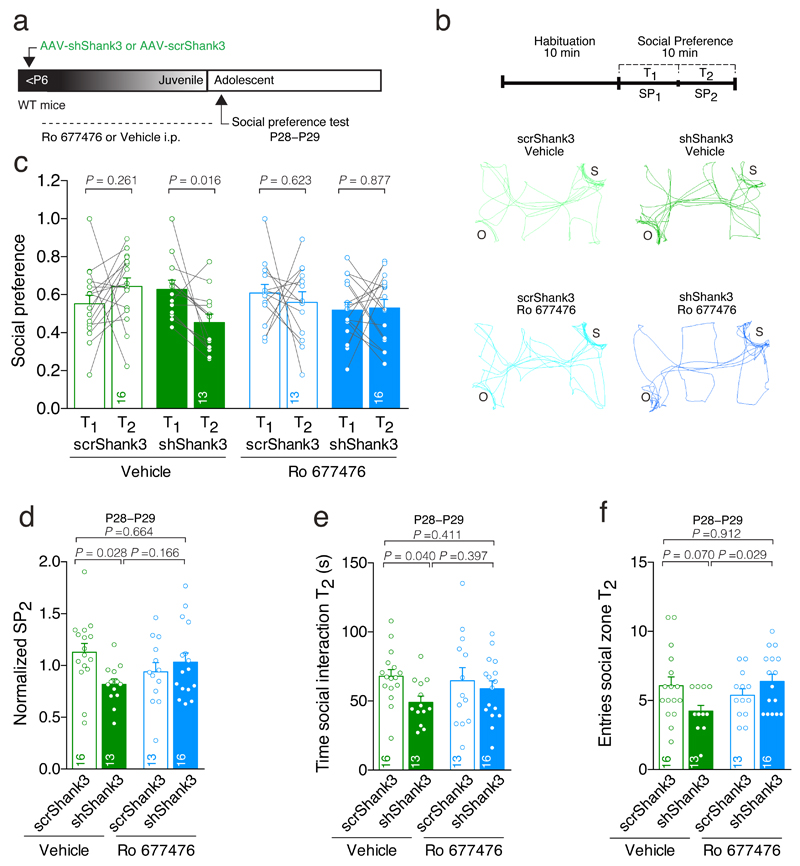
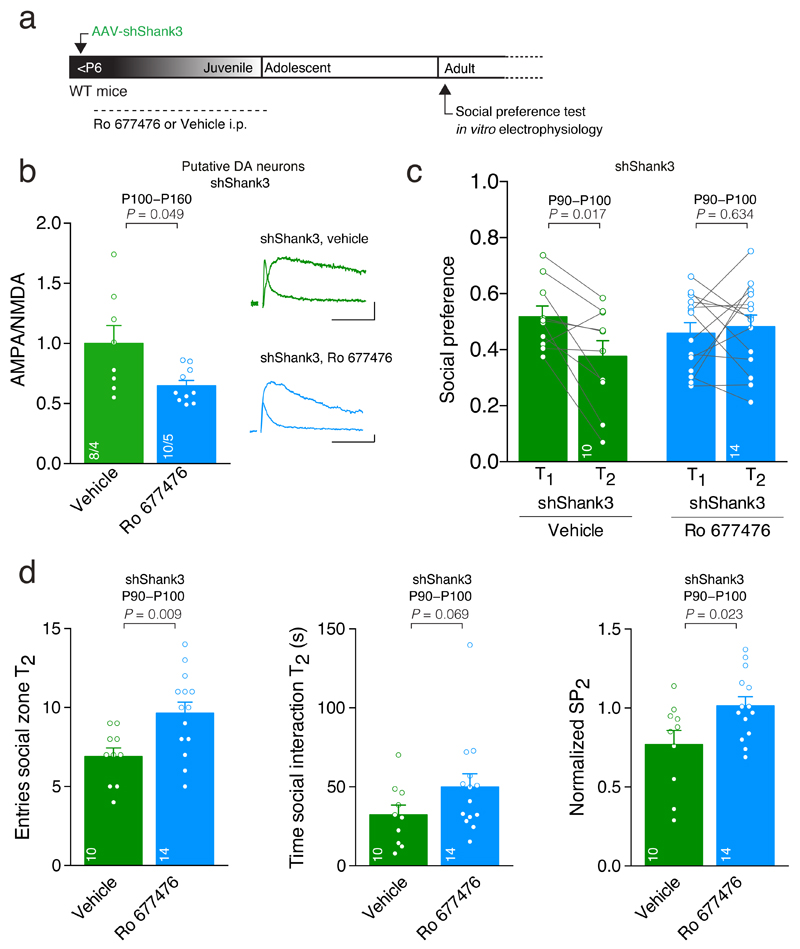
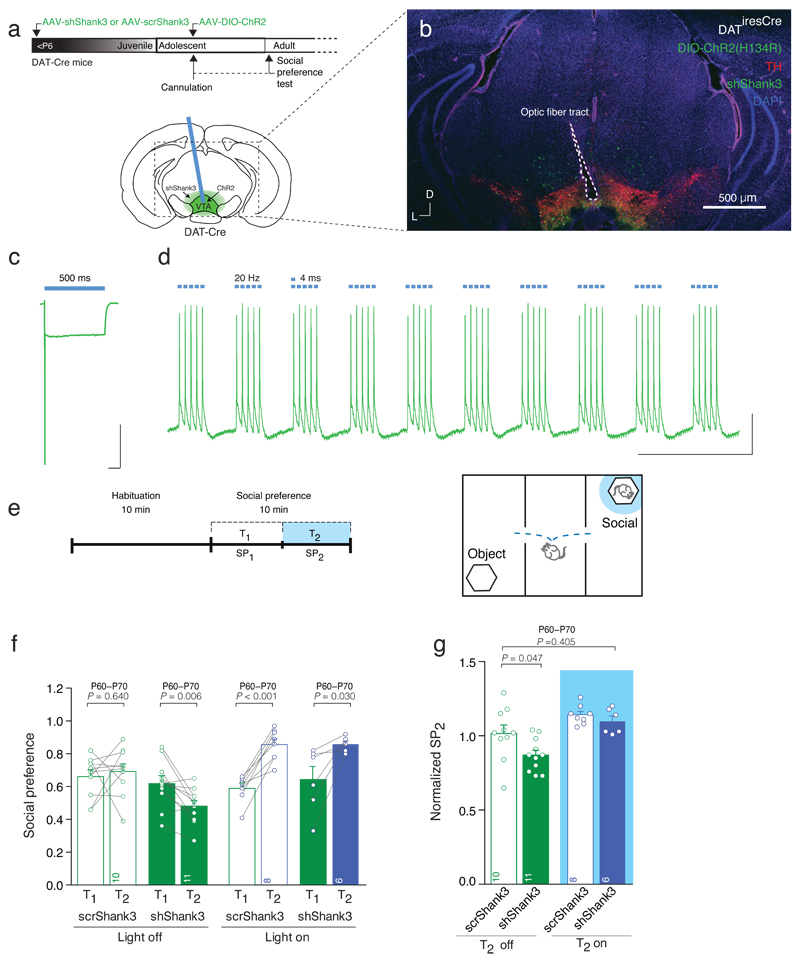
Haploinsufficiency of SHANK3, encoding the synapse scaffolding protein SHANK3, leads to a highly penetrant form of autism spectrum disorder. How SHANK3 insufficiency affects specific neural circuits and how this is related to specific symptoms remains elusive. Here we used shRNA to model Shank3 insufficiency in the ventral tegmental area of mice. We identified dopamine (DA) and GABA cell-type-specific changes in excitatory synapse transmission that converge to reduce DA neuron activity and generate behavioral deficits, including impaired social preference. Administration of a positive allosteric modulator of the type 1 metabotropic glutamate receptors mGluR1 during the first postnatal week restored DA neuron excitatory synapse transmission and partially rescued the social preference defects, while optogenetic DA neuron stimulation was sufficient to enhance social preference. Collectively, these data reveal the contribution of impaired ventral tegmental area function to social behaviors and identify mGluR1 modulation during postnatal development as a potential treatment strategy.


Figures

Fig. 1
Fig. 1. Neonatal AAV-shShank3 infections target VTA DA and GABA neurons.
(a) Top: experiment schematic. Left: representative confocal image of coronal slice obtained from shShank3 infected WT mouse containing the VTA. Right: high magnification of VTA slice (b) Top: experiment schematic. Left: representative image of staining in GAD-Cre mice infected with shShank3 and DIO-tdTomato, identifying GABA neurons. Right: quantification of viral infection for DA and infected GAD-Cre VTA neurons (for details see Materials and Methods). (c) Top: Experiment schematic. Western blot quantification of SHANK3 downregulation in VTA and SN for scrShank3 and shShank3 injected WT mice (VTA: Mann-Whitney U = 3; SN: Mann-Whitney U = 10). The numbers indicate the number of animals. Right: example of SHANK3 expression in scrShank3 or shShank3 VTA and SN.
Fig. 2
Fig. 2. Shank3 downregulation alters the postnatal development of AMPAR-mediated transmission.
(a) Top: experiment schematic. Group mean AMPA/NMDA ratio calculated in Uninfected, shShank3 and scrShank3 infected Putative DA neurons (Kruskal-Wallis K2 = 10.47, p = 0.005, followed by Dunn’s post hoc test). Right: example traces of evoked AMPAR- and NMDAR-EPSCs recorded at +40 mV. (b) Top: example traces of AMPAR-EPSC at -60 mV. Group mean PPR for shShank3 infected and Uninfected cells (t18 = 0.05, unpaired t-test). (c) Top: example traces of evoked AMPAR-EPSCs recorded at -60, 0 and +40 mV. Group mean RI calculated in Uninfected, shShank3 and scrShank3 infected Putative DA neurons (one-way ANOVA F2,27 = 11.66, p < 0.001, followed by Tukey HSD post-hoc test). (d) Top: example traces of NMDAR-EPSCs during Ifenprodil (3 μM) bath application. Time course of NMDAR-EPSC amplitude during Ifenprodil application for Uninfected and shShank3 infected Putative DA neurons. (e) Group mean Ifenprodil inhibition calculated in Uninfected and shShank3 infected Putative DA neurons (t10 = -0.21, unpaired t-test). (f) Top: example traces of NMDAR-EPSC at +40 mV. Group mean decay time of NMDAR-EPSCs (t28 = -0.16, unpaired t-test). (g) Top: experiment schematic. Group mean AMPA/NMDA ratio calculated in Uninfected and shShank3 infected neurons (U = 18.50, Mann-Whitney test). Right: example traces of evoked AMPAR- and NMDAR- EPSCs recorded at +40 mV. (h) Group mean RI calculated in Uninfected and shShank3 infected Putative DA neurons (t12 = 0.38, unpaired t-test). Top: example traces of evoked AMPAR-EPSCs recorded at -60, 0 and +40 mV. Error bars show SEM. Example trace scale bar: 20 msec, 20 pA. The numbers indicate cells and mice.
Fig. 3
Fig. 3. Shank3 downregulation affects excitatory transmission onto VTA GABA neurons
(a) Top: experiment schematic. Group mean AMPA/NMDA ratio calculated in Uninfected and shShank3 infected Putative GABA neurons (t14 = -3.11, unpaired t-test). Right: example traces of evoked AMPAR- and NMDAR-EPSCs recorded at +40 mV. (b) Group mean PPR for Uninfected and shShank3 infected Putative GABA neurons (t25 = -0.76, unpaired t-test). Top: example traces of AMPAR-EPSC at -60 mV for Uninfected and shShank3 infected Putative GABA neurons. (c) Group mean RI calculated in Uninfected and shShank3 infected Putative GABA neurons (t10 = 0.01, unpaired t-test). Top: example traces of evoked AMPAR-EPSCs recorded at -60, 0 and +40 mV. Example trace scale bar: 20 msec, 20 pA. The numbers indicate cells and mice.
Fig. 4
Fig. 4. Stimulation of mGluR1 rescues synaptic deficits
(a) Top: experiment schematic. Time course of pharmacologically isolated AMPAR-EPSCs recorded at -60 mV from Uninfected and shShank3 infected Putative DA neurons before and after 5 min application of DHPG (20uM). Inset: example traces of evoked AMPAR-EPSCs recorded at -60 mV. (b) Top: example traces of evoked AMPAR-EPSCs recorded at -60, 0 and +40 mV before and after DHPG application. Group mean RI before and 25 minutes after DHPG application (shShank3: t5 = 3.60; Uninfected: t4 = 1.42, paired t-test). (c) Top: experiment schematic. Group mean AMPA/NMDA ratio (two-way ANOVA; virus × drug interaction: F1,22 = 6.41, p = 0.019; main effect virus: F1,22 = 20.54, p < 0.001 ; main effect drug: F1,22 = 7.02, p = 0.015; followed by Tukey HSD post-hoc test). Right: example traces of evoked AMPAR- and NMDAR-EPSCs recorded at +40 mV. (d) Top: example traces of evoked AMPAR-EPSCs recorded at -60, 0, +40 mV. Group mean RI (two-way ANOVA; virus × drug interaction: F1,30 = 4.62, p = 0.040; main effect virus: F1,30 = 14.93, p = 0.001 ; main effect drug: F1,30 = 5.26, p = 0.029; followed by Tukey HSD post-hoc test). Error bars show SEM. Example trace scale bar: 20 msec, 20 pA. The numbers indicate cells and mice.
Fig. 5
Fig. 5. VTA-Shank3 insufficiency alters in vivo DA neuron activity
(a) Top: experiment schematic. Quantification of bursting and non bursting VTA Putative DA neurons from scrShank3 or shShank3 vehicle treated mice. (b) Representative traces of a VTA Putative DA neuron recorded in vivo. Each dot represents a burst event. Scale bar: 1 s. (c) Group mean ± SEM and cumulative probability distribution of the firing rate of VTA Putative DA bursting cells (Kruskal-Wallis K3 = 10.85, p = 0.013, followed by Dunn’s post hoc test). (d) Effect of mGluR1-PAM (Ro 677476) treatment on bursting activity of VTA Putative DA neuron (for bursting rate: Kruskal-Wallis K3 = 14.09, p = 0.003, followed by Dunn’s post hoc test; for index of bursting: Kruskal-Wallis K3 = 14.62, p = 0.002, followed by Dunn’s post hoc test). (e) Top: experiment schematic. Representative traces of VTA Putative GABA neurons recorded in vivo. Scale bar: 10s. (f) Group mean ± SEM (U= 425.5, Mann-Whitney test) and cumulative probability distribution of the firing rate of VTA Putative GABA neurons. The numbers indicate cells and mice.
Fig. 6
Fig. 6. VTA-SHANK3 insufficiency induces social deficits that are reversed by PAM-mGluR1 treatment.
(a) Experiment schematic. (b) Activity trail plots and experiment schematic (S: social target; O: inanimate object). (c) Scatter plots and group mean of social preference during the first half (T1) and second half (T2) of the 10 min test (Repeated measures (RM) two-way ANOVA; time × drug × virus interaction F1,54 = 4.48, p = 0.039; main effect virus F1,54 = 4.99, p = 0.030 followed by RM ANOVA within subjects. Main effect time: scrShank3 vehicle: F1,15 = 1.36; shShank3 vehicle: F1,12 = 7.87; scrShank3 Ro: F1,12 = 0.26; shShank3 Ro: F1,15 = 0.03). (d) Bar graph of social preference during T2, over the total social preference (Normalized SP2) (two-way ANOVA; virus × drug interaction: F1,54 = 5.98, p = 0.018; main effect virus: F1,54 = 1.73, p = 0.194 ; main effect drug: F1,54 = 0.03, p = 0.875; followed by Tukey HSD post-hoc test). (e) Time of social interaction during T2 (two-way ANOVA; virus × drug interaction: F1,54 = 1.07, p = 0.305; main effect virus: F1,54 = 3.84, p = 0.055; main effect drug: F1,54 = 0.27, p = 0.606; followed by Tukey HSD post-hoc test). (f) Number of entries during T2 (two-way ANOVA; virus × drug interaction: F1,54 = 6.76, p = 0.012; main effect virus: F1,54 = 0.60, p = 0.442; main effect drug: F1,54 = 1.83, p = 0.182; followed by Tukey HSD post-hoc test). The numbers indicate mice.
Fig. 7
Fig. 7. Synaptic and social deficits persist into adulthood and are reversed by treatment with PAM-mGluR1 during the critical period.
(a) Experiment schematic. (b) Top: example traces of evoked AMPAR- and NMDAR-EPSCs recorded at +40 mV. Group mean AMPA/NMDA ratio calculated in shShank3 infected mice injected with vehicle or mGluR1-PAM Ro 677476 (t8.33 = 2.30, unpaired t-test). The numbers indicate cells and mice. Scale bar: 20pA, 20ms. (c) Scatter plots and group mean representing the social preference during T1 and T2 (RM ANOVA; time × group interaction: F1,22 = 5.56, p = 0.028, main effect group F1,22 = 0.22, p = 0.644 followed by RM ANOVA within subjects. Main effect time: shShank3 vehicle: F1,9 = 8.58; shShank3 Ro: F1,13 = 0.24). (d) Group mean entries around the social enclosure, time spent sniffing the stimulus mouse during T2 and normalized social preference at T2 for shShank3 mice treated with vehicle or Ro 677476 (entries: t22 = -2.88, unpaired t-test; time: U = 39.00, Mann-Whitney test; Normalized SP2: t22 = - 2.44, unpaired t-test). The numbers indicate mice. Error bars show SEM.
Fig. 8
Fig. 8. Optical stimulation of VTA DA neurons increases social preference.
(a) Schematic of the experimental design, injection site and cannula placement. (b) Representative image of cannula placement and injection site of the AAV-shShank3 and AAV-DIO-ChR2 in the VTA. Scale bar: 500μm. (c) Whole cell patch clamp recording of ChR2 infected VTA DA neuron, showing desensitizing photocurrent in response to 500 ms blue light. Scale bar: 100 ms, 1nA. (d) In vitro validation of 20 Hz blue light stimulation protocol. Scale bar: 1 s, 10mV. (e) Experiment schematic. Optical stimulation was applied during the second 5 min of the test (T2), only when animals were in proximity to the enclosure containing the stimulus mouse. (f) Scatter plots and group mean of social preference for each condition (Repeated measures (RM) two-way ANOVA; time × drug × virus interaction F1,31 = 1.11, p = 0.300; light stimulation × virus interaction F1,31 = 5.52, p = 0.025; main effect virus F1,31 = 2.28, p = 0.141; main effect of light stimulation F1,31 = 14.17, p = 0.001; followed by RM ANOVA within subjects. Main effect time: scrShank3 off: F1,9 = 0.23; shShank3 off: F1,10 = 11.77; scrShank3 on: F1,7 = 55.14; shShank3 on: F1,5 = 9.03). (g) Group mean normalized social preference SP2 (two-way ANOVA; virus × light stimulation interaction: F1,31 = 1.28, p = 0.267; main effect virus: F1,31 = 4.70, p = 0.038 ; main effect light stimulation: F1,31 = 16.93, p < 0.001; followed by Dunnett post-hoc test). The numbers indicate mice.

Comment in

References

    1. Volkmar FR, State M, Klin A. Autism and autism spectrum disorders: diagnostic issues for the coming decade. Journal of Child Psychology and Psychiatry. 2009;50:108–115. - PubMed
    1. Landa RJ. Diagnosis of autism spectrum disorders in the first 3 years of life. Nat Clin Pract Neurol. 2008;4:138–147. - PubMed
    1. Ameis SH, Catani M. Altered white matter connectivity as a neural substrate for social impairment in Autism Spectrum Disorder. Cortex. 2015;62:158–181. - PubMed
    1. Wood J, Ahmari SE. A Framework for Understanding the Emerging Role of Corticolimbic-Ventral Striatal Networks in OCD-Associated Repetitive Behaviors. Front Syst Neurosci. 2015;9:171. - PMC - PubMed
    1. Zeeland AAS-V, Dapretto M, Ghahremani DG, Poldrack RA, Bookheimer SY. Reward Processing in Autism. Autism research : official journal of the International Society for Autism Research. 2010;3:53–n/a. - PMC - PubMed

MeSH terms

LinkOut - more resources