. 2016 Sep;33(9):2273-84.
doi: 10.1093/molbev/msw099. Epub 2016 Jun 7.

Small Traditional Human Communities Sustain Genomic Diversity over Microgeographic Scales despite Linguistic Isolation

Affiliations

Small Traditional Human Communities Sustain Genomic Diversity over Microgeographic Scales despite Linguistic Isolation

Murray P Cox et al. Mol Biol Evol. 2016 Sep.

Abstract

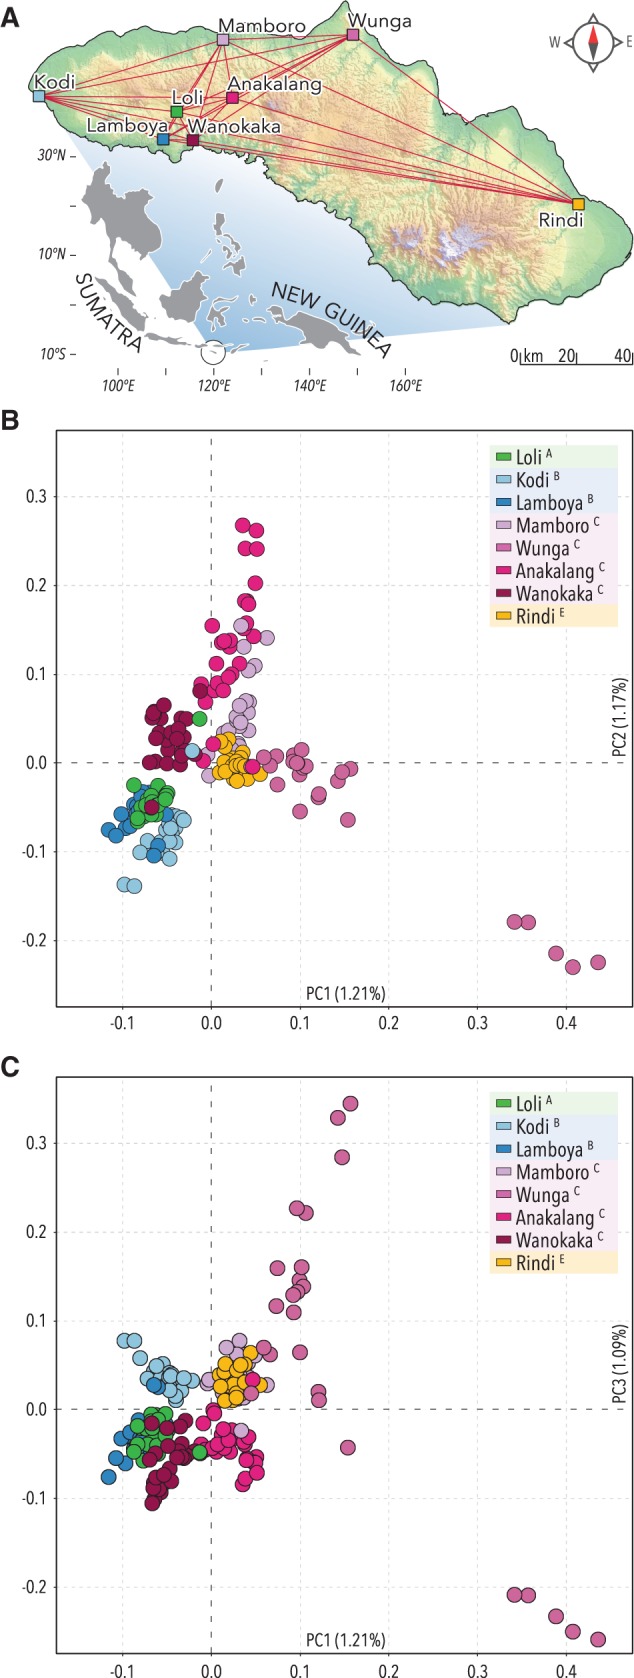
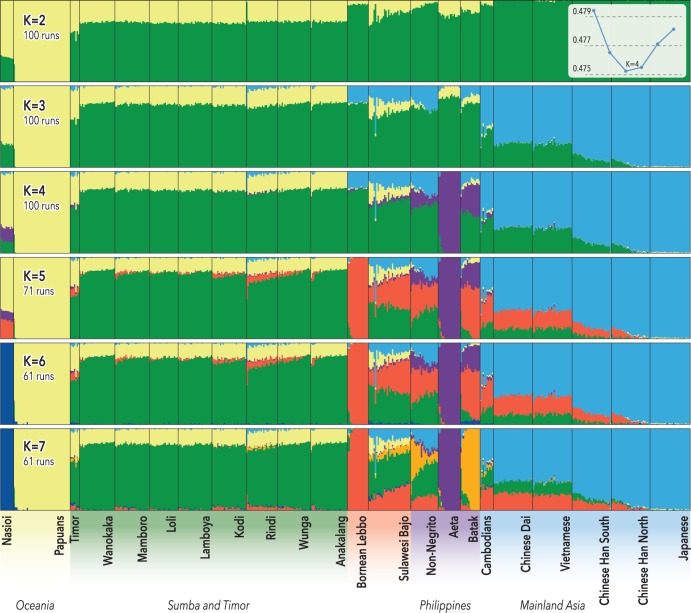
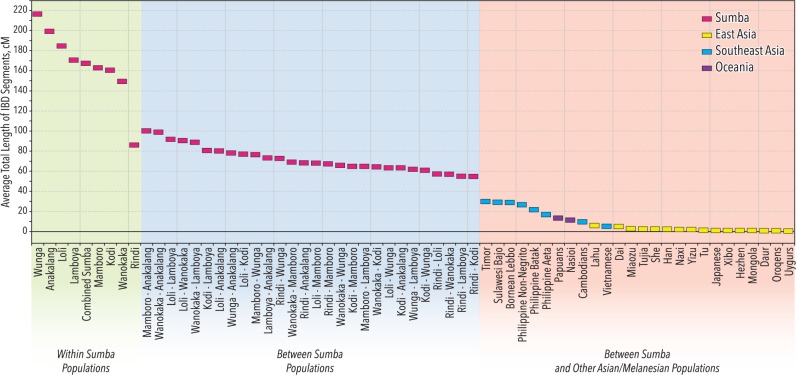
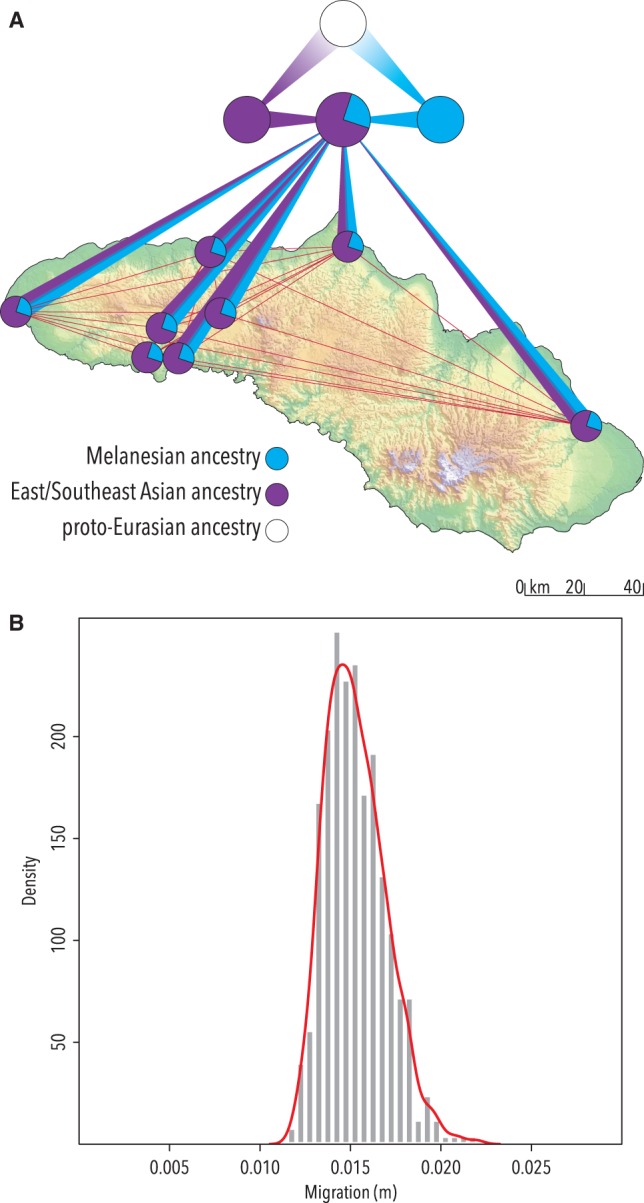
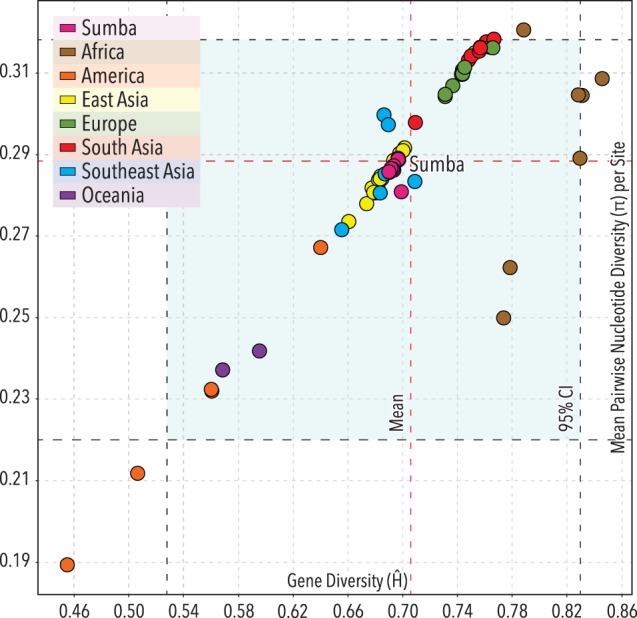
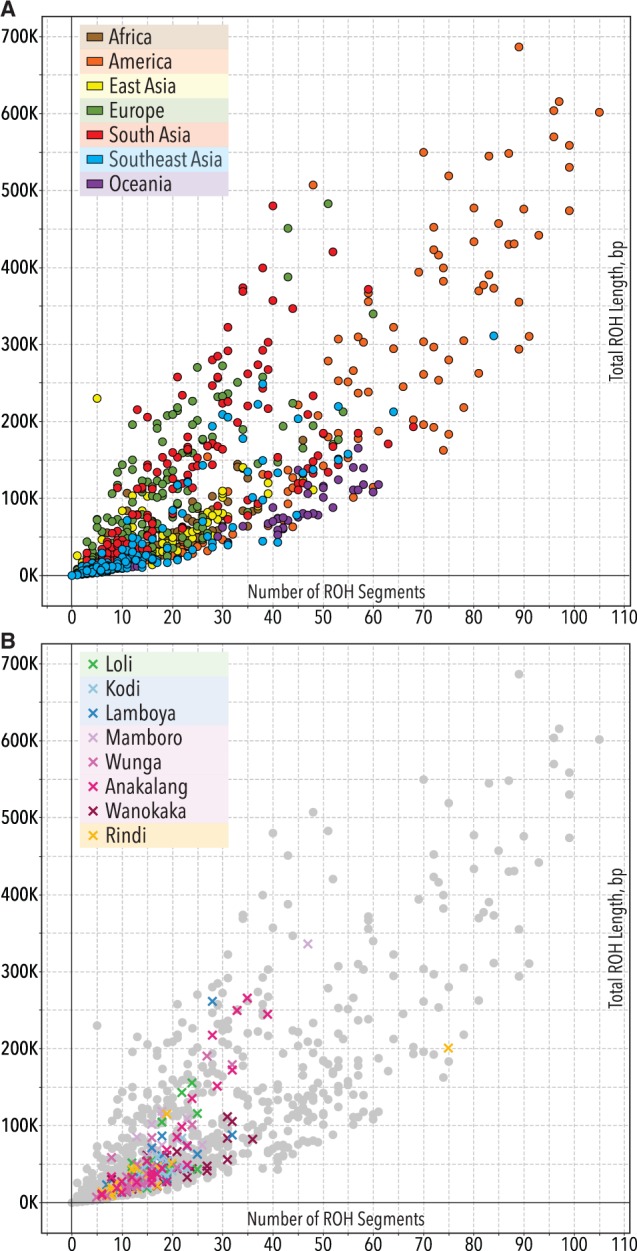
At least since the Neolithic, humans have largely lived in networks of small, traditional communities. Often socially isolated, these groups evolved distinct languages and cultures over microgeographic scales of just tens of kilometers. Population genetic theory tells us that genetic drift should act quickly in such isolated groups, thus raising the question: do networks of small human communities maintain levels of genetic diversity over microgeographic scales? This question can no longer be asked in most parts of the world, which have been heavily impacted by historical events that make traditional society structures the exception. However, such studies remain possible in parts of Island Southeast Asia and Oceania, where traditional ways of life are still practiced. We captured genome-wide genetic data, together with linguistic records, for a case-study system-eight villages distributed across Sumba, a small, remote island in eastern Indonesia. More than 4,000 years after these communities were established during the Neolithic period, most speak different languages and can be distinguished genetically. Yet their nuclear diversity is not reduced, instead being comparable to other, even much larger, regional groups. Modeling reveals a separation of time scales: while languages and culture can evolve quickly, creating social barriers, sporadic migration averaged over many generations is sufficient to keep villages linked genetically. This loosely-connected network structure, once the global norm and still extant on Sumba today, provides a living proxy to explore fine-scale genome dynamics in the sort of small traditional communities within which the most recent episodes of human evolution occurred.

Keywords: gene flow; genetic diversity; linguistic diversity; population structure..


Figures

Fig. 1.
Fig. 1.
(A) Locations of the eight communities sampled on Sumba in eastern Indonesia. Lines indicate the 28 pairwise community comparisons used throughout the study. (B, C) PCA of genome-wide SNP diversity in 204 individuals from the eight communities. Axes are scaled by the proportion of variance described by the corresponding principal component (PC): PC1 versus PC2 in (B), and PC1 versus PC3 in (C). As noted in the legend, colors indicate related language communities, as per Lansing et al. (2007): group A, Loli (green); group B, Kodi and Lamboya (blue shades); group C, Anakalang, Mamboro, Wanokaka and Wunga (red shades); and group E, Rindi (yellow). Note genetic discrimination at the level of individuals and villages, as well as recent migrants between communities, such as the Wanokaka individual (maroon) with recent ancestry from Lamboya or Loli (dark blue and green, respectively) in (B).
Fig. 2.
Fig. 2.
Ancestral genomic components in Sumba relative to other regional populations. For every K, the modal solution with the highest number of ADMIXTURE runs is shown; individual ancestry proportions were averaged across all runs from the same mode and the number of runs (out of 100) assigned to the presented solution is shown. Note that ancestry components are largely shared across all eight Sumba communities, but differ from regional neighbors. Average cross validation statistics were calculated across all runs from the same mode and are minimized for four ancestry components in this dataset (inset).
Fig. 3.
Fig. 3.
Extent of long-range IBD regions (>1 cM) between individuals within each Sumba community (green background), between communities on Sumba (blue background), and between Sumba and other regional populations (red background). Data points for individual populations are color-coded according to the legend.
Fig. 4.
Fig. 4.
(A) Genome-scale structured coalescent model for the demographic history of Sumba. An ancestral Eurasian population (white) diverges into Asian (purple) and Melanesian (blue) ancestral groups, which subsequently merge to form an admixed population on Sumba during the Neolithic farming expansion. This founding population radiates to establish the eight sampled communities, which continue to exchange migrants to the present (red lines). (B) Posterior distribution of the mean migration rate m inferred across all 28 community pairs on Sumba with a final uniform prior from 0 to 0.03. The red line shows a density curve overlaid on the histogram using a Gaussian smoothing kernel.
Fig. 5.
Fig. 5.
Average pairwise nucleotide diversity (π) and gene diversity (Ĥ) for Sumba (magenta) and a global range of reference populations. The mean values (dashed red lines) and 95% confidence intervals (shaded area) are calculated from all populations except Sumba.
Fig. 6.
Fig. 6.
(A) ROH within individuals for a global range of reference populations. (B) ROH within individuals from Sumba. The number of homozygous runs is shown on the x-axis; the total length of the genome contained in homozygous runs is shown on the y-axis. Note that both measures observed for individuals on Sumba overlap with regional and global populations (grey circles) and show no evidence of community-level structuring within Sumba.

Similar articles

Cited by

References

    1. 1000 Genomes Project Consortium 2010. A map of human genome variation from population-scale sequencing. Nature 467:1061–1073. - PMC - PubMed
    1. 1000 Genomes Project Consortium 2012. An integrated map of genetic variation from 1,092 human genomes. Nature 491:56–65. - PMC - PubMed
    1. 1000 Genomes Project Consortium 2015. A global reference for human genetic variation. Nature 526:68–74. - PMC - PubMed
    1. Alexander DH, Novembre J, Lange K. 2009. Fast model-based estimation of ancestry in unrelated individuals. Genome Res. 19:1655–1664. - PMC - PubMed
    1. Badan Pusat Statistik. 2010. Sensus Penduduk 2010. [cited 2016 May 20]. Available from: http://sp2010.bps.go.id