Meta-Analysis
. 2016 Jul 5;113(27):7329-36.
doi: 10.1073/pnas.1510502113. Epub 2016 Jun 6.

Characterizing treatment pathways at scale using the OHDSI network

Affiliations
Meta-Analysis

Characterizing treatment pathways at scale using the OHDSI network

George Hripcsak et al. Proc Natl Acad Sci U S A. .

Abstract

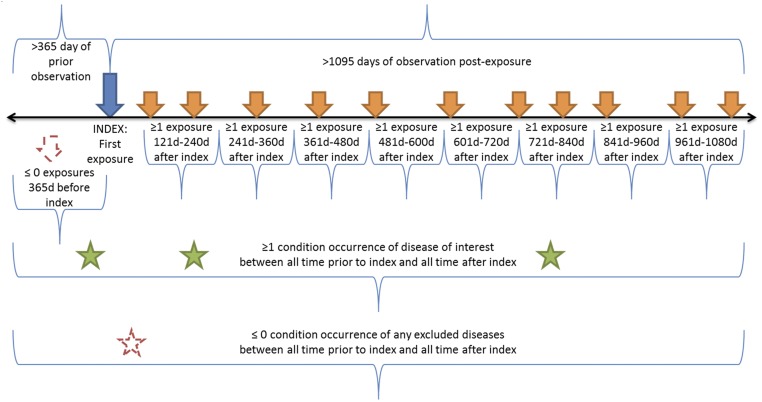
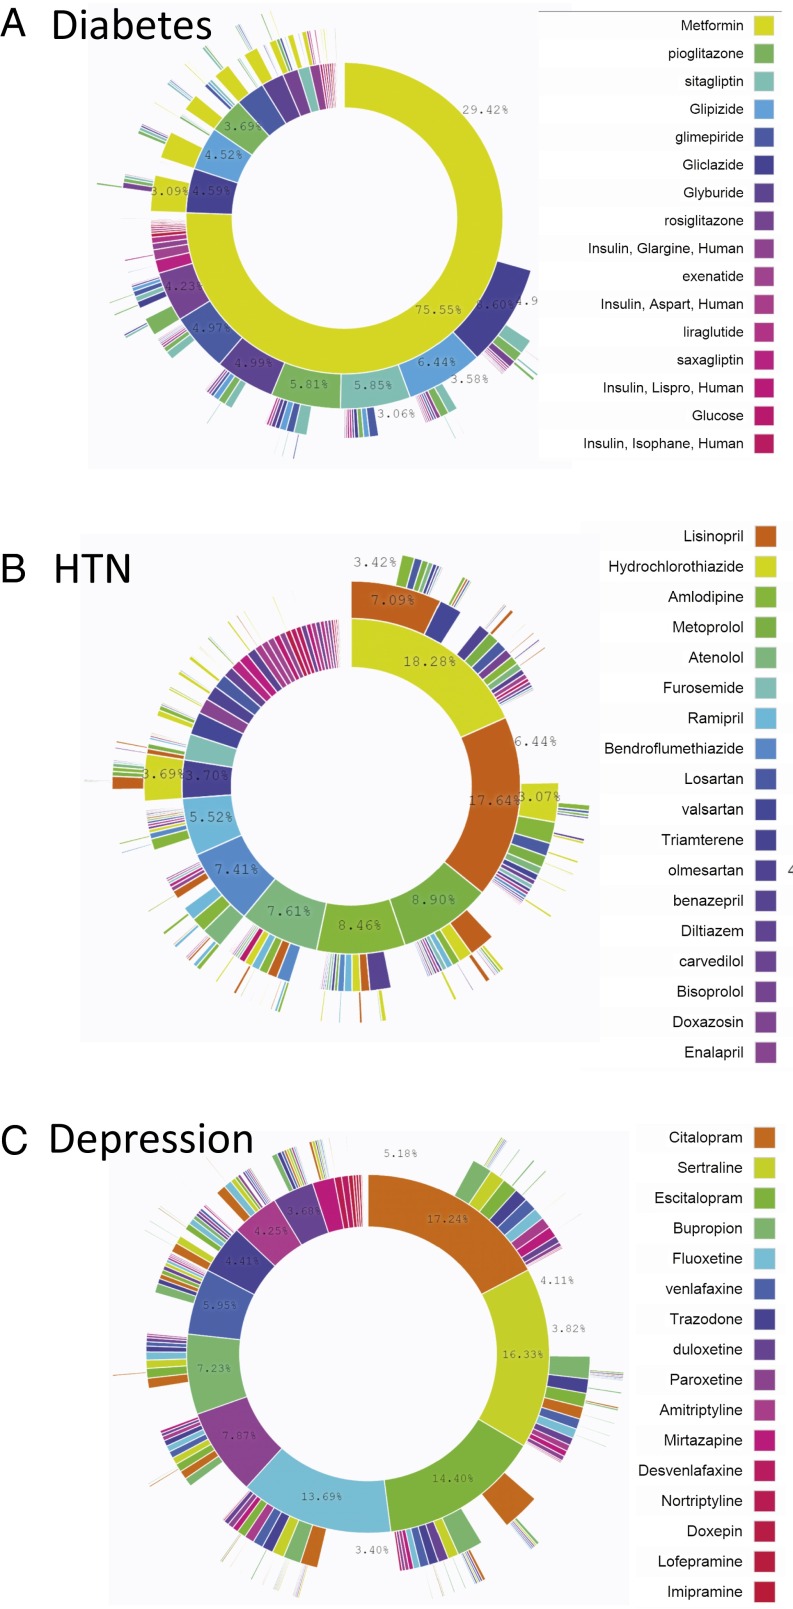
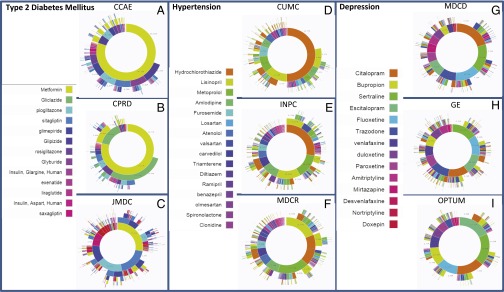
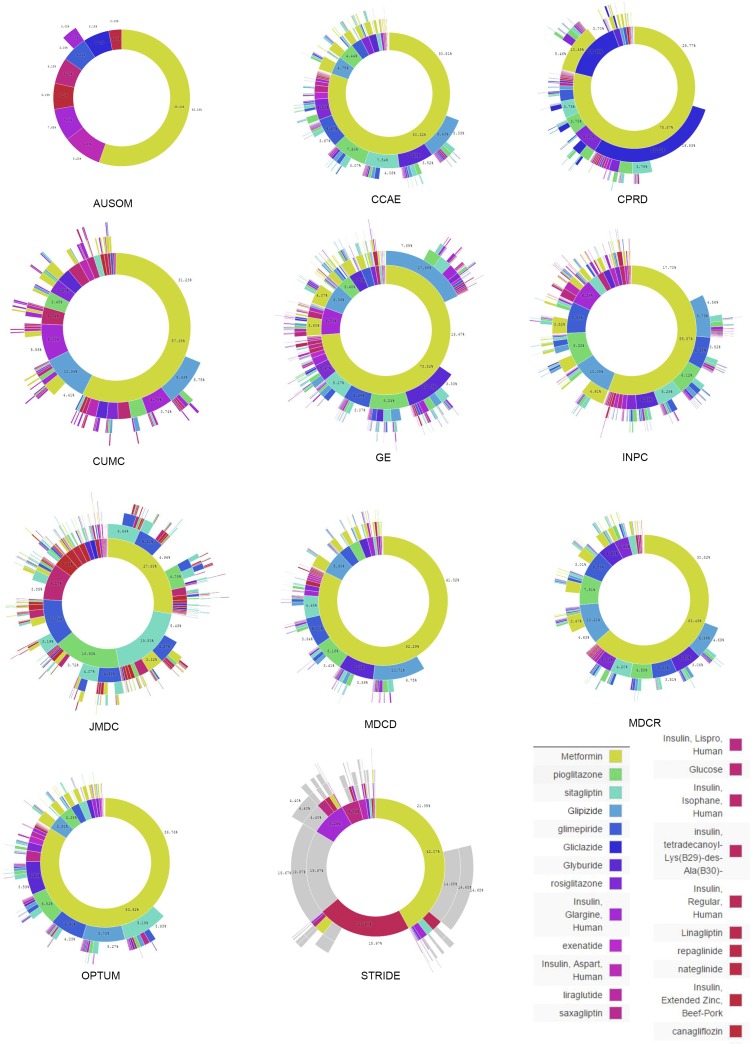
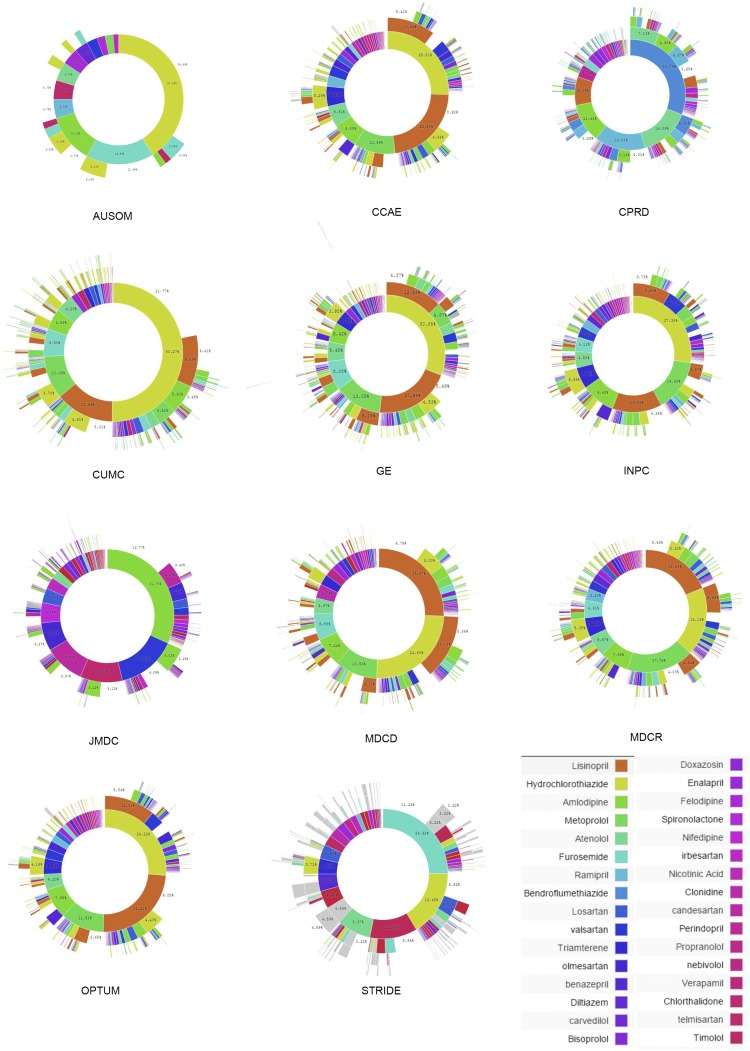
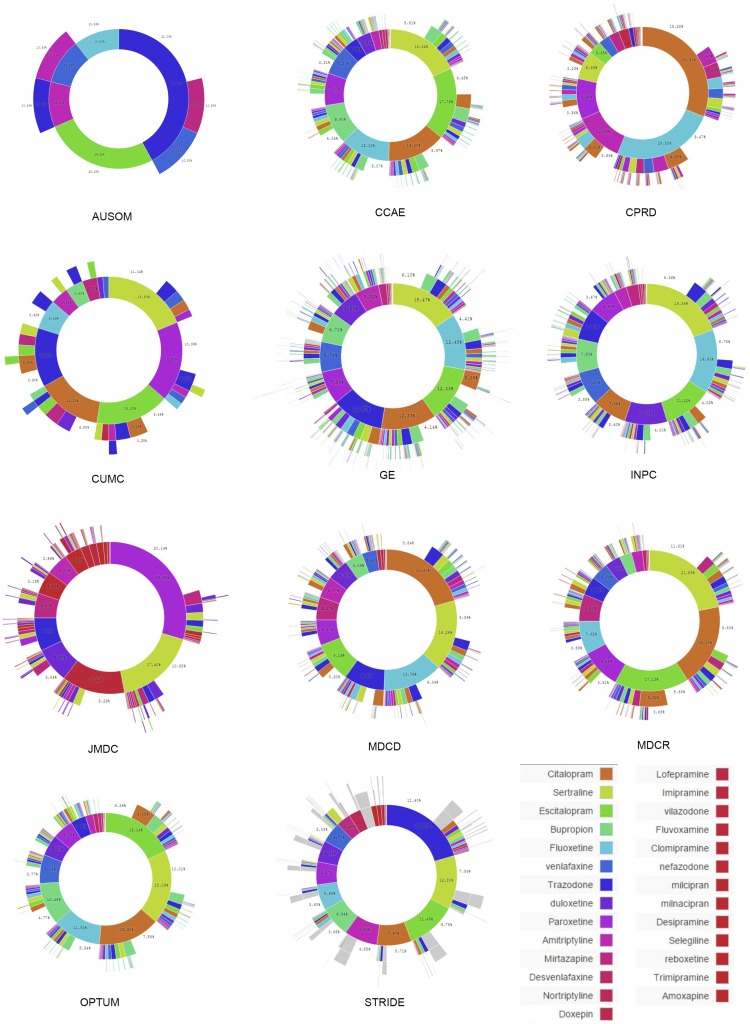
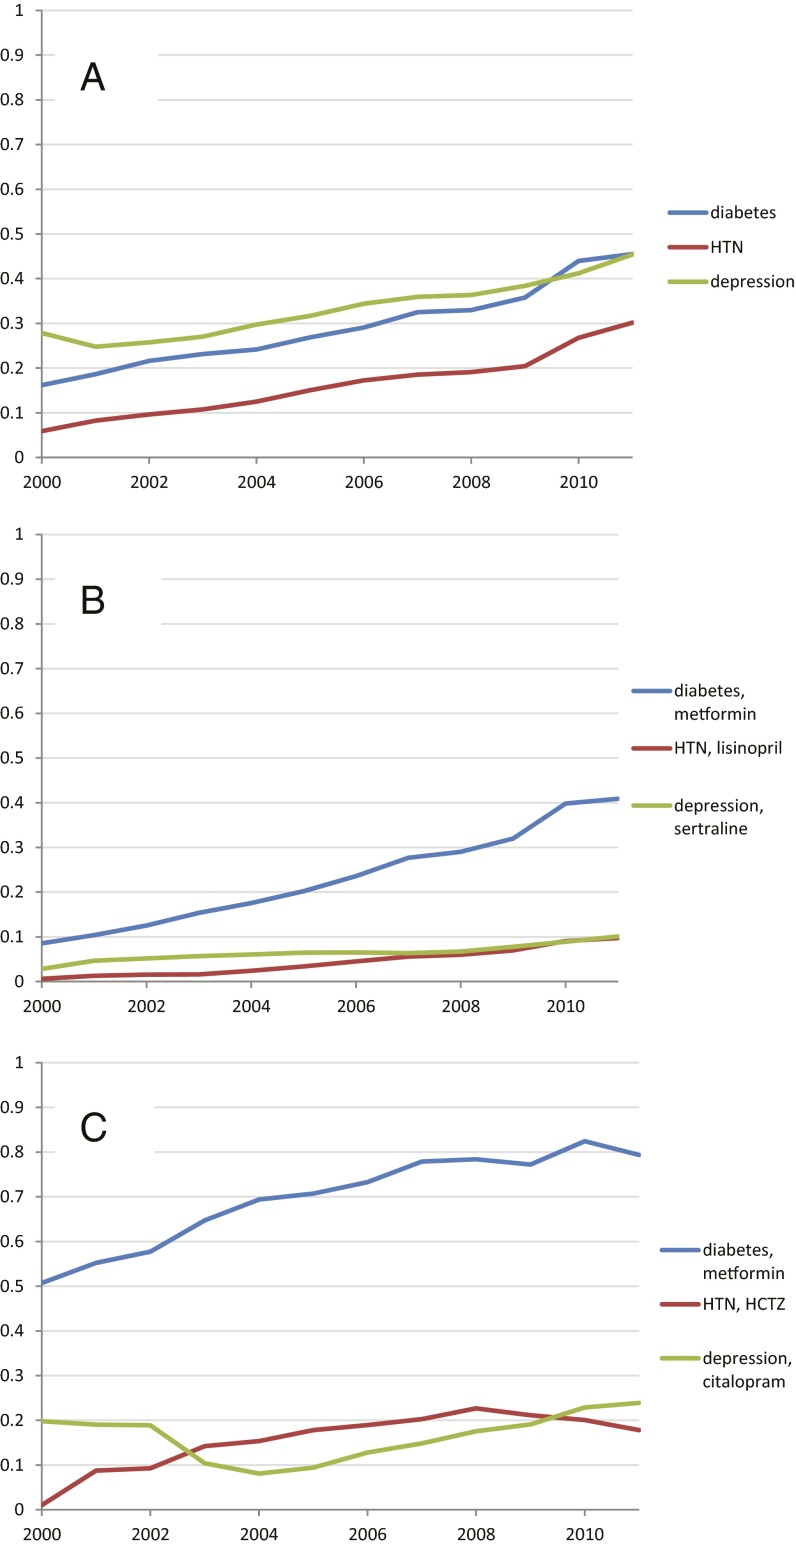
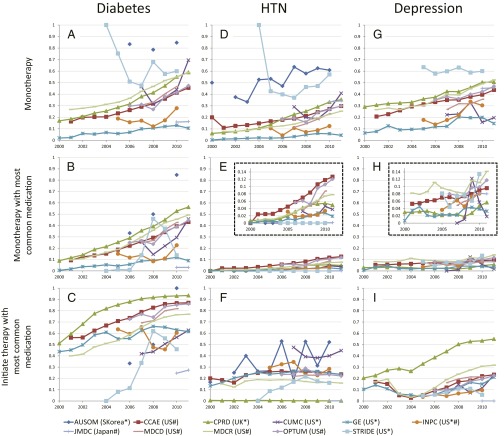
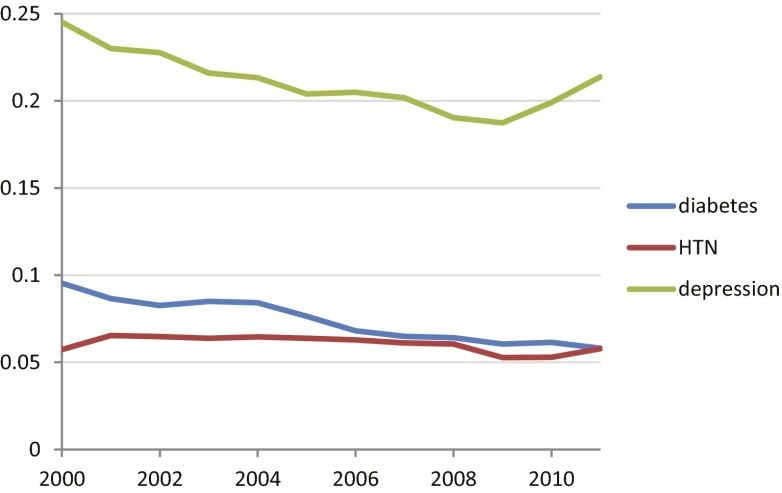
Observational research promises to complement experimental research by providing large, diverse populations that would be infeasible for an experiment. Observational research can test its own clinical hypotheses, and observational studies also can contribute to the design of experiments and inform the generalizability of experimental research. Understanding the diversity of populations and the variance in care is one component. In this study, the Observational Health Data Sciences and Informatics (OHDSI) collaboration created an international data network with 11 data sources from four countries, including electronic health records and administrative claims data on 250 million patients. All data were mapped to common data standards, patient privacy was maintained by using a distributed model, and results were aggregated centrally. Treatment pathways were elucidated for type 2 diabetes mellitus, hypertension, and depression. The pathways revealed that the world is moving toward more consistent therapy over time across diseases and across locations, but significant heterogeneity remains among sources, pointing to challenges in generalizing clinical trial results. Diabetes favored a single first-line medication, metformin, to a much greater extent than hypertension or depression. About 10% of diabetes and depression patients and almost 25% of hypertension patients followed a treatment pathway that was unique within the cohort. Aside from factors such as sample size and underlying population (academic medical center versus general population), electronic health records data and administrative claims data revealed similar results. Large-scale international observational research is feasible.

Keywords: data network; observational research; treatment pathways.


Conflict of interest statement

The authors declare no conflict of interest.

Figures

Fig. 1.
Fig. 1.
Treatment pathway event flow. The index date for each case was the time of first exposure to one of the medications deemed relevant to that disease according to the medication classes defined in Table 1. The patient had to have been observed for at least 1 y before the index date. The patient had to have at least one diagnosis code from Table 1 within the 1-y preindex to 3-y postindex period, and the patient could have no codes from the exclusions in Table 1. In addition, the patient had to have an exposure to one of the relevant medications for that disease in each 120-d period after the index date. For data sources that allowed less-frequent updates (180 d for a prescription and five refills), the windows were adjusted.
Fig. 2.
Fig. 2.
Treatment pathways for all data sources. For each disease, diabetes (A), hypertension (B), and depression (C), and across all data sources, the inner circle shows the first relevant medication that the patient took, the second circle shows the second medication, and so forth. Only four levels are shown, but up to 20 medications were recorded. For example, 76% of diabetes patients started with metformin, and 29% took only metformin.
Fig. 3.
Fig. 3.
For each disease, diabetes (AC), hypertension (DF), and depression (GI), the inner circle shows the first relevant medication that the patient took, the second circle shows the second medication, and so forth. Three data sources are shown for each disease; the data source abbreviations are defined in Table 2.
Fig. S1.
Fig. S1.
Treatment pathways for type 2 diabetes mellitus. The inner circle for each source shows the first relevant medication that the patient took, the second circle shows the second medication, and so forth. The data source abbreviations are defined in Table 2.
Fig. S2.
Fig. S2.
Treatment pathways for hypertension. The inner circle for each source shows the first relevant medication that the patient took, the second circle shows the second medication, and so forth. The data source abbreviations are defined in main paper Table 2.
Fig. S3.
Fig. S3.
Treatment pathways for depression. The inner circle for each source shows the first relevant medication that the patient took, the second circle shows the second medication, and so forth. The data source abbreviations are defined in main paper Table 2.
Fig. 4.
Fig. 4.
Medication-use metrics across all sources. Graphs show proportion by year for across all data sources for (A) cases with only one medication in the sequence (monotherapy); (B) cases in which the sequence contains only the most common monotherapy medication for that disease (medication listed with disease); and (C) cases in which a sequence begins with the most common starting medication for that disease (medication listed with disease).
Fig. 5.
Fig. 5.
Medication-use metrics by data source. For three diseases, diabetes (AC), hypertension (DF), and depression (GI), the graphs show the proportion of cases with only one medication in the sequence (monotherapy: A, D, and G), the proportion of cases in which the sequence contains only the most common monotherapy medication for that disease (B: metformin for diabetes; E: lisinopril for hypertension; and H: sertraline for depression), and the proportion of cases in which a sequence begins with the most common starting medication for that disease (C: metformin for diabetes; F: hydrochlorothiazide for hypertension; and I: citalopram for depression). The vertical axes in the graphs in E and H are expanded in the Insets. The horizontal axis shows the year. Abbreviations in the data source legend are defined in Table 2; the country of origin is given in parentheses. Asterisks mark electronic health record data, and hashtags mark claims data.
Fig. 6.
Fig. 6.
Changes and additions to medication within structural medication class. Medication class was defined by the Anatomical Therapeutic Chemical classification hierarchy. For each disease, the graph shows the proportion of medication changes that were within class versus changes that were between classes. Over this period, the number of classes per disease was approximately constant: Diabetes had 16 or 17, hypertension (HTN) had 17–19, and depression had 13.

References

    1. Etheredge LM. Rapid learning: A breakthrough agenda. Health Aff (Millwood) 2014;33(7):1155–1162. - PubMed
    1. Atkins D, et al. GRADE Working Group Grading quality of evidence and strength of recommendations. BMJ. 2004;328(7454):1490–1494. - PMC - PubMed
    1. Guyatt G, et al. Grading strength of recommendations and quality of evidence in clinical guidelines: Report from an american college of chest physicians task force. Chest. 2006;129(1):174–181. - PubMed
    1. Concato J, Shah N, Horwitz RI. Randomized, controlled trials, observational studies, and the hierarchy of research designs. N Engl J Med. 2000;342(25):1887–1892. - PMC - PubMed
    1. Benson K, Hartz AJ. A comparison of observational studies and randomized, controlled trials. N Engl J Med. 2000;342(25):1878–1886. - PubMed

Publication types

MeSH terms