. 2016 Jun 21;113(25):6910-5.
doi: 10.1073/pnas.1523824113. Epub 2016 Jun 7.

Plasma membrane/cell wall perturbation activates a novel cell cycle checkpoint during G1 in Saccharomyces cerevisiae

Affiliations

Plasma membrane/cell wall perturbation activates a novel cell cycle checkpoint during G1 in Saccharomyces cerevisiae

Keiko Kono et al. Proc Natl Acad Sci U S A. .

Abstract

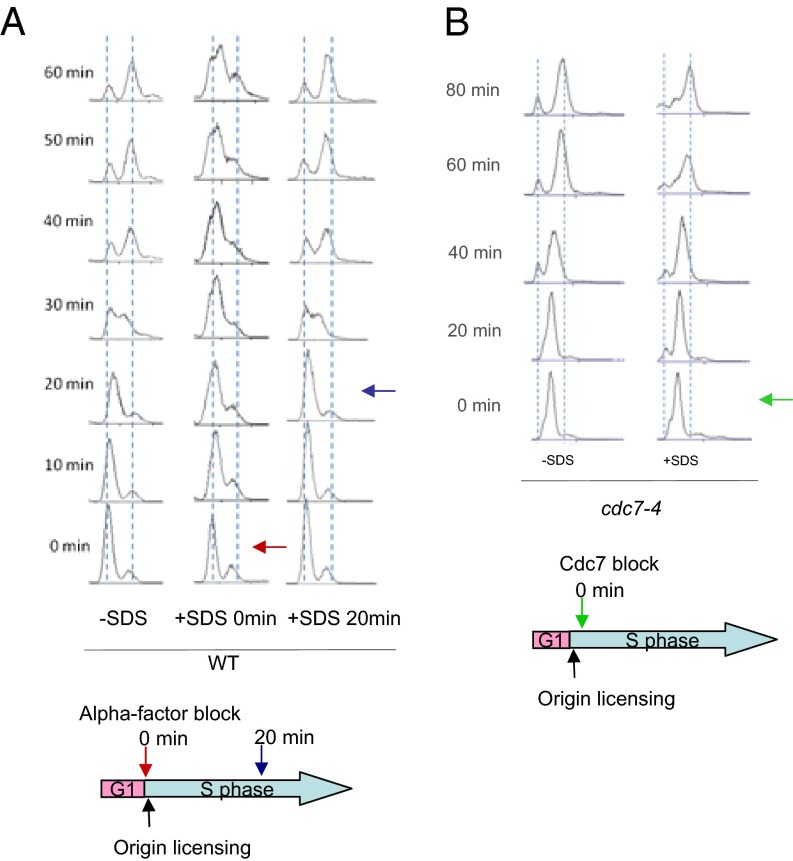
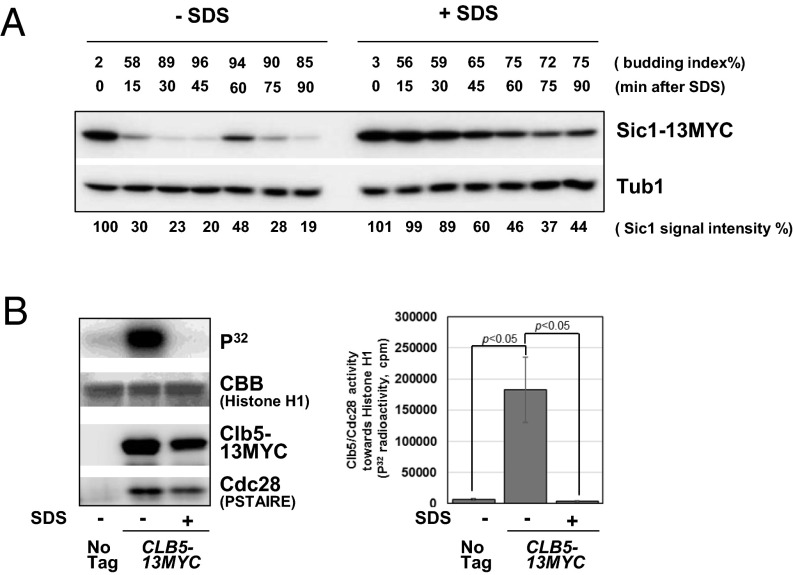
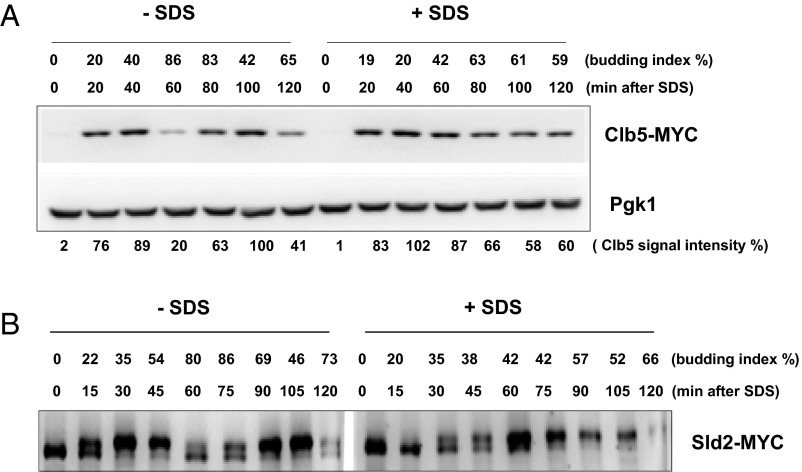
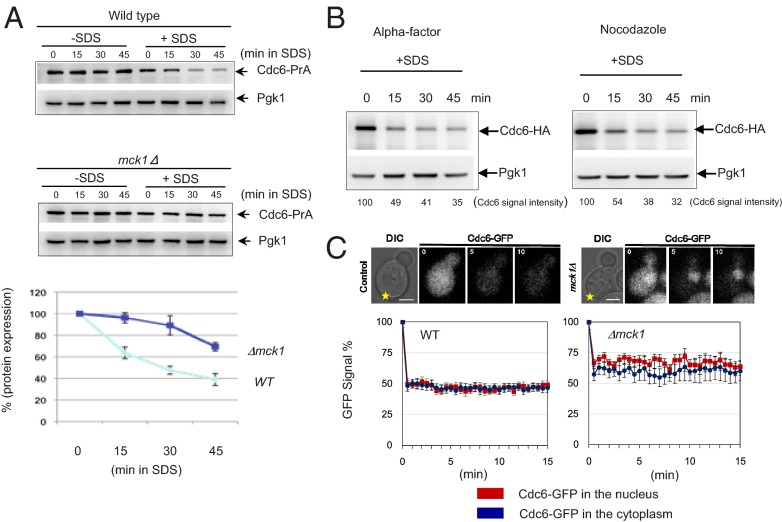
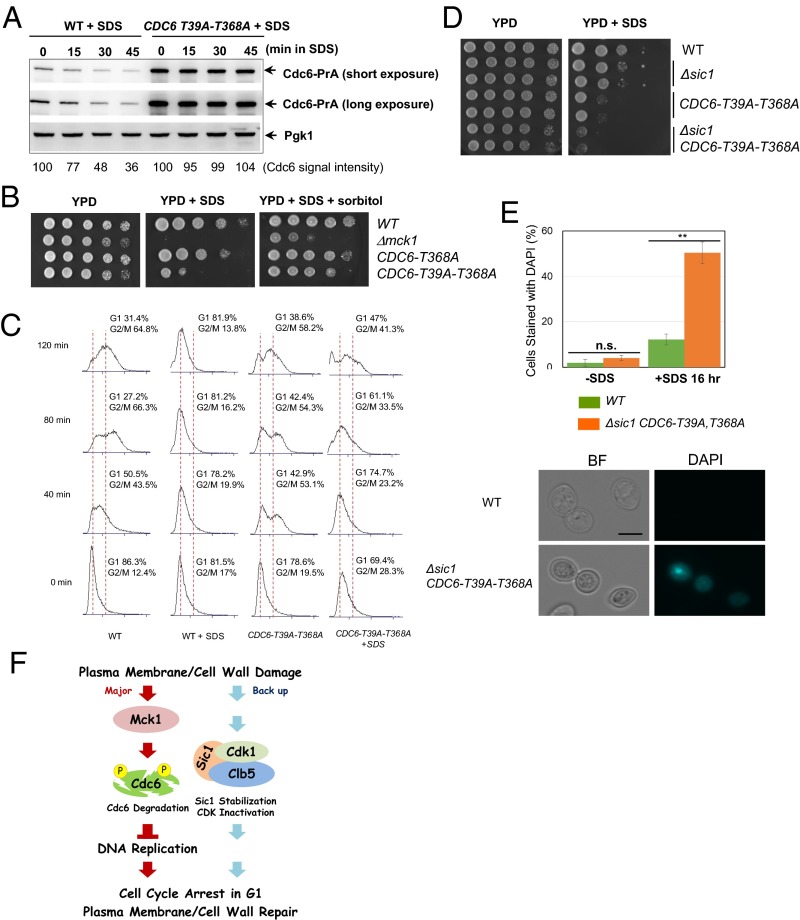
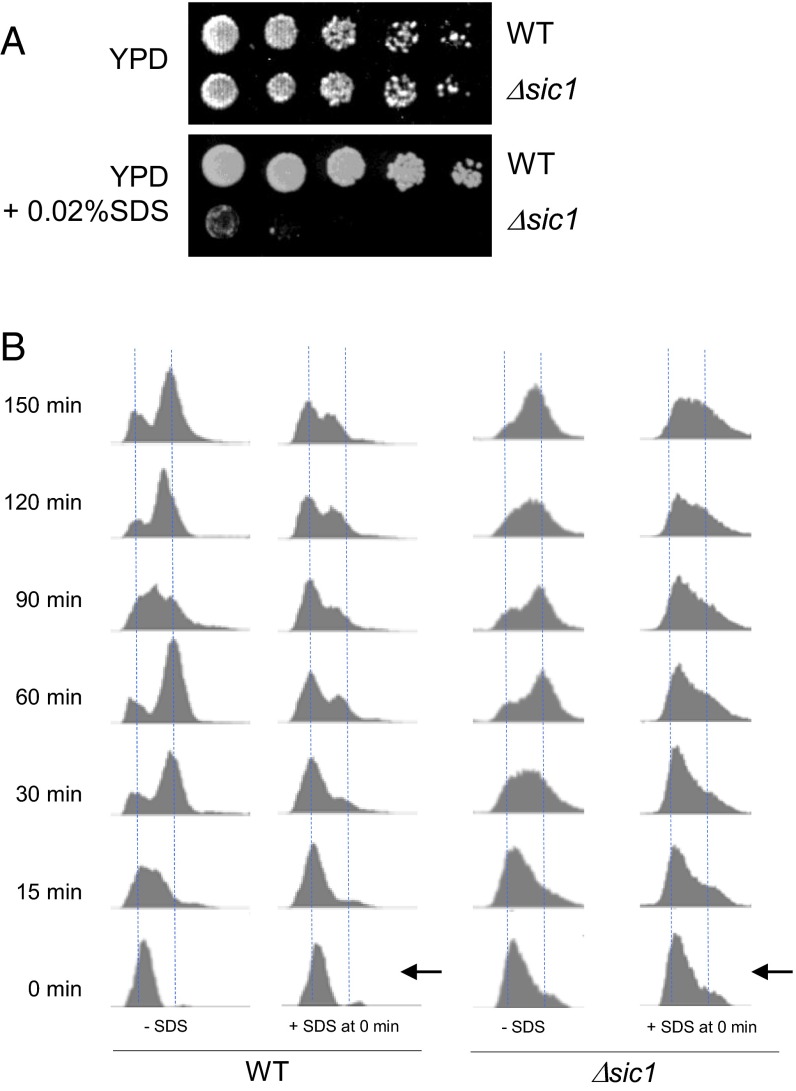
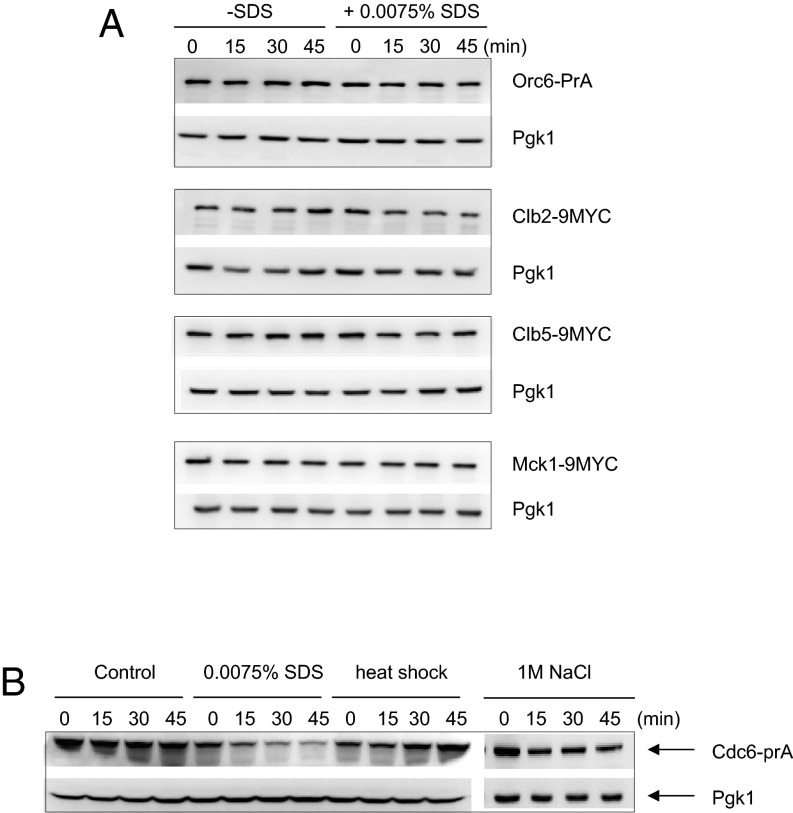
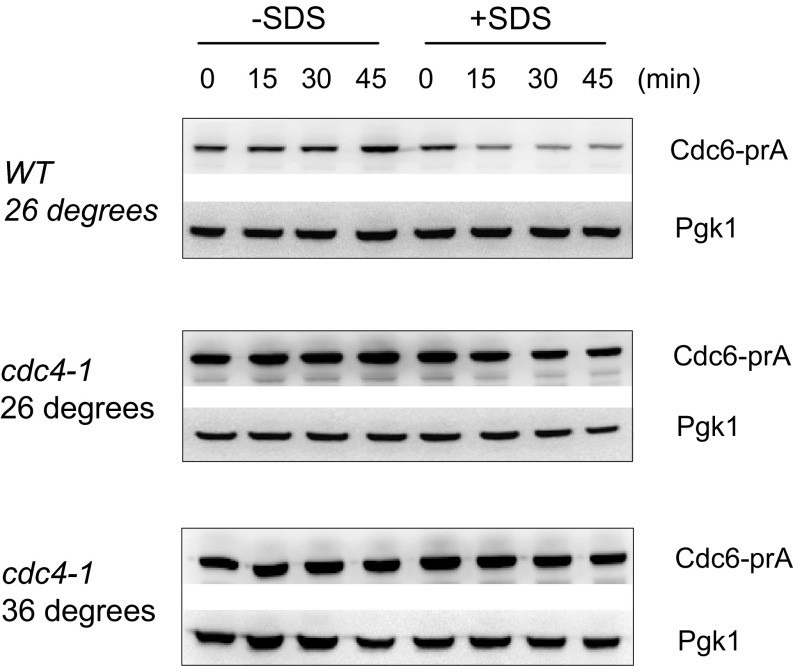
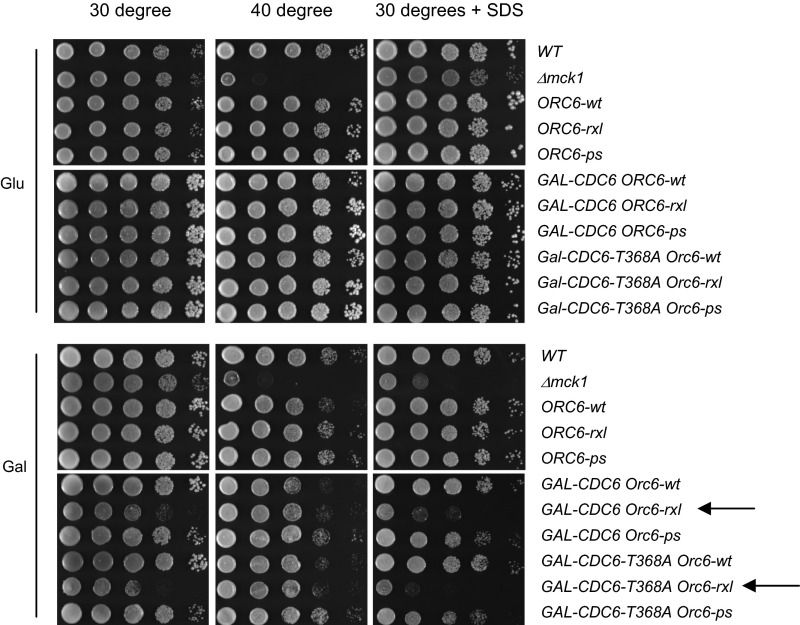
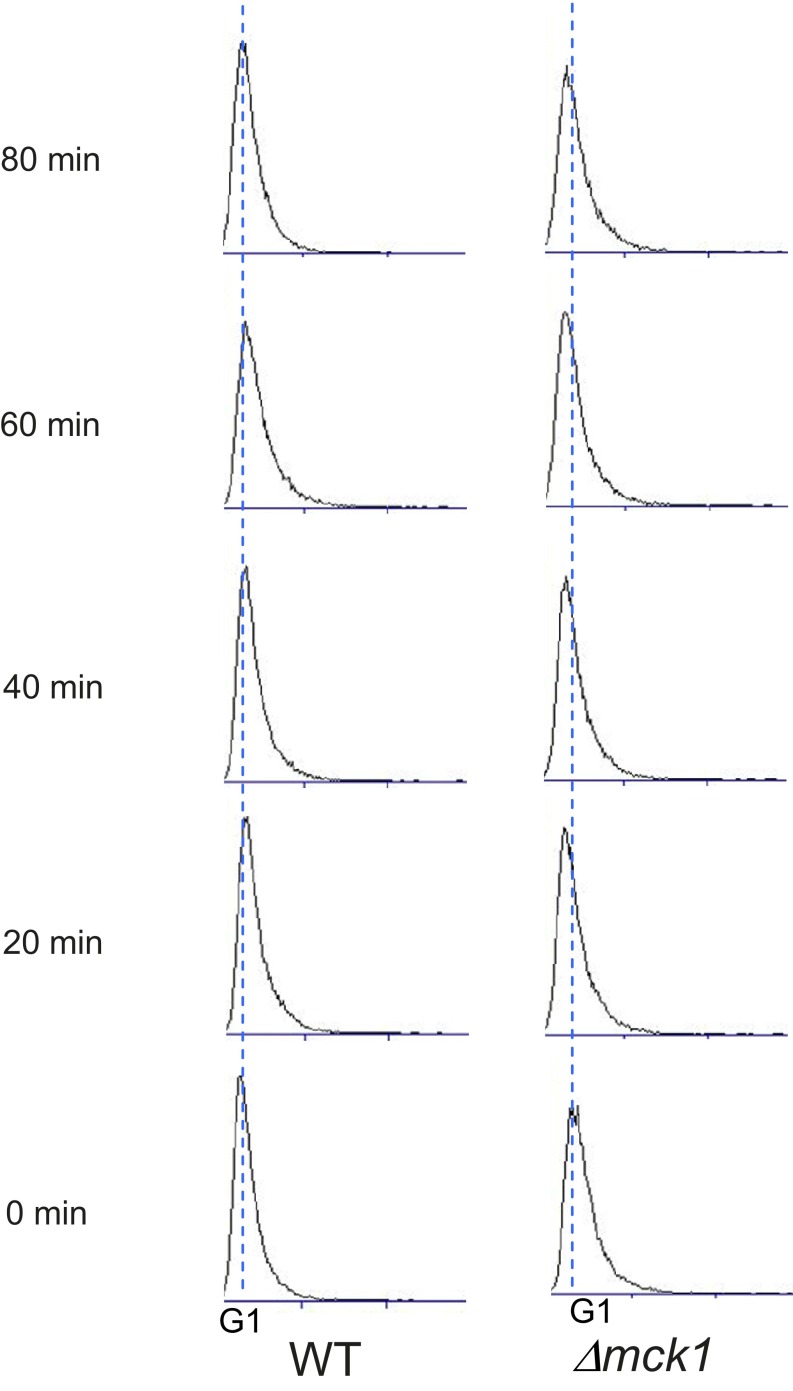
Cellular wound healing or the repair of plasma membrane/cell wall damage (plasma membrane damage) occurs frequently in nature. Although various cellular perturbations, such as DNA damage, spindle misalignment, and impaired daughter cell formation, are monitored by cell cycle checkpoint mechanisms in budding yeast, whether plasma membrane damage is monitored by any of these checkpoints remains to be addressed. Here, we define the mechanism by which cells sense membrane damage and inhibit DNA replication. We found that the inhibition of DNA replication upon plasma membrane damage requires GSK3/Mck1-dependent degradation of Cdc6, a component of the prereplicative complex. Furthermore, the CDK inhibitor Sic1 is stabilized in response to plasma membrane damage, leading to cell integrity maintenance in parallel with the Mck1-Cdc6 pathway. Cells defective in both Cdc6 degradation and Sic1 stabilization failed to grow in the presence of plasma membrane damage. Taking these data together, we propose that plasma membrane damage triggers G1 arrest via Cdc6 degradation and Sic1 stabilization to promote the cellular wound healing process.

Keywords: DNA replication; cdc6; cell wall integrity; mck1; sic1.


Conflict of interest statement

The authors declare no conflict of interest.

Figures

Fig. 1.
Fig. 1.
S-phase progression is inhibited in response to SDS. (A) Wild-type cells were arrested and released in G1-phase by α-factor. The cell cycle progression was monitored by FACS analysis in the presence or absence of 0.0075% SDS added at time 0 (red arrow) or 20 min after release (blue arrow). (B) First, cdc7-4 cells were arrested in G1-phase by α-factor at 23 °C and then released at 37 °C, the restrictive temperature, to block the cells after pre-RC formation but with an inactive helicase. Cells were then released into YPD media at 23 °C and collected every 20 min to monitor the cell cycle progression by FACS analysis in the presence or absence of SDS 0.0075% added at time 0 (green arrow). The diagrams below show at what point of the cycle that the cells were in when SDS was added.
Fig. 2.
Fig. 2.
CDK is inhibited through Sic1 stabilization upon SDS treatment. (A) Cells expressing Sic1-13myc (BY4741) from the genomic locus were synchronized by α-factor, and then released into fresh YPD medium in the presence or absence of 0.02% SDS to induce plasma membrane damage. Protein samples were collected every 15 min to observe Sic1-13myc levels by Western blotting. Tub1 was used as a loading control. The budding index is shown as percent of budded cells. (B) CLB5-13MYC cells (BY4741) were synchronized in G1 phase by α-factor. The cell cycle block was released and SDS was added to the media. Samples were collected at 20 min after the release. Clb5-13myc was immunopurified using anti-myc (9E10) antibody. Kinase reactions were performed with Histone H1 as a substrate. Total Histone H1 was visualized by Coomassie staining. Western blotting was performed to show the total amount of Clb5 and Cdc28. The graph indicates the averages of four independent experiments. Error bars represent SEM. Statistical significance was determined by Student’s t test.
Fig. S1.
Fig. S1.
Clb5 is stabilized after SDS treatment. (A) CLB5-MYC cells were synchronized during G1 phase by α-factor. The cell cycle block was released and SDS was added to the media. Samples were collected every 20 min for protein extractions. Each time point was subjected to Western blot analysis. Pgk1 was used as a loading control. Budding index is shown as percent of budded cells. (B) SLD2-MYC cells were used to monitor the Sld2 phosphorylation status upon G1 block and release as described in A.
Fig. 3.
Fig. 3.
Cdc6 is degraded in response to plasma membrane stress. (A) CDC6-prA or Δmck1 CDC6-prA cells were grown to log-phase. Samples were collected every 15 min in the presence or absence of 0.0075% SDS. Protein was extracted from each time point for Western blotting to detect Cdc6-prA or Pgk1 as a loading control. The same experiment was repeated three times and the signal was quantified to show the average with SD. (B) GAL-CDC6 cells were incubated in galactose-containing media first. The cell cycle was arrested in G1 by α-factor or in mitosis by nocodazole. The cell cycle block was 86% in G1 and 83% in mitosis. Samples were collected every 15 min in the presence or absence of 0.0075% SDS. Protein was extracted from each time point and subjected to Western blotting. Pgk1 was used as a loading control. (C) Wild-type or Δmck1 cells were damaged with a laser at the location marked with a star. The Cdc6-GFP signal was monitored by live-cell imaging using a fluorescence microscope. The numbers in the upper left corner indicate the time after laser damage (min). (Scale bars, 2 µm.) The graphs show the mean GFP signal intensity after background subtraction (control cells, n = 15; mck1Δ cells, n = 11). The error bars represent SEM.
Fig. 4.
Fig. 4.
Phosphorylation of Cdc6-T39 and T368 is required for Cdc6 degradation and cell cycle arrest after plasma membrane damage. (A) CDC6-prA or CDC6-T39A-T368A-prA cells were grown to log-phase. SDS at 0.0075% concentration was added to the media, and samples were collected every 15 min. Protein was extracted from each time point for Western blotting to detect Cdc6-prA or Pgk1 as a loading control. (B) Indicated W303 background yeast strains were serially diluted at fivefold, and spotted on YPD, YPD containing 0.005% SDS, or YPD containing 0.005% SDS plus 1 M sorbitol plates. Plates were incubated for 2–3 days. (C) Indicated strains were grown in YPD and were synchronized in G1 phase by α-factor. The G1 block was released into nocodazole-containing YPD media plus 0.0075% SDS at time 0. Samples were collected every 40 min to monitor cell cycle progression via FACS analysis. (D) Indicated strains were serially diluted at 10-fold and plated on YPD with or without 0.0075% SDS plates. (E) Indicated strains were grown in YPD with or without 0.0075% SDS for 16 h. Cells were washed once with YPD and then stained with DAPI to visualize cells with a ruptured plasma membrane under a fluorescence microscope. Averages of three independent experiments are shown. n > 100 per each experiment. Error bars, SD **P < 0.01 (Student’s t test). (Scale bar, 5 μm.) The images are representations of DAPI stained cells treated with SDS. (F) A model of a novel cell cycle checkpoint activated by plasma membrane damage.
Fig. S2.
Fig. S2.
Sic1 is dispensable for G1 arrest caused by SDS. (A) BY4741 background yeast cells with indicated genotypes were serially diluted at fourfold on YPD or YPD +0.02% SDS and incubated for 4 d to test the viability. (B) Wild-type cells and Δsic1 cells in BY4741 background were arrested and released in G1 phase by α-factor. Cell cycle progression was monitored by FACS analysis in the presence or absence of SDS 0.02% added at time 0 after the release.
Fig. S3.
Fig. S3.
Cdc6 is degraded in response to SDS. (A) ORC6-prA, CLB2-9MYC, CLB5-9MYC, or MCK1-9MYC cells were grown to log-phase first, and then treated with 0.0075% SDS. Cells were collected every 15 min and protein extracts from each time point were subjected to Western blotting. (B) Cdc6-prA cells were grown to log-phase first, and were treated with either 0.0075% SDS at 40 °C or 1 M NaCl. Cells were collected every 15 min and protein extracts from each time point were subjected to Western blotting.
Fig. S4.
Fig. S4.
Cdc6 protein degradation by SDS is mediated through SCFCdc4. CDC6-prA (WT) or CDC6-prA cdc4-1 (cdc4-1) cells were arrested during mitosis by nocodazole first at the permissive temperature, 26 °C. Cells were then incubated at either 26 °C or 36 °C for 1.5 h, and samples were collected every 15 min with or without SDS treatment. Protein was extracted from each time point and subjected to Western blotting to visualize Cdc6-prA. Anti-Pgk1 antibody was used as a loading control.
Fig. S5.
Fig. S5.
DNA replication mutants are sensitive to SDS. Strains with indicated genotypes were serially diluted at tenfold on YPD or YPG plates. The plates were incubated at 30 °C, 40 °C, or 30 °C using plates containing SDS. Strains indicated by arrows induce DNA rereplication in the presence of galactose.
Fig. S6.
Fig. S6.
WT or Δmck1 cells were arrested and released in G1-phase by α-factor. The cell cycle progression was monitored by FACS analysis in the presence of SDS 0.0075% added at time 0 upon release.

Similar articles

Cited by

References

    1. Sonnemann KJ, Bement WM. Wound repair: Toward understanding and integration of single-cell and multicellular wound responses. Annu Rev Cell Dev Biol. 2011;27:237–263. - PMC - PubMed
    1. Bickle M, Delley PA, Schmidt A, Hall MN. Cell wall integrity modulates RHO1 activity via the exchange factor ROM2. EMBO J. 1998;17(8):2235–2245. - PMC - PubMed
    1. Delley PA, Hall MN. Cell wall stress depolarizes cell growth via hyperactivation of RHO1. J Cell Biol. 1999;147(1):163–174. - PMC - PubMed
    1. Levin DE, Fields FO, Kunisawa R, Bishop JM, Thorner J. A candidate protein kinase C gene, PKC1, is required for the S. cerevisiae cell cycle. Cell. 1990;62(2):213–224. - PubMed
    1. Nonaka H, et al. A downstream target of RHO1 small GTP-binding protein is PKC1, a homolog of protein kinase C, which leads to activation of the MAP kinase cascade in Saccharomyces cerevisiae. EMBO J. 1995;14(23):5931–5938. - PMC - PubMed

Publication types

MeSH terms

LinkOut - more resources