. 2016 Aug 9;7(32):51349-51364.
doi: 10.18632/oncotarget.9784.

Loss of insulin-like growth factor II imprinting is a hallmark associated with enhanced chemo/radiotherapy resistance in cancer stem cells

Affiliations

Loss of insulin-like growth factor II imprinting is a hallmark associated with enhanced chemo/radiotherapy resistance in cancer stem cells

Xin Zhao et al. Oncotarget. .

Abstract

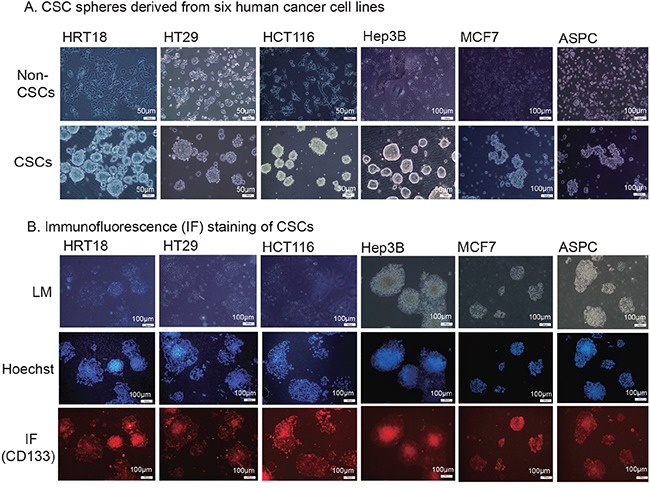
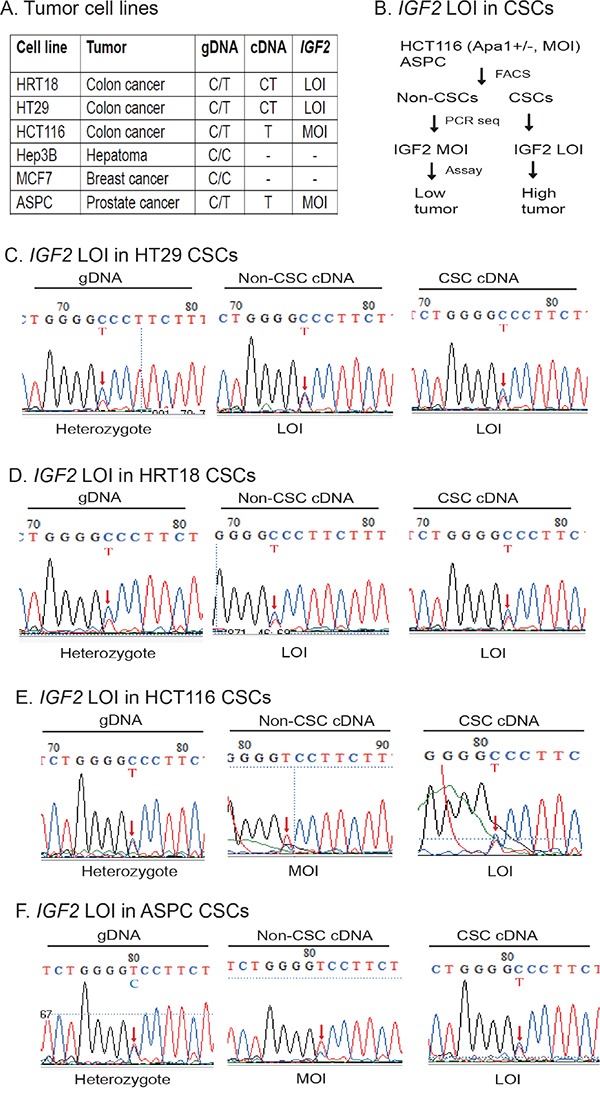
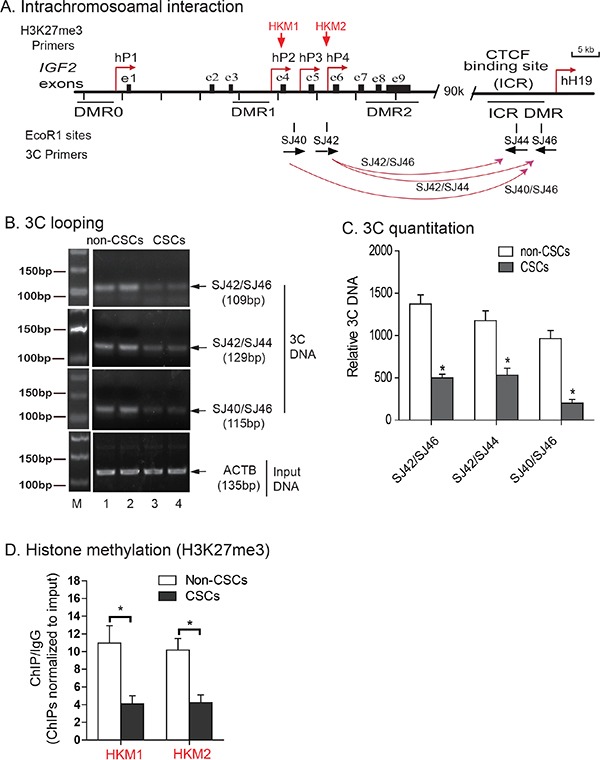
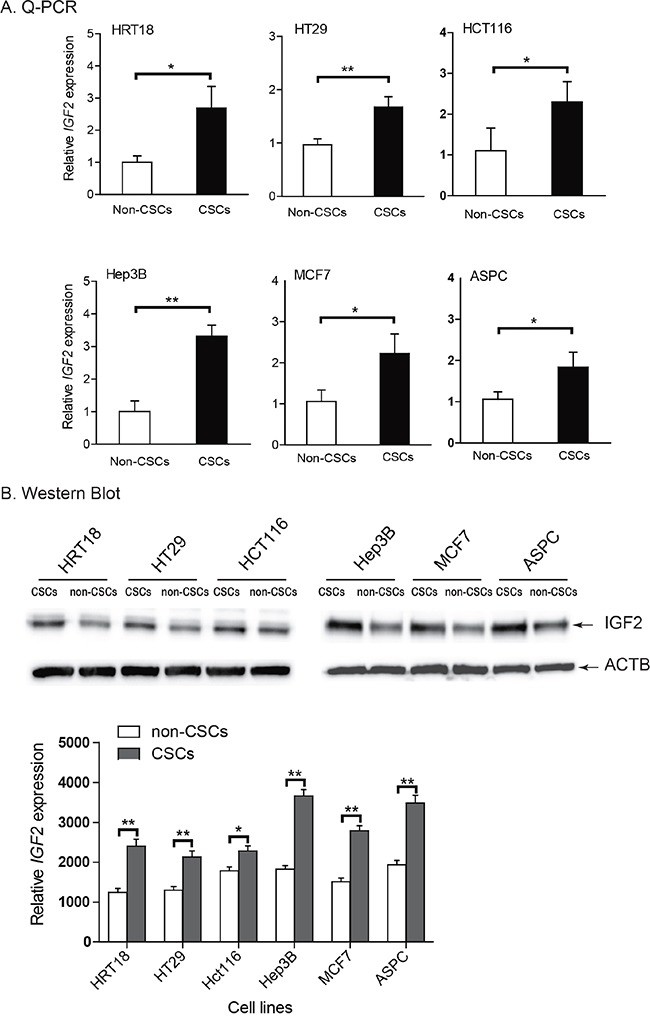
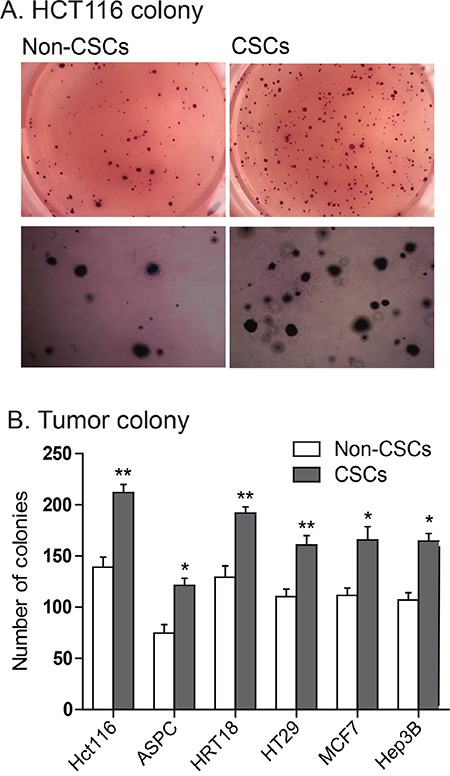
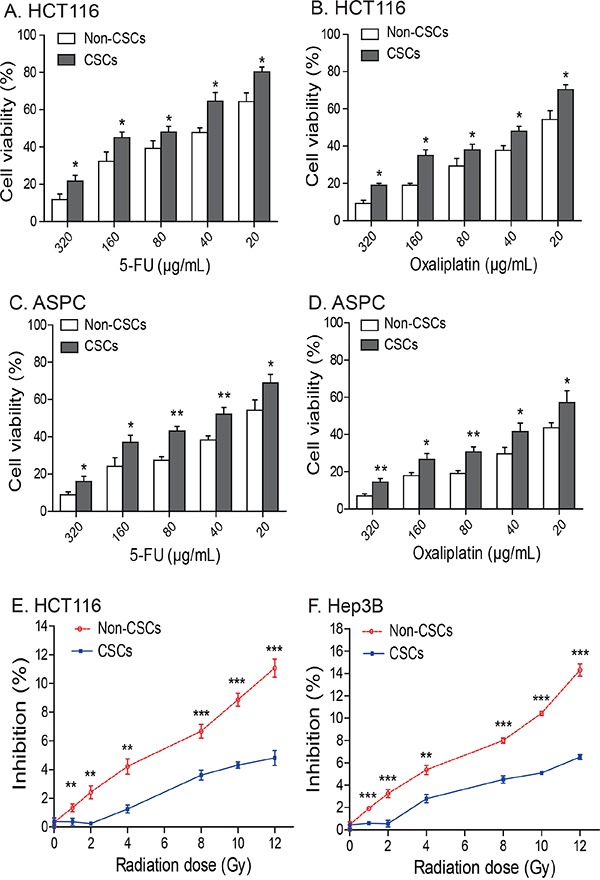
Insulin-like growth factor II (IGF2) is maternally imprinted in most tissues, but the epigenetic regulation of the gene in cancer stem cells (CSCs) has not been defined. To study the epigenetic mechanisms underlying self-renewal, we isolated CSCs and non-CSCs from colon cancer (HT29, HRT18, HCT116), hepatoma (Hep3B), breast cancer (MCF7) and prostate cancer (ASPC) cell lines. In HT29 and HRT18 cells that show loss of IGF2 imprinting (LOI), IGF2 was biallelically expressed in the isolated CSCs. Surprisingly, we also found loss of IGF2 imprinting in CSCs derived from cell lines HCT116 and ASPC that overall demonstrate maintenance of IGF2 imprinting. Using chromatin conformation capture (3C), we found that intrachromosomal looping between the IGF2 promoters and the imprinting control region (ICR) was abrogated in CSCs, in parallel with loss of IGF2 imprinting in these CSCs. Loss of imprinting led to increased IGF2 expression in CSCs, which have a higher rate of colony formation and greater resistance to chemotherapy and radiotherapy in vitro. These studies demonstrate that IGF2 LOI is a common feature in CSCs, even when the stem cells are derived from a cell line in which the general population of cells maintain IGF2 imprinting. This finding suggests that aberrant IGF2 imprinting may be an intrinsic epigenetic control mechanism that enhances stemness, self-renewal and chemo/radiotherapy resistance in cancer stem cells.

Keywords: IGF2; cancer stem cells; epigenetics; genomic imprinting; intrachromosomal looping.


Conflict of interest statement

No potential conflicts of interest were disclosed.

Figures

Figure 1
Figure 1. Isolation of cancer stem cells (CSCs)
A. CSC spheres derived from six human cancer cell lines. Tumor cells were sorted by FACS to separate the CD133 and CD133+ subpopulations. The CD133 cells were cultured in RPMI 1640 or DMDM and were classified as the non-cancer stem cells (non-CSCs). The CD133+ cells were cultured in nonadhesive plates in cancer sphere medium (DMEM-F12 supplemented with 20 ng/ml bFGF, 20 ng/mL EGF, and 20 μl/ml B27). B. Immunofluorescence (IF) staining of CSCs. The sphere cells were treated with 4% paraformaldehyde, incubated with anti-CD133 antibody, and followed by the secondary antibody conjugated to fluorescent phycobiliproteins. Hoechst 33258 was used for nuclear counterstaining.
Figure 2
Figure 2. Differential loss of IGF2 imprinting in CSCs
A. Imprinting status in cancer cell lines. Using ApaI restriction enzyme typing and DNA sequencing of genomic DNA (gDNA), six human cancer cell lines were divided into informative (heterozygous C/T) and non-informative (homozygous C/C). By examining the expression of cDNA, HRT18 and HT29 were shown to demonstrate loss of IGF2 imprinting (LOI). In contrast, HCT116 and ASPC were grouped as maintenance of IGF2 imprinting (MOI). Hep3B and MCF7 were homozygous for the SNP and could not be used for imprinting analysis. gDNA: genomic DNA; cDNA: complementary DNA from reverse transcription. B. Differential IGF2 imprinting between CSCs and non-CSCs. Two MOI tumor cells (HCT116 and ASPC) were separated into CSCs and non-CSCs. IGF2 imprinting was examined by cDNA PCR sequencing. Restriction enzyme ApaI was used to genotype the IGF2 alleles. C. Loss of IGF2 imprinting in HT29 CSCs. Sequencing of genomic DNA shows the C/T heterozygosity. Red arrow: the site of the ApaI polymorphism. Note the biallelic expression of IGF2 mRNA (LOI) in both non-CSCs and CSCs. D. Loss of IGF2 imprinting in HRT18 CSCs. Both the non-CSCs and CSCs show loss of IGF2 imprinting (LOI). E. Differential IGF2 imprinting in HCT116 CSCs. In non-CSCs, only the T allele was detected, showing a typical imprinting pattern. In CSCs, however, both parental alleles were expressed (LOI). F. Differential IGF2 imprinting in ASPC CSCs. Note the monoallelic expression of IGF2 in non-CSCs, but the biallelic expression (LOI) in CSCs.
Figure 3
Figure 3. Abnormal intrachromosomal interactions between the ICR and IGF2 promoters in CSCs
A. Schematic diagram of IGF2 intrachromosomal interactions. 3C primers: PCR primers used to detect intrachromosomal interactions; DMRs: Differentially methylated regions; P1-P4: human IGF2 promoters; ICR: imprinting control region. The orientation and location of the 3C primers are shown by arrows under each EcoR1 site. B. The intrachromosomal interaction between the IGF2 promoter and the CTCF-binding site in the ICR of HCT116 cells. M: 100 bp marker. The intrachromosomal interaction products were detected by 3C assay using primers in CTCF site combined with primers in IGF2 promoters. Input DNA was used as the 3C control. Note the reduced 3C signals in CSCs. C. Quantitation of intrachromosomal interaction 3C products by quantitative PCR. All data shown are mean±SD from three independent. *p<0.01 as compared with non-CSCs. D. Histone methylation in the IGF2 promoter. Levels of histone modifications in the IGF2 promoter were measured by ChIP assay using antibodies specific for H3K27me3 in HCT116 non-CSCs and HCT116 CSCs. Normal rabbit IgG was used as a negative control. Precipitated DNA was subjected to qPCR. Bar graphs represent the ratio of precipitated DNA signals to IgG after normalization over the input. Error bars represent the standard error of the mean of three independent experiments. * p<0.05 between HCT116, non-CSCs and HCT116 CSCs.
Figure 4
Figure 4. Upregulation of IGF2 in CSCs
A. Differential expression of IGF2 between the non-CSCs and CSCs as measured by quantitative RT-PCR. Note the upregulated IGF2 in CSCs as compared with that in non-CSCs. B. IGF-II protein as quantitated by Western blot. Protein expression was measured by imaging system Quantity One. All data shown are mean±SD from three independent experiments. * p<0.05, ** p<0.01 between the two groups.
Figure 5
Figure 5. Enhanced ability to form tumor colonies in IGF2-upregulated CSCs
A. Representative images of colonies of HCT116 cells stained with MTT in soft agar. B. Quantitation of tumor colonies in CSCs. Colonies were counted under microscopy and the results were presented as colonies per 500 cells. *P<0.05, **P<0.01 as compared with the non-CSCs. The results are expressed as the mean±standard deviation of three independent experiments.
Figure 6
Figure 6. Chemotherapy and radiotherapy-resistance in CSCs
A-D. IGF2-upregulated CSCs isolated from HCT16 and ASPC cells are resistant to treatment with 5-FU and oxalipatin. * p<0.05, ** p<0.01 as compared to the non-CSCs. The results are expressed as the mean ± standard deviation of three independent experiments. E-F. The IGF2-upregulated CSCs from HCT116 and Hep3B cells are resistant to radiotherapy. Cells were irradiated with 1-12Gy radiation and evaluated by WST-1 cell proliferation assays. ** p<0.01, *** p<0.001 as compared to the non-CSCs.
Figure 7
Figure 7. Knockdown of IGF2
A. Knockdown of IGF2 by siRNAs (siIGF2 1#, siIGF2 2#). siNC: negative control siRNA. The abundance of IGF-II protein was quantitated by Western blot. B. IGF2 knockdown reduced CD133-positive cells. After siRNA treatment, CD133+ cells were analyzed by FACS. C. Reduced cell proliferation in IGF2-knockdown CSCs. **P<0.01 vs. control cells (siNC). D. Cell cycle analysis after interference of IGF2 expression. After treatment with the control siRNA (siNC) and IGF2 siRNA (siIGF2 1# and siIGF2 2#), cell cycle was analyzed by FACS. E. Apoptosis as measured by FITC Annexin V-FACS assay. F. Cell migration. IGF2 knockdown reduced cell migration in HCT116 CSCs. G. Cell invasion. Cells that invaded through the collagen-coated membrane of the transwell were counted. All data shown are mean±SEM from three independent experiments. *p < 0.05 as compared with control cells (siNC).

References

    1. Frank NY, Schatton T, Frank MH. The therapeutic promise of the cancer stem cell concept. J Clin Invest. 2010;120:41–50. - PMC - PubMed
    1. Schulenburg A, Blatt K, Cerny-Reiterer S, Sadovnik I, Herrmann H, Marian B, Grunt TW, Zielinski CC, Valent P. Cancer stem cells in basic science and in translational oncology: can we translate into clinical application? Journal of hematology & oncology. 2015;8:16. - PMC - PubMed
    1. Liao WT, Ye YP, Deng YJ, Bian XW, Ding YQ. Metastatic cancer stem cells: from the concept to therapeutics. American journal of stem cells. 2014;3:46–62. - PMC - PubMed
    1. Li S, Li Q. Cancer stem cells and tumor metastasis (Review) International journal of oncology. 2014;44:1806–1812. - PMC - PubMed
    1. Bhatia M, Wang JC, Kapp U, Bonnet D, Dick JE. Purification of primitive human hematopoietic cells capable of repopulating immune-deficient mice. Proc Natl Acad Sci U S A. 1997;94:5320–5325. - PMC - PubMed

MeSH terms

LinkOut - more resources