. 2016 Jun 8;14(6):e1002475.
doi: 10.1371/journal.pbio.1002475. eCollection 2016 Jun.

Evolution of High Cellulolytic Activity in Symbiotic Streptomyces through Selection of Expanded Gene Content and Coordinated Gene Expression

Affiliations

Evolution of High Cellulolytic Activity in Symbiotic Streptomyces through Selection of Expanded Gene Content and Coordinated Gene Expression

Adam J Book et al. PLoS Biol. .

Abstract

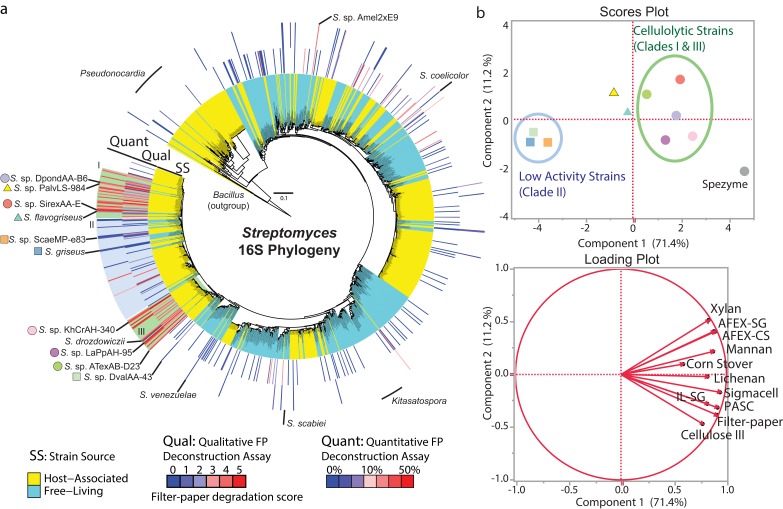
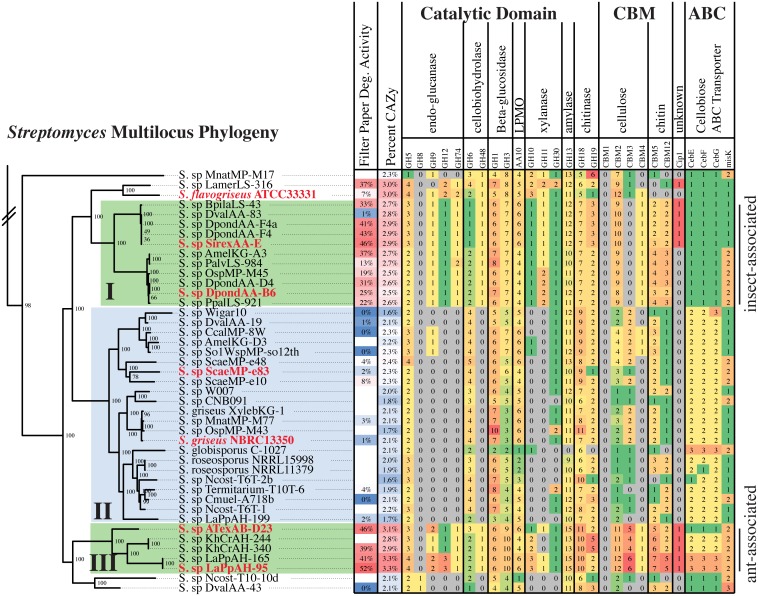
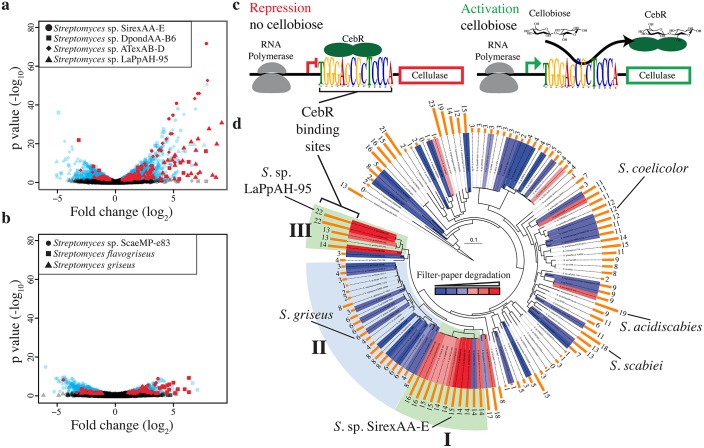
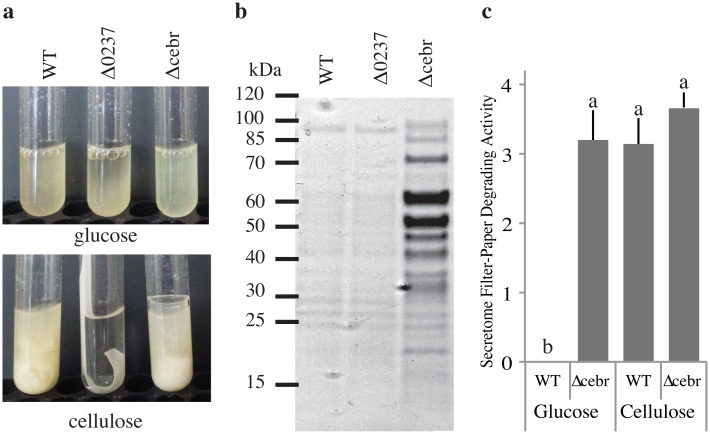
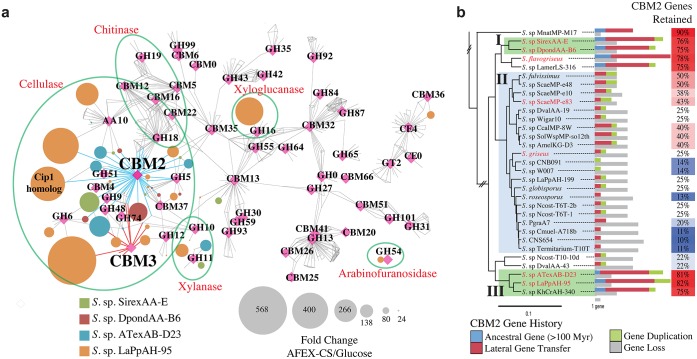
The evolution of cellulose degradation was a defining event in the history of life. Without efficient decomposition and recycling, dead plant biomass would quickly accumulate and become inaccessible to terrestrial food webs and the global carbon cycle. On land, the primary drivers of plant biomass deconstruction are fungi and bacteria in the soil or associated with herbivorous eukaryotes. While the ecological importance of plant-decomposing microbes is well established, little is known about the distribution or evolution of cellulolytic activity in any bacterial genus. Here we show that in Streptomyces, a genus of Actinobacteria abundant in soil and symbiotic niches, the ability to rapidly degrade cellulose is largely restricted to two clades of host-associated strains and is not a conserved characteristic of the Streptomyces genus or host-associated strains. Our comparative genomics identify that while plant biomass degrading genes (CAZy) are widespread in Streptomyces, key enzyme families are enriched in highly cellulolytic strains. Transcriptomic analyses demonstrate that cellulolytic strains express a suite of multi-domain CAZy enzymes that are coregulated by the CebR transcriptional regulator. Using targeted gene deletions, we verify the importance of a highly expressed cellulase (GH6 family cellobiohydrolase) and the CebR transcriptional repressor to the cellulolytic phenotype. Evolutionary analyses identify complex genomic modifications that drive plant biomass deconstruction in Streptomyces, including acquisition and selective retention of CAZy genes and transcriptional regulators. Our results suggest that host-associated niches have selected some symbiotic Streptomyces for increased cellulose degrading activity and that symbiotic bacteria are a rich biochemical and enzymatic resource for biotechnology.


Conflict of interest statement

The authors have declared that no competing interests exist.

Figures

Fig 1
Fig 1. Distribution of cellulolytic ability in the genus Streptomyces.
(a) 16S rRNA gene phylogenetic tree of 1,141 Streptomyces strains from free-living (cyan) and host-associated (yellow) environments. The tree is annotated with qualitative cellulose (filter-paper) degradation scores (0: no growth in 3 wk, 5: filter-paper deconstruction in 1 wk) and quantitative cellulose degrading activities (% filter-paper degraded in 10 d). Shading indicates highly cellulolytic clades I and III (green) and related low activity clade II (blue). (b) Principle component analysis of cellulose, hemicellulose, and plant biomass degrading activity of Streptomyces secretomes. Strains are identified by colored shapes on the tree in panel A. Scores plot shows similarity of polysaccharide degrading activity. Loading plot indicates which substrates influence components 1 and 2 of the scores plot.
Fig 2
Fig 2. Comparative analysis of CAZy genes across the Streptomyces genus.
Multilocus phylogenetic tree of clades I–III (full tree: S3 Fig). Taxonomy tree is a RAxML tree calculated from an alignment of 97 genes conserved across all species. Tree is rooted with the outgroup Kitasatospora setae, and bootstrap support for each node is indicated (100 bootstraps). Tree is annotated with filter-paper degradation activity and select data from the CAZy and ABC transporter analyses. The number of genes present in each functional category is indicated. Rapid cellulose degrading clades I and III are indicated in green, low activity clade II in blue. Red strains were selected for RNA-seq analysis.
Fig 3
Fig 3. Differential expression and coregulation of biomass degrading genes.
Differential expression (DE) of genes from clades I and III (a) and clade II (b). Strains were grown with glucose or AFEX pretreated corn stover as the sole carbon source. Each point represents a gene; the shape indicates the strain. The x-axis shows the fold change between carbon sources, and the y-axis shows the statistical support of the fold change. Black points indicate non-significant DE (p-value > 0.05). Red points identify CAZy annotated genes with significant DE. (c) Model for negative transcriptional control of CAZy genes by the CebR transcriptional regulator. The CebR binding sequence is the consensus of the top 25 coexpressed genes from each of the four cellulolytic strains. (d) Streptomyces multilocus phylogenetic tree annotated with quantitative cellulose (filter-paper) degrading activity (red and blue heatmap) and the number of CebR transcriptional regulator binding sites (TGGGAGCGCTCCCA) in the genome (orange bars).
Fig 4
Fig 4. Genetic analysis of Streptomyces sp. SirexAA-E.
(a) Phenotypic analysis of Streptomyces sp. SirexAA-E wild-type (wt), Δ0237 (GH6), and Δcebr (cellulase transcriptional regulator) strains grown on glucose or cellulose as the sole carbon source. (b) Secreted protein profile of wt, Δ0237, and Δcebr strains grown in glucose media. (c) Filter-paper degrading activity (mg glucose released per mg total protein) of secreted proteins isolated from wt and Δcebr strains grown with glucose or cellulose as the carbon source. Statistically significant differences are indicated.
Fig 5
Fig 5. Multi-domain enzyme expression and evolution.
(a) Protein similarity network of CAZymes present in four cellulolytic Streptomyces strains. Nodes are proteins (circles) or CAZy functional categories (magenta diamonds); edges indicate that the gene belongs to the respective CAZy family or BLAST similarity with an e-value < 1xe-50. Node size represents the fold-change in RNA abundance between glucose and AFEX corn stover grown cells. CBM2 and CBM3 linked proteins are indicated with blue and red edges, respectively. (b) Evolutionary expansion of CBM2 domains in cellulolytic Streptomyces. CBM2 domain gain and loss events for strains in cellulolytic clades I & III (green shading) and clade II (blue shading) mapped onto the multilocus phylogenetic tree. CBM2 retention rates (genes retained / total possible genes) are identified by the heatmap.

References

    1. Schlesinger WH, Andrews JA. Soil respiration and the global carbon cycle. Biogeochemistry. 2000;48(1):7–20.
    1. Zhao ZT, Liu HQ, Wang CF, Xu J-R. Comparative analysis of fungal genomes reveals different plant cell wall degrading capacity in fungi. BMC Genomics. 2013;14:274. - PMC - PubMed
    1. Berlemont R, Martiny AC. Phylogenetic distribution of potential cellulases in bacteria. Appl Environ Microbiol. 2013;79(5):1545–54. - PMC - PubMed
    1. Glass NL, Schmoll M, Cate JH, Coradetti S. Plant cell wall deconstruction by ascomycete fungi. Annu Rev Microbiol. 2013;67:477–98. 10.1146/annurev-micro-092611-150044 - DOI - PubMed
    1. Lynd LR, Weimer PJ, van Zyl WH, Pretorius IS. Microbial cellulose utilization: Fundamentals and biotechnology. Microbiol Mol Biol Rev. 2002;66(3):506–77. - PMC - PubMed

Publication types

MeSH terms