

A pH-Mediated Topological Switch within the N-Terminal Domain of Human Caveolin-3
- PMID: 27276265
- PMCID: PMC4906379
- DOI: 10.1016/j.bpj.2016.05.004
A pH-Mediated Topological Switch within the N-Terminal Domain of Human Caveolin-3
Abstract
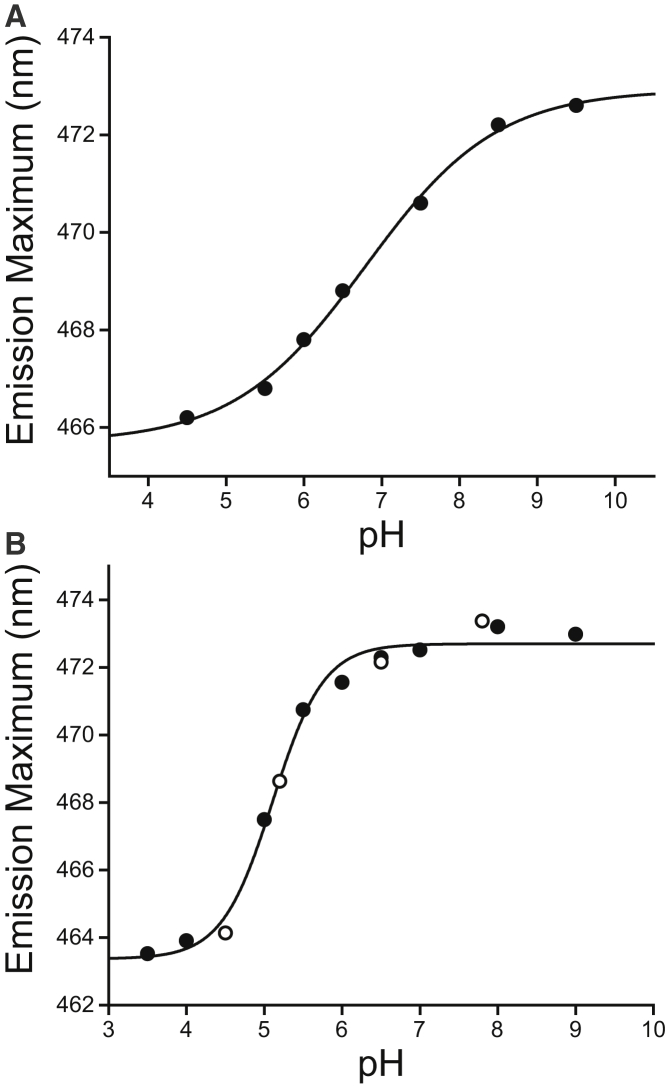
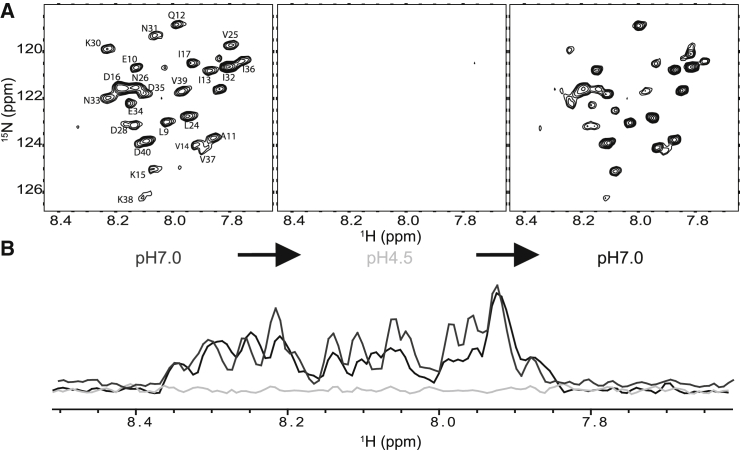
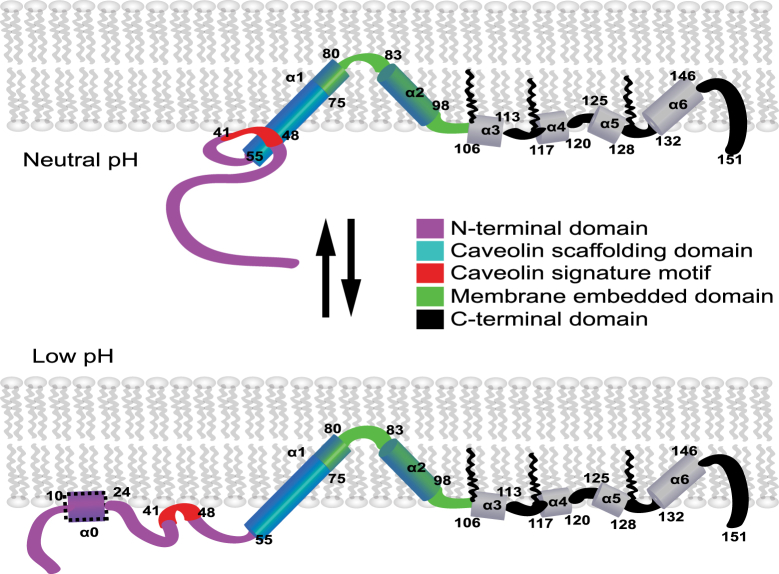
Caveolins mediate the formation of caveolae, which are small omega-shaped membrane invaginations involved in a variety of cellular processes. There are three caveolin isoforms, the third of which (Cav3) is expressed in smooth and skeletal muscles. Mutations in Cav3 cause a variety of human muscular diseases. In this work, we characterize the secondary structure, dynamics, and topology of the monomeric form of the full-length lipidated protein. Cav3 consists of a series of membrane-embedded or surface-associated helical elements connected by extramembrane connecting loops or disordered domains. Our results also reveal that the N-terminal domain undergoes a large scale pH-mediated topological rearrangement between soluble and membrane-anchored forms. Considering that roughly one-third of pathogenic mutations in Cav3 influence charged residues located in this domain, we hypothesize that this transition is likely to be relevant to the molecular basis of Cav3-linked diseases. These results provide insight into the structure of Cav3 and set the stage for mechanistic investigations of the effects of pathogenic mutations.
Copyright © 2016 Biophysical Society. Published by Elsevier Inc. All rights reserved.
Figures
Similar articles
-
Structural Interplays in the Flexible N-Terminus and Scaffolding Domain of Human Membrane Protein Caveolin 3.Membranes (Basel). 2021 Jan 22;11(2):82. doi: 10.3390/membranes11020082. Membranes (Basel). 2021. PMID: 33499357 Free PMC article.
-
Modest effects of lipid modifications on the structure of caveolin-3.Biochemistry. 2014 Jul 15;53(27):4320-2. doi: 10.1021/bi5005238. Epub 2014 Jun 26. Biochemistry. 2014. PMID: 24960539 Free PMC article.
-
Structure and topology of the transmembrane domain 4 of the divalent metal transporter in membrane-mimetic environments.Eur J Biochem. 2004 May;271(10):1938-51. doi: 10.1111/j.1432-1033.2004.04104.x. Eur J Biochem. 2004. PMID: 15128303
-
[Caveolae-invaginations in the cell membrane with complex function. Defects in caveolae gene connected to severe congenital diseases].Lakartidningen. 2010 Jun 30-Jul 20;107(26-28):1705-8. Lakartidningen. 2010. PMID: 20701151 Review. Swedish. No abstract available.
-
Caveolinopathies: translational implications of caveolin-3 in skeletal and cardiac muscle disorders.Handb Clin Neurol. 2011;101:135-42. doi: 10.1016/B978-0-08-045031-5.00010-4. Handb Clin Neurol. 2011. PMID: 21496630 Review.
Cited by
-
Structural Interplays in the Flexible N-Terminus and Scaffolding Domain of Human Membrane Protein Caveolin 3.Membranes (Basel). 2021 Jan 22;11(2):82. doi: 10.3390/membranes11020082. Membranes (Basel). 2021. PMID: 33499357 Free PMC article.
-
Seeking the Membrane-Bound Structure of the Caveolin 8S Complex.bioRxiv [Preprint]. 2025 Mar 12:2025.03.09.642159. doi: 10.1101/2025.03.09.642159. bioRxiv. 2025. Update in: J Phys Chem B. 2025 Aug 7;129(31):7932-7938. doi: 10.1021/acs.jpcb.5c01585. PMID: 40161753 Free PMC article. Updated. Preprint.
-
Seeking the Membrane-Bound Structure of the Caveolin 8S Complex.J Phys Chem B. 2025 Aug 7;129(31):7932-7938. doi: 10.1021/acs.jpcb.5c01585. Epub 2025 Jul 25. J Phys Chem B. 2025. PMID: 40709717 Free PMC article.
-
Application of Solution NMR to Structural Studies on α-Helical Integral Membrane Proteins.Molecules. 2017 Aug 15;22(8):1347. doi: 10.3390/molecules22081347. Molecules. 2017. PMID: 28809779 Free PMC article. Review.
-
Reconstitution of full-length human caveolin-1 into phospholipid bicelles: Validation by analytical ultracentrifugation.Biophys Chem. 2020 Apr;259:106339. doi: 10.1016/j.bpc.2020.106339. Epub 2020 Feb 26. Biophys Chem. 2020. PMID: 32145579 Free PMC article.
References
-
- Brown D.A., London E. Functions of lipid rafts in biological membranes. Annu. Rev. Cell Dev. Biol. 1998;14:111–136. - PubMed
-
- Parat M.O. The biology of caveolae: achievements and perspectives. Int. Rev. Cell Mol. Biol. 2009;273:117–162. - PubMed
-
- Le P.U., Guay G., Nabi I.R. Caveolin-1 is a negative regulator of caveolae-mediated endocytosis to the endoplasmic reticulum. J. Biol. Chem. 2002;277:3371–3379. - PubMed
-
- García-Cardeña G., Martasek P., Sessa W.C. Dissecting the interaction between nitric oxide synthase (NOS) and caveolin. Functional significance of the nos caveolin binding domain in vivo. J. Biol. Chem. 1997;272:25437–25440. - PubMed
Publication types
MeSH terms
Substances
Grants and funding
LinkOut - more resources
Full Text Sources
Other Literature Sources
