. 2016 Jun 8;11(6):e0157046.
doi: 10.1371/journal.pone.0157046. eCollection 2016.

Characterising the Canine Oral Microbiome by Direct Sequencing of Reverse-Transcribed rRNA Molecules

Affiliations

Characterising the Canine Oral Microbiome by Direct Sequencing of Reverse-Transcribed rRNA Molecules

James E McDonald et al. PLoS One. .

Abstract

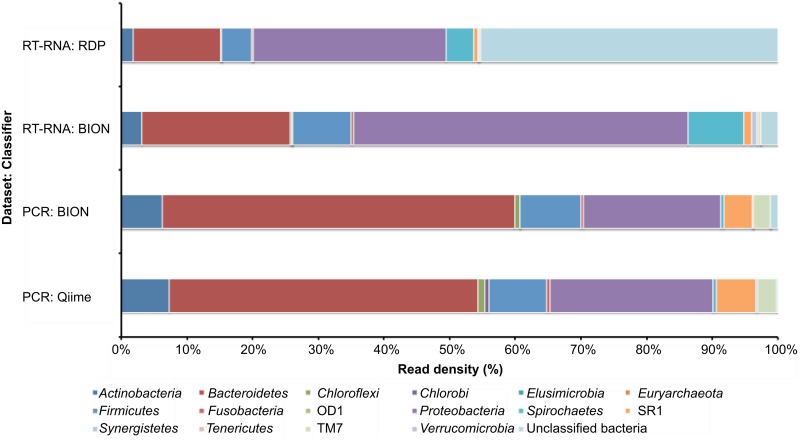
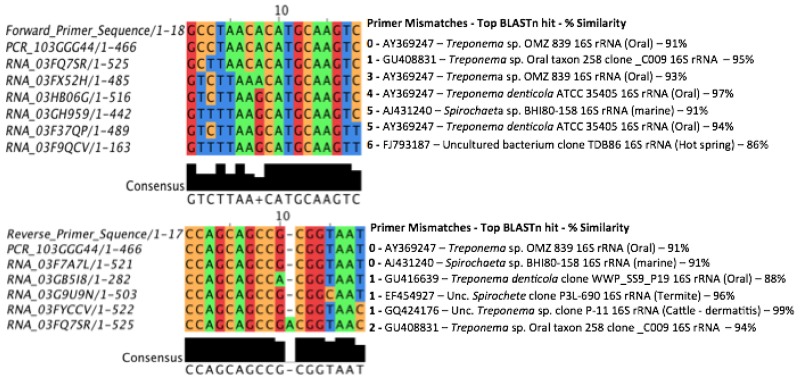
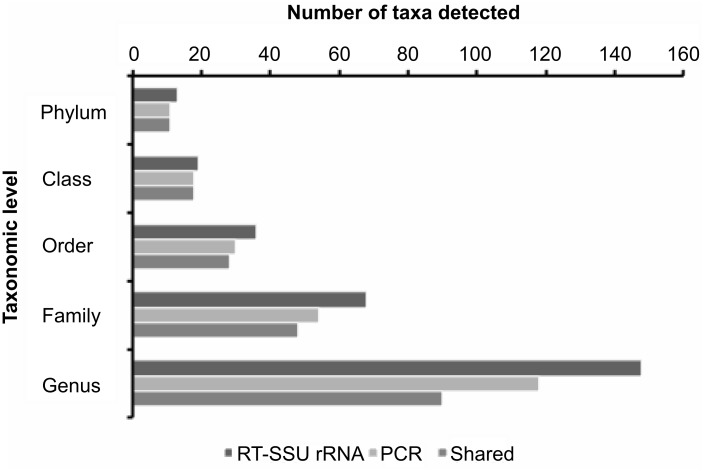
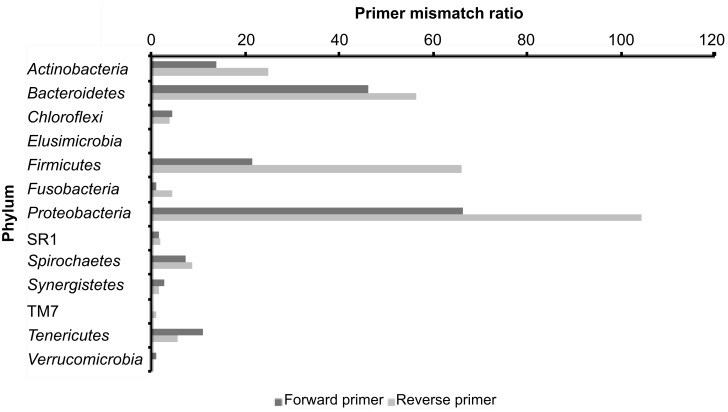
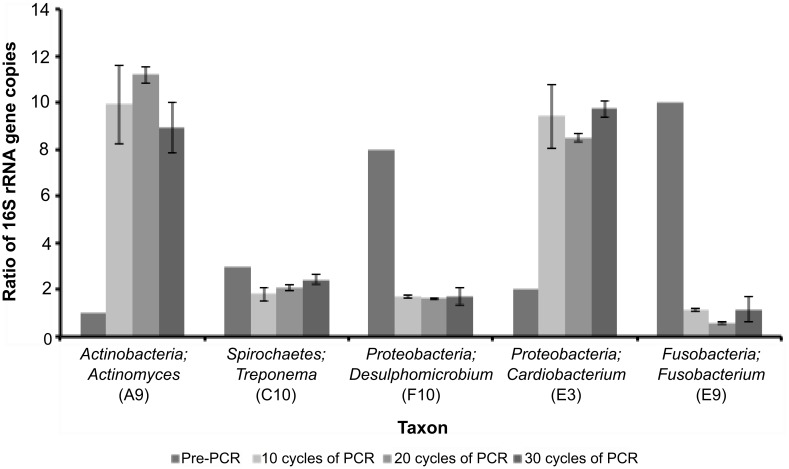
PCR amplification and sequencing of phylogenetic markers, primarily Small Sub-Unit ribosomal RNA (SSU rRNA) genes, has been the paradigm for defining the taxonomic composition of microbiomes. However, 'universal' SSU rRNA gene PCR primer sets are likely to miss much of the diversity therein. We sequenced a library comprising purified and reverse-transcribed SSU rRNA (RT-SSU rRNA) molecules from the canine oral microbiome and compared it to a general bacterial 16S rRNA gene PCR amplicon library generated from the same biological sample. In addition, we have developed BIONmeta, a novel, open-source, computer package for the processing and taxonomic classification of the randomly fragmented RT-SSU rRNA reads produced. Direct RT-SSU rRNA sequencing revealed that 16S rRNA molecules belonging to the bacterial phyla Actinobacteria, Bacteroidetes, Firmicutes, Proteobacteria and Spirochaetes, were most abundant in the canine oral microbiome (92.5% of total bacterial SSU rRNA). The direct rRNA sequencing approach detected greater taxonomic diversity (1 additional phylum, 2 classes, 1 order, 10 families and 61 genera) when compared with general bacterial 16S rRNA amplicons from the same sample, simultaneously provided SSU rRNA gene inventories of Bacteria, Archaea and Eukarya, and detected significant numbers of sequences not recognised by 'universal' primer sets. Proteobacteria and Spirochaetes were found to be under-represented by PCR-based analysis of the microbiome, and this was due to primer mismatches and taxon-specific variations in amplification efficiency, validated by qPCR analysis of 16S rRNA amplicons from a mock community. This demonstrated the veracity of direct RT-SSU rRNA sequencing for molecular microbial ecology.


Conflict of interest statement

Competing Interests: The authors have declared that no competing interests exist.

Figures

Fig 1
Fig 1. Comparison of phylum level classification of PCR amplicon and RT-SSU rRNA sequence reads derived from canine plaque samples.
BION-meta was used to classify and compare sequence reads obtained from 16S rRNA gene PCR amplicons and RT-SSU rRNA from the same canine plaque sample. In order to compare the accuracy of BION-meta, the 16S rRNA amplicon dataset was also classified using Qiime and RT-SSU rRNA using the RDP classifier. The RDP database was used as a reference dataset for sequence classification with all three classifiers (RDP classifier, BION-meta and Qiime). Sequence QC and classification statistics are provided in S1 Table.
Fig 2
Fig 2. Alignment of sequence reads from the 16S rRNA gene PCR amplicon and RT-SSU rRNA datasets classified as belonging to the phylum Spirochaetes.
Sequence reads obtained from each dataset were de-replicated using CD-HIT (http://weizhong-lab.ucsd.edu/cd-hit/) and representative sequences for each OTU group aligned against ‘good’ quality reference Spirochaete sequences from the Ribosomal Database Project website (http://rdp.cme.msu.edu/). Sequence names (left column) beginning with PCR are from the PCR amplicon dataset and sequences beginning with RNA are from the RT-SSU rRNA dataset. The column to the right of the alignment highlights the number of mismatches between the sequence group and the primer site, followed by the Genbank accession number of the closest BLASTn match to that group. The environmental source of the closest reference sequence is presented in parentheses where not stated in the BLAST description and the % similarity to our query sequence is also shown. The sequence of the forward and reverse primers used to create the PCR amplicon library (63f 5’-GCCTAACACATGCAAGTC-3' and the reverse complement of 518r 5’-ATTACCGCGGCTGCTGG-3') are shown as the top sequence in each alignment.
Fig 3
Fig 3. Comparison of the number of taxa detected at each phylogenetic rank in the 16S rRNA gene amplicon library (PCR) and the sequenced RT-SSU rRNA library (RT-rRNA) generated from canine plaque samples.
The datasets were compared using the command line RDP library compare function. Bars denote the number of taxa detected at each phylogenetic level in the RT-SSU rRNA and 16S rRNA gene amplicon dataset, respectively, and the number of taxa that were common to both datasets.
Fig 4
Fig 4. Primer mismatch ratios for phyla detected using the RT-SSU rRNA approach.
RT-SSU rRNA sequences containing regions corresponding to the forward and reverse PCR primer sites used to generate the PCR amplicon library in this study were aligned against their closest database match, and the number of insertions, deletions (indels) or mutations within the primer binding site recorded. Primer mismatch ratios were calculated by dividing the total number of sequence reads containing the primer-binding site by the total number of indels and mutations recorded within the primer binding sites of those sequences.
Fig 5
Fig 5. Quantitative PCR analysis of amplification efficiencies of an artificial microbial community comprising five cloned 16S rRNA genes of canine oral bacteria.
The artificial community was generated by mixing ratios of known gene copy number (A9, C10, F10, E3 and E9 in the ratio of 1:3:8:2:10, respectively), followed by 10, 20 or 30 cycles of PCR amplification using the universal bacterial primer set applied in this study. The resulting community PCR amplicons were subjected to qPCR analysis using clone-specific primer sets to determine the relative ratios of each clone in the final amplification mix. Error bars represent the standard error of the mean from 3 independent biological replicates. Data from each biological replicate were obtained from three experimental replicates.

References

    1. Olsen GJ, Lane DJ, Giovannoni SJ, Pace NR, Stahl DA. Microbial ecology and evolution: a ribosomal RNA approach. Annu Rev Microbiol. 1986;40: 337–365. 10.1146/annurev.mi.40.100186.002005 - DOI - PubMed
    1. Pace NR. A molecular view of microbial diversity and the biosphere. Science. 1997;276: 734–740. - PubMed
    1. Ward DM, Weller R, Bateson MM. 16S rRNA sequences reveal numerous uncultured microorganisms in a natural community. Nature. 1990;345: 63–65. 10.1038/345063a0 - DOI - PubMed
    1. Woese CR, Fox GE. Phylogenetic structure of the prokaryotic domain: the primary kingdoms. Proc Natl Acad Sci USA. 1977;74: 5088–5090. - PMC - PubMed
    1. Gilbert JA, Meyer F, Antonopoulos D, Balaji P, Brown CT, Brown CT, et al. Meeting report: the terabase metagenomics workshop and the vision of an Earth microbiome project. Stand Genomic Sci. 2010;3: 243–248. 10.4056/sigs.1433550 - DOI - PMC - PubMed