. 2016 Jun;43(6):2807-2820.
doi: 10.1118/1.4948684.

Characterizing spatiotemporal information loss in sparse-sampling-based dynamic MRI for monitoring respiration-induced tumor motion in radiotherapy

Affiliations

Characterizing spatiotemporal information loss in sparse-sampling-based dynamic MRI for monitoring respiration-induced tumor motion in radiotherapy

Tatsuya J Arai et al. Med Phys. 2016 Jun.

Abstract

Purpose: Sparse-sampling and reconstruction techniques represent an attractive strategy to achieve faster image acquisition speeds, while maintaining adequate spatial resolution and signal-to-noise ratio in rapid magnetic resonance imaging (MRI). The authors investigate the use of one such sequence, broad-use linear acquisition speed-up technique (k-t BLAST) in monitoring tumor motion for thoracic and abdominal radiotherapy and examine the potential trade-off between increased sparsification (to increase imaging speed) and the potential loss of "true" information due to greater reliance on a priori information.

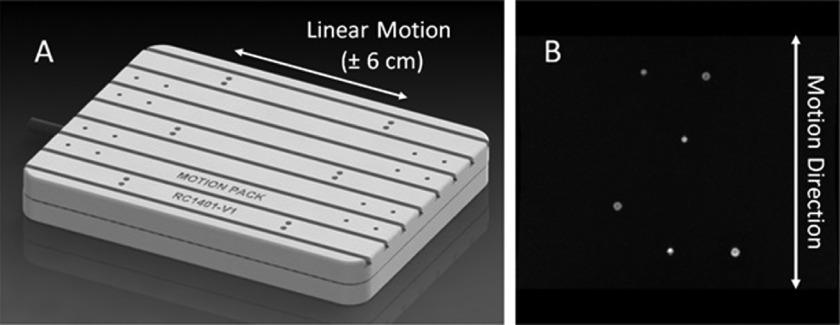
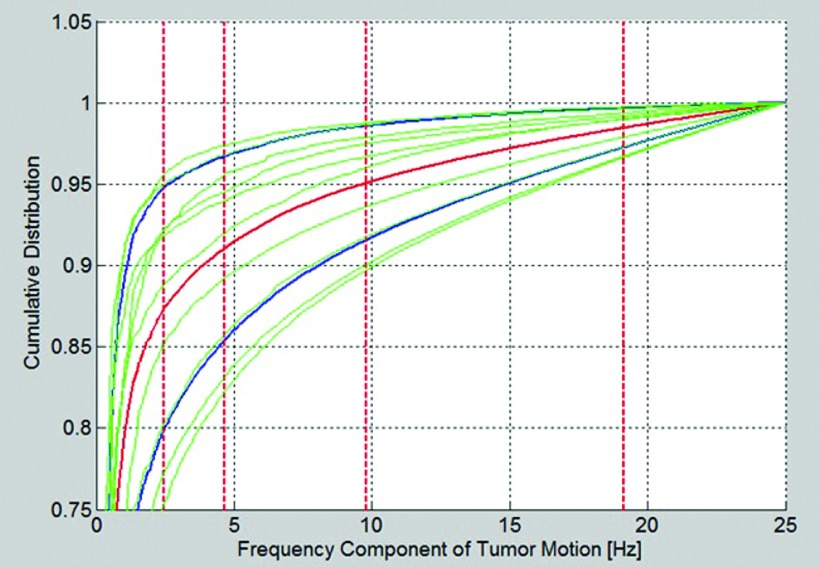
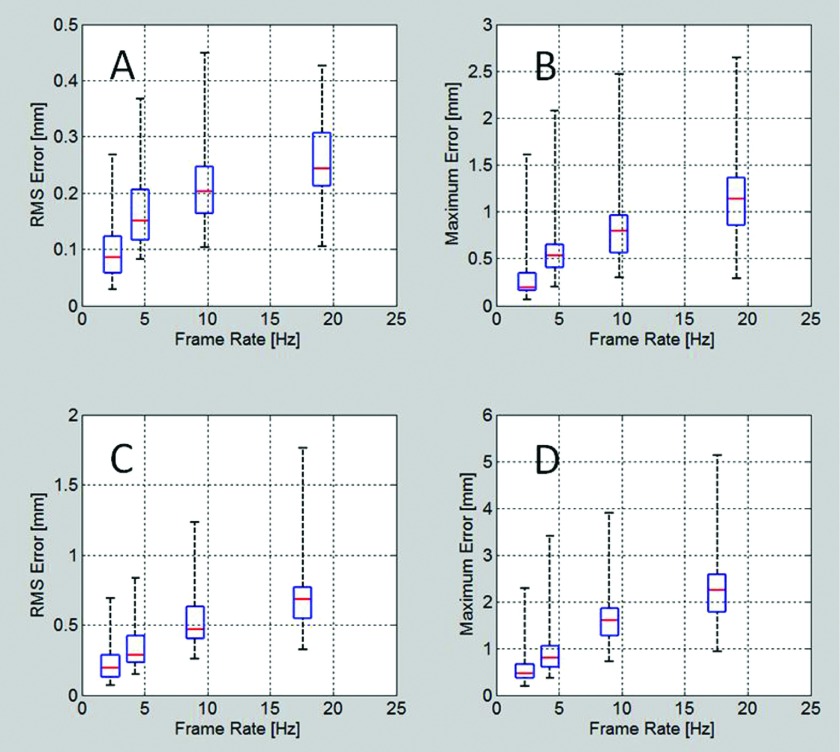
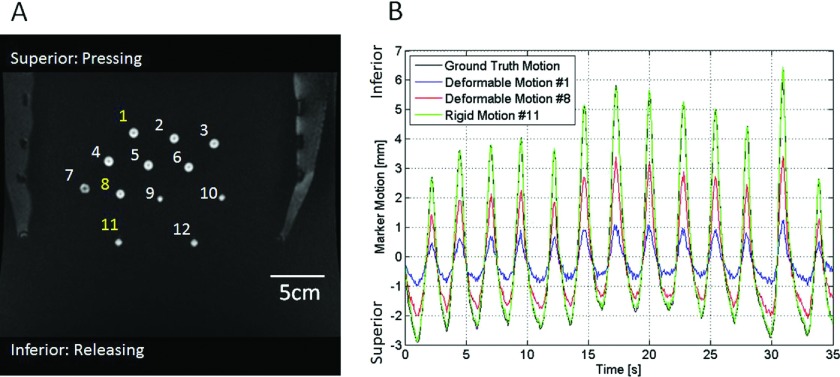
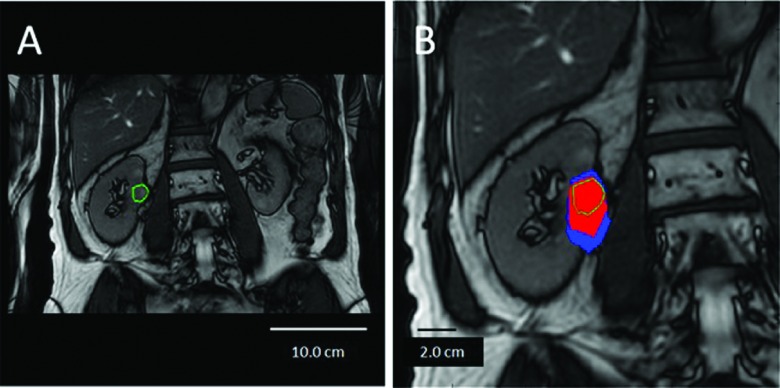
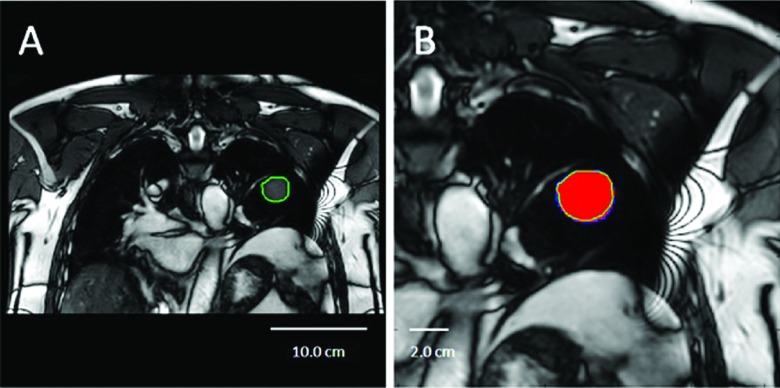
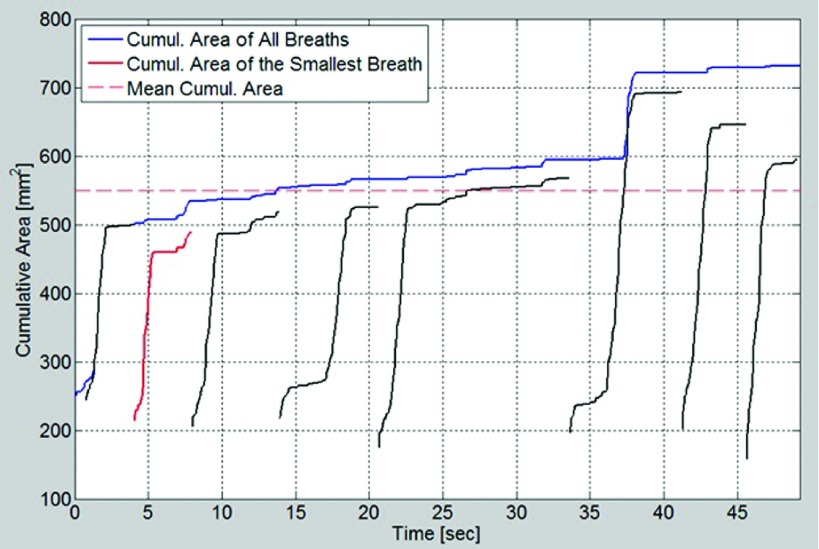
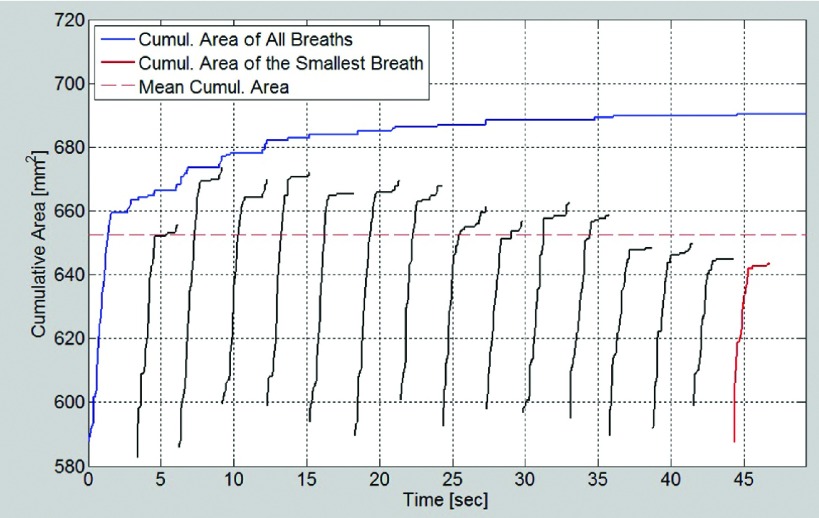
Methods: Lung tumor motion trajectories in the superior-inferior direction, previously recorded from ten lung cancer patients, were replayed using a motion phantom module driven by an MRI-compatible motion platform. Eppendorf test tubes filled with water which serve as fiducial markers were placed in the phantom. The modeled rigid and deformable motions were collected in a coronal image slice using balanced fast field echo in conjunction with k-t BLAST. Root mean square (RMS) error was used as a metric of spatial accuracy as measured trajectories were compared to input data. The loss of spatial information was characterized for progressively increasing acceleration factor from 1 to 16; the resultant sampling frequency was increased approximately from 2.5 to 19 Hz when the principal direction of the motion was set along frequency encoding direction. In addition to the phantom study, respiration-induced tumor motions were captured from two patients (kidney tumor and lung tumor) at 13 Hz over 49 s to demonstrate the impact of high speed motion monitoring over multiple breathing cycles. For each subject, the authors compared the tumor centroid trajectory as well as the deformable motion during free breathing.

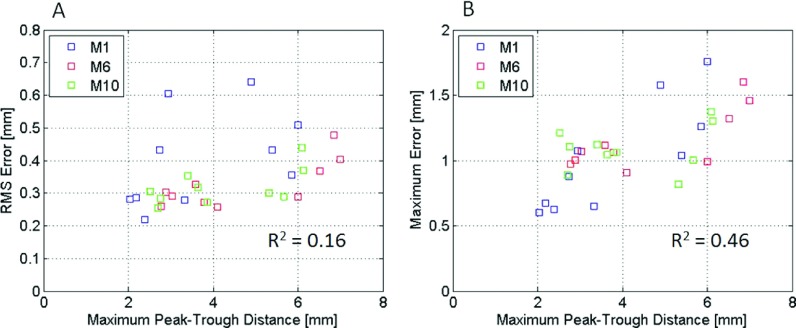
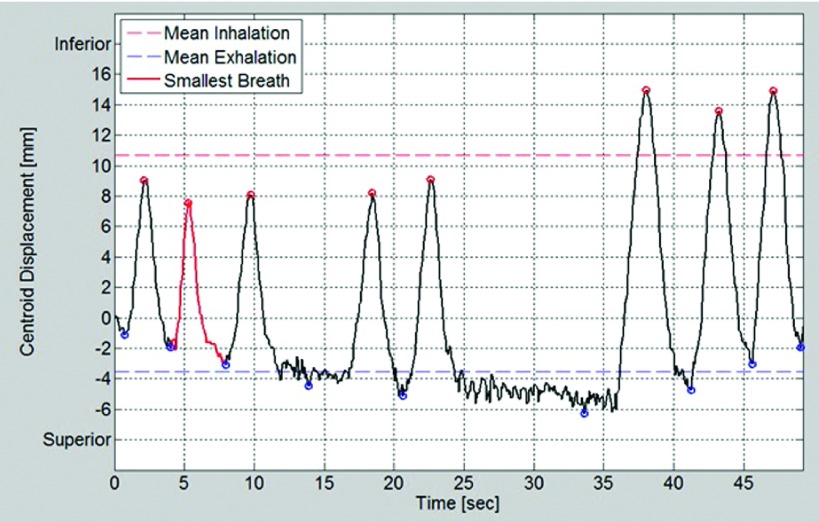
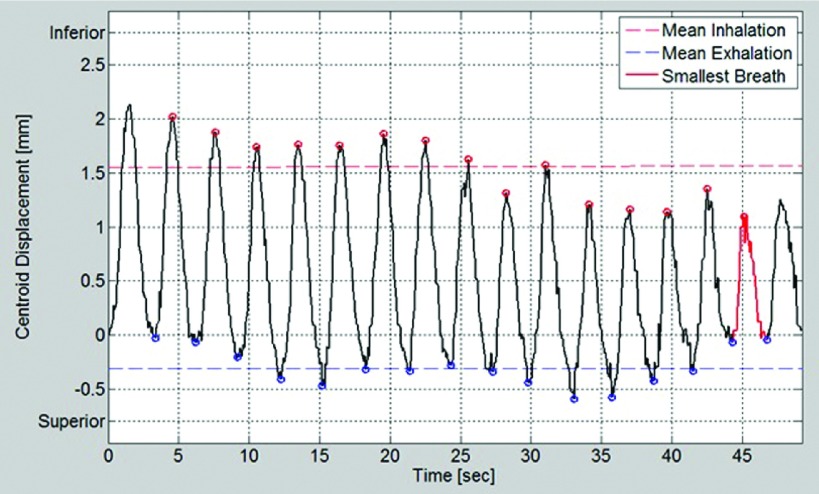
Results: In the rigid and deformable phantom studies, the RMS error of target tracking at the acquisition speed of 19 Hz was approximately 0.3-0.4 mm, which was smaller than the reconstructed pixel resolution of 0.67 mm. In the patient study, the dynamic 2D MRI enabled the monitoring of cycle-to-cycle respiratory variability present in the tumor position. It was seen that the range of centroid motion as well as the area covered due to target motion during each individual respiratory cycle was underestimated compared to the entire motion range observed over multiple breathing cycles.

Conclusions: The authors' initial results demonstrate that sparse-sampling- and reconstruction-based dynamic MRI can be used to achieve adequate image acquisition speeds without significant information loss for the task of radiotherapy guidance. Such monitoring can yield spatial and temporal information superior to conventional offline and online motion capture methods used in thoracic and abdominal radiotherapy.


Figures

FIG. 1.
FIG. 1.
(A) The MRI-compatible motion platform used in this study. Modeled lung tumor motion data in patients were programmed into the platform, enabling replication of realistic 1D tumor motion within the MR scanner. (B) Six fiducial markers were observed in a coronal MR image, and an average motion trajectory was computed from each dynamic imaging series using affine image registration of the six fiducial markers. Two arrows represent the motion direction.
FIG. 2.
FIG. 2.
Cumulative distributions of the tumor motion frequency spectrum from 0 to 25 Hz. The ten solid green lines represent individual distributions of 10 ground truth motion data. Solid red and blue lines represent the overall mean, ±SD calculated from ten individuals at a given frequency component. Four red broken vertical lines indicate four different frame rates 2.47, 4.67, 9.79, and 19.12 Hz, corresponding to k-t factors of 1, 2, 5, and 16, respectively, as the motion direction was set along frequency encoding direction. (See color online version.)
FIG. 3.
FIG. 3.
Box and Whisker plots of (A) RMS errors and (B) maximum errors between measured motion trajectories and ground truth displacement in frequency encoding direction at four different k-t acceleration factors, 1, 2, 5, and 16. (C) and (D) are also RMS and Maximum errors, respectively, in phase encoding direction at the same set of k-t acceleration factors. There were a total of 60 measured trajectories (10 motion traces × 6 fiducial markers). Red bar, two ends of box, and two whiskers correspond to median, first and third quartiles, minimum and maximum of errors presented in 60 motion data (mm). (See color online version.)
FIG. 4.
FIG. 4.
Deformable motion analysis. (A) Twelve fiducial markers in a coronal imaging plane. Ten fiducial markers (from 1 to 10) were embedded in a deformable latex foam presenting deformable motion whereas additional two markers (11 and 12) were attached to a diaphragm which traces ground truth input motion. (B) Modeled tumor respiratory motion obtained from M1 motion trajectory in superior–inferior direction. Black line: ground truth motion. Green line: rigid motion presented by marker No. 11. Blue and red lines: deformable motions presented by markers No. 1 and No. 8, respectively. (See color online version.)
FIG. 5.
FIG. 5.
The relationships between the amplitude of deformable motion and two measures of spatial errors [(A) RMS error and (B) maximum error]. The maximum peak–trough distance represents a distance between the deepest peak and the trough observed during the 25-s analysis period measured with k-t factor of 1. A total of 30 data points obtained from three independent motion trajectories were shown. As 30 data points were combined, the squared correlations were (A): 0.16 and (B): 0.46 for RMS error and maximum error, respectively.
FIG. 6.
FIG. 6.
Centroid motion trajectory of kidney tumor obtained from subject H1. Eight breathing cycles are reported (from one end-expiratory state to another, marked with open blue circles). The original kidney tumor centroid is defined with 0 mm displacement at time = 0 s. Positive and negative signs correspond to inhalation and exhalation, respectively. Solid red line: one representative respiratory cycle showing the smallest inspiratory peak to expiratory trough difference (9.54 mm). Broken red and blue lines: mean positions for open red circles and open blue circles, respectively, i.e., mean inspiratory and expiratory centroid positions. The distance between two broken lines was 14.24 mm. The SD of inspiratory peaks around the broken red line was 3.22 mm while that of expiratory peaks around the broken blue line was 1.73 mm. Maximum range of motion: the difference between the deepest inhalation and exhalation observed during the dynamic scan was 21.29 mm. This subject took a short apnea between 25 and 35 s. (See color online version.).
FIG. 7.
FIG. 7.
Centroid motion trajectory of lung tumor obtained from subject H2. Fifteen breathing cycles are reported. The solid red line represents one respiratory cycle, indicating the smallest inspiratory peak to expiratory trough difference (1.16 mm). Broken red and blue lines are mean positions of open red circles and open blue circles, respectively, indicating mean inspiratory and expiratory positions. The distance between two broken lines was 1.86 mm. The SD of inspiratory peaks around the broken red line was 0.31 mm while that of expiratory peaks around the broken blue line was 0.18 mm. The maximum range of motion was 2.73 mm. Two inspiratory peaks at 1.5 and 47.7 s and their respective breathing cycles were eliminated from the breath-by-breath analysis because the end-expiratory state could not be determined. (See color online version.)
FIG. 8.
FIG. 8.
Right kidney tumor motion within a coronal slice. (A) Abdominal image of subject H1. The image was taken at the end expiratory state, the beginning of its representative breathing cycle (solid red line in Fig. 6). Solid green outline indicates the cross section area of the kidney tumor (213.22 mm2). (B) Range of kidney tumor motion area. The solid green outline indicates the same kidney tumor location as in panel (A). The area in red depicts the range of motion during the smallest representative breathing cycle corresponding to the solid red line in Fig. 6 (487.60 mm2). The additional blue area indicates the whole extent covered by the kidney tumor during the entire dynamic image acquisition, i.e., 2D cross-sectional representation of ITV (731.12 mm2). (See color online version.)
FIG. 9.
FIG. 9.
Left lung tumor motion within a coronal slice. (A) Abdominal image of Subject H2. The image was taken at the end expiratory state, the beginning of its representative breathing cycle (solid red line in Fig. 7). The solid green outline represents the cross section area of the lung tumor (587.22 mm2). (B) Range of lung tumor motion area. The solid green outline is the same lung tumor location as in panel (A). The area in red illustrates the range of motion during the smallest representative breathing cycles corresponding to the solid red line in Fig. 7 (643.73 mm2). The additional area in blue is the full extent covered by the lung tumor during the entire dynamic image acquisition, i.e., 2D cross-sectional representation of ITV (690.33 mm2). (See color online version.)
FIG. 10.
FIG. 10.
Cumulative increases in the kidney tumor motion area recorded within each individual breath, during an entire dynamic scan. The solid black line depicts the cycle-to-cycle progressive accumulation of tumor motion area during each breath, from one end-expiratory state to another. The solid red line indicates the cumulative increase in the tumor motion area during the smallest representative breathing cycle, which corresponds to the solid red line shown in Fig. 6 (right-end value of 487.60 mm2). The solid blue line indicates the whole range of tumor motion area during a dynamic scan. The value at its right-hand end (731.12 mm2) corresponds to the combined blue and red area shown in Fig. 8(B). The broken red line illustrates the mean of eight cycle-to-cycle cumulative tumor motion areas at the end of each respiration [548.92(71.81) mm2]. (See color online version.)
FIG. 11.
FIG. 11.
Cumulative increases in the lung tumor motion area recorded within each individual breath, during an entire dynamic scan. The solid black line depicts cycle-to-cycle progressive accumulation of tumor motion area during each breath from one end-expiratory state to another. The solid red line indicates cumulative increases in the tumor motion area during the smallest representative breathing cycle, which corresponds to the solid red line shown in Fig. 7 (right-end value of 487.60 mm2). The solid blue line illustrates the whole range of the tumor motion area during the dynamic scan. The value at its right-hand end (690.34 mm2) corresponds to the blue and red area shown in Fig. 9(B). The broken red line indicates the mean of eight cycle-to-cycle cumulative tumor motion areas at the end of each respiration (652.59 (9.44) mm2). (See color online version.)

Similar articles

Cited by

References

    1. Keall P., “4-dimensional computed tomography imaging and treatment planning,” Semin. Radiat. Oncol. 14, 81–90 (2004).10.1053/j.semradonc.2003.10.006 - DOI - PubMed
    1. Mageras G. S., Pevsner A., Yorke E. D., Rosenzweig K. E., Ford E. C., Hertanto A., Larson S. M., Lovelock D. M., Erdi Y. E., Nehmeh S. A., Humm J. L., and Ling C. C., “Measurement of lung tumor motion using respiration-correlated CT,” Int. J. Radiat. Oncol., Biol., Phys. 60, 933–941 (2004).10.1016/S0360-3016(04)01078-8 - DOI - PubMed
    1. Wink N., Panknin C., and Solberg T. D., “Phase versus amplitude sorting of 4D-CT data,” J. Appl. Clin. Med. Phys. 7, 77–85 (2006).10.1120/jacmp.2027.25373 - DOI - PMC - PubMed
    1. Keall P. J., Mageras G. S., Balter J. M., Emery R. S., Forster K. M., Jiang S. B., Kapatoes J. M., Low D. A., Murphy M. J., Murray B. R., Ramsey C. R., Van Herk M. B., Vedam S. S., Wong J. W., and Yorke E., “The management of respiratory motion in radiation oncology report of AAPM Task Group 76,” Med. Phys. 33, 3874–3900 (2006).10.1118/1.2349696 - DOI - PubMed
    1. Sawant A., Keall P., Pauly K. B., Alley M., Vasanawala S., B. W. Loo, Jr., Hinkle J., and Joshi S., “Investigating the feasibility of rapid MRI for image-guided motion management in lung cancer radiotherapy,” BioMed Res. Int. 485067 (2014).10.1155/2014/485067 - DOI - PMC - PubMed

MeSH terms