. 2016 Jun;43(6):2948-2964.
doi: 10.1118/1.4948679.

Semiautomated segmentation of head and neck cancers in 18F-FDG PET scans: A just-enough-interaction approach

Affiliations

Semiautomated segmentation of head and neck cancers in 18F-FDG PET scans: A just-enough-interaction approach

Reinhard R Beichel et al. Med Phys. 2016 Jun.

Abstract

Purpose: The purpose of this work was to develop, validate, and compare a highly computer-aided method for the segmentation of hot lesions in head and neck 18F-FDG PET scans.

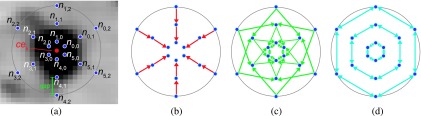
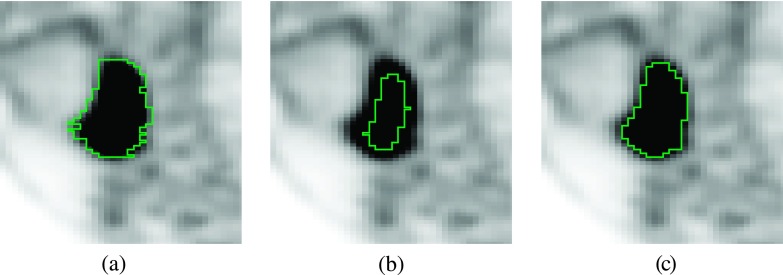
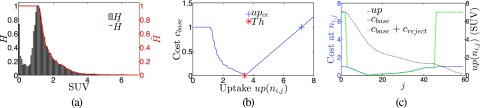
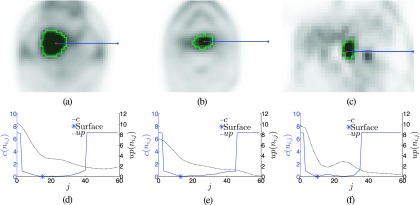
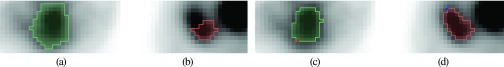
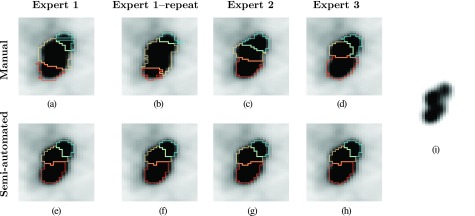
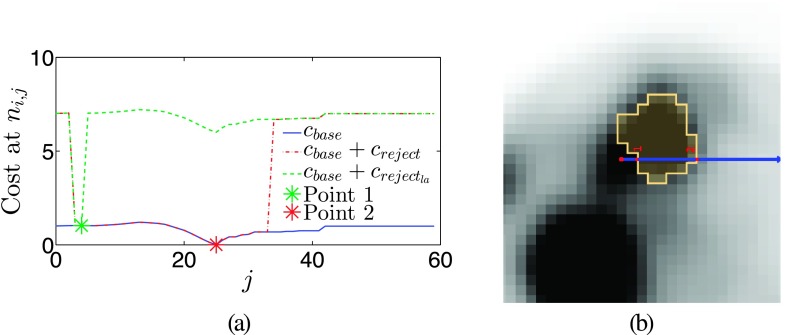
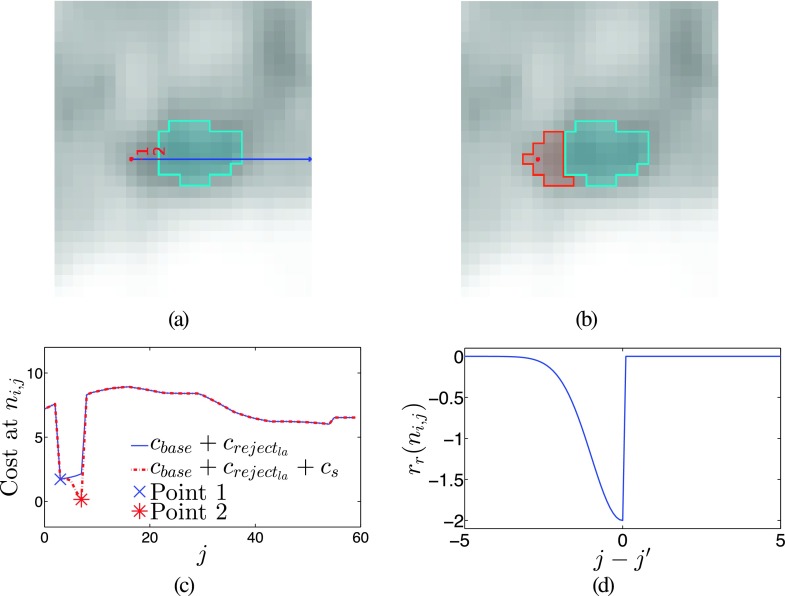
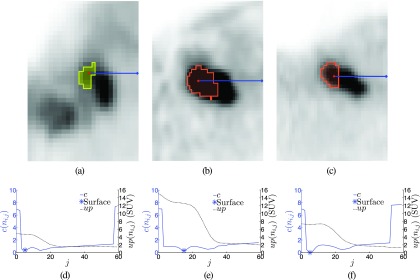
Methods: A semiautomated segmentation method was developed, which transforms the segmentation problem into a graph-based optimization problem. For this purpose, a graph structure around a user-provided approximate lesion centerpoint is constructed and a suitable cost function is derived based on local image statistics. To handle frequently occurring situations that are ambiguous (e.g., lesions adjacent to each other versus lesion with inhomogeneous uptake), several segmentation modes are introduced that adapt the behavior of the base algorithm accordingly. In addition, the authors present approaches for the efficient interactive local and global refinement of initial segmentations that are based on the "just-enough-interaction" principle. For method validation, 60 PET/CT scans from 59 different subjects with 230 head and neck lesions were utilized. All patients had squamous cell carcinoma of the head and neck. A detailed comparison with the current clinically relevant standard manual segmentation approach was performed based on 2760 segmentations produced by three experts.

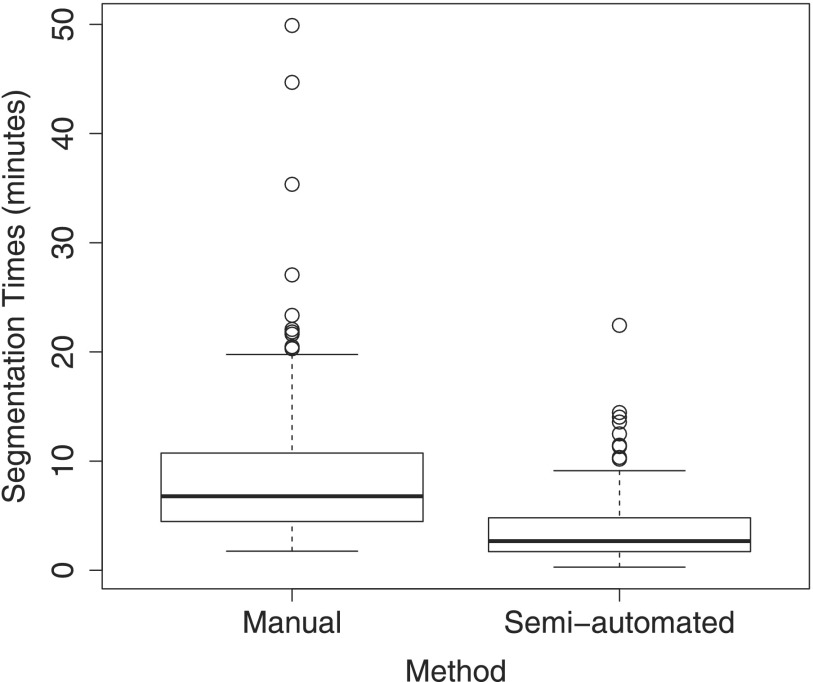
Results: Segmentation accuracy measured by the Dice coefficient of the proposed semiautomated and standard manual segmentation approach was 0.766 and 0.764, respectively. This difference was not statistically significant (p = 0.2145). However, the intra- and interoperator standard deviations were significantly lower for the semiautomated method. In addition, the proposed method was found to be significantly faster and resulted in significantly higher intra- and interoperator segmentation agreement when compared to the manual segmentation approach.

Conclusions: Lack of consistency in tumor definition is a critical barrier for radiation treatment targeting as well as for response assessment in clinical trials and in clinical oncology decision-making. The properties of the authors approach make it well suited for applications in image-guided radiation oncology, response assessment, or treatment outcome prediction.


Figures

FIG. 1.
FIG. 1.
Examples depicting the complexity of HNC segmentation in FDG PET scans. [(a)–(c)] Volume rendering of PET scans, showing the primary cancer [arrow in (d)–(i)] and lymph nodes with uptake. [(d)–(f)] Rendering of segmentations of individual lesions shown in (a)–(c) combined with a volume rendering of the corresponding PET volume. [(g)–(i)] Examples of PET cross sections with outlined tumor segmentations. (g) Necrotic primary tumor with metabolically active adjacent lymph node. [(h) and (i)] Cases with multiple lesions and varying degrees of tracer uptake.
FIG. 2.
FIG. 2.
Graph construction for OSS. (a) Centerpoint cek and utilized node structure; the spherical mesh is symbolized by a circle. For each node, a cost is assigned. (b) Intracolumn edge structure (red) with infinite capacity, pointing toward the center. [(c) and (d)] Intercolumn edge structure. (c) The hard smoothness constraint is implemented by introducing edges with infinite capacity shown in green. (d) The soft smoothness constraint is implemented by introducing bidirectional edges with low finite capacity shown in cyan. (See color online version.)
FIG. 3.
FIG. 3.
Comparison of PET segmentation approaches. The same sagittal cross section is shown for all segmentations. (a) Manual slice-by-slice segmentation result. (b) Result of a 50% isocontour segmentation approach. (c) Result of proposed graph-based segmentation method.
FIG. 4.
FIG. 4.
Calculation of local image statistics. (a) Plot of upΩ with points of interest pe and kn. (b) The gradient of upΩ. (c) The gradient with added center bias to detect jlow. (d) Deriving jhi from upΩ˜. Points on the curve that are labeled with low and hi mark the location of indices jlow and jhi, respectively.
FIG. 5.
FIG. 5.
Plot of Th% as a function of γ.
FIG. 6.
FIG. 6.
Cost function design. (a) Histogram H of a region around a typical lesion with corresponding envelope function H˜. (b) Example of a cost function; the individual components are clearly visible. The left part follows H˜, while the right part is linear. The lowest point where both parts meet is at Th. (c) Example of a typical cost profile with and without creject on a single column i, as a function of j, paired with the uptake along the column.
FIG. 7.
FIG. 7.
Examples of lesion segmentation results. [(a)–(c)] Segmentation results with a marked column along the x-axis. [(d)–(f)] Plots of the uptake and cost function corresponding to (a)–(c).
FIG. 8.
FIG. 8.
Examples of JEI-based segmentation refinement. (a) The segmentation surface expanded outward too much. (b) A part of the lesion was excluded. (c) The segmentation shown in (a) is corrected with one mouse click by using the global refinement option, affecting the whole boundary. (d) The segmentation shown in (b) is corrected with one mouse click by using local refinement, affecting only a local portion of the boundary. (See color online version.)
FIG. 9.
FIG. 9.
Examples illustrating local refinement. (a) In this example, the vector around REl on the column marked Ci+3 is compared to vectors on adjacent columns within range to find the best match for the refinement. Note that the vector is smaller than in practice and for simplicity, only columns in a plane are shown. (b) Illustration of BFS to find neighboring columns whose costs need to be adapted. Note that in this case, comparisons are based on column Ci.
FIG. 10.
FIG. 10.
Range of complexity of utilized H&N PET image data. (a) Case with low complexity (single primary tumor) and (b) a case with high complexity with primary cancer and multiple hot lymph nodes in close proximity.
FIG. 11.
FIG. 11.
Example of an indicator image provided to experts to specify what lesions should be segmented and the label (seven in this case) that should be assigned.
FIG. 12.
FIG. 12.
Example of intra- and interoperator segmentation agreement for manual and semiautomated segmentation methods. [(a)–(d)] Manual slice-by-slice segmentation results. [(e)–(h)] Semiautomated full 3D segmentation results. (i) Same PET image as in images (a)–(h), but with a different grey-value transfer function, showing uptake peaks corresponding to individual lymph nodes in close proximity.
FIG. 13.
FIG. 13.
Boxplots of operator segmentation times for the manual and semiautomated segmentation methods per PET scan.
FIG. 14.
FIG. 14.
Plots showing the accumulative number of cases completely segmented in dependence of number of user actions required for the semiautomated method for experts one, two and three. “All actions” denotes the number of actions actually performed by the expert, and “final actions” denotes the user actions that were actually required to perform the segmentations (i.e., undone actions are not counted).
FIG. 15.
FIG. 15.
The effect of label avoidance on the cost function c. (a) Costs due to label avoidance along an axis, from cek. Both creject and crejectla reject the first few nodes, but crejectla also begins to reject as soon as it encounters the other object label. The two points indicate the different low points in the cost function. (b) The axis on which the costs are changed with the same two points marked.
FIG. 16.
FIG. 16.
An example of a lesion with no real feature between its center and an adjacent lesion. (a) The graph center cek and the other lesion in light blue. (b) The segmentation showing the sealing effect of label avoidance. (c) The cost change due to cs for the marked axis. (d) The general shape of the cost change. (See color online version.)
FIG. 17.
FIG. 17.
Segmenting a hot lymph node in close proximity to another hot node. (a) A segmentation produced in splitting mode with a single node column marked in blue. (b) Image as in (a), but with adjusted grey-value transfer function to better show the separation between the nodes. (c) Strong and (d) weak watersheds with cek marked in red. Note that voxels with an uptake below Th are blacked out, since they do not affect the segmentation. (e) Additional cost components due to activated splitting option. (f) All components are added together with the base cost, resulting in the modified cost term; the corresponding segmentation is shown in (a). (See color online version.)
FIG. 18.
FIG. 18.
Examples of segmentations generated by using the splitting mode option. [(a)–(c)] Segmentations with one node column highlighted in blue. [(d)–(f)] Uptake and cost profiles corresponding to (a)–(c).

References

    1. Fletcher J. W., Djulbegovic B., Soares H. P., Siegel B. A., Lowe V. J., Lyman G. H., Coleman R. E., Wahl R., Paschold J. C., Avril N., Einhorn L. H., Suh W. W., Samson D., Delbeke D., Gorman M., and Shields A. F., “Recommendations on the use of 18F-FDG PET in oncology,” J. Nucl. Med. 49, 480–508 (2008).10.2967/jnumed.107.047787 - DOI - PubMed
    1. Leemans C. R., Braakhuis B. J. M., and Brakenhoff R. H., “The molecular biology of head and neck cancer,” Nat. Rev. Cancer 11, 9–22 (2011).10.1038/nrc2982 - DOI - PubMed
    1. Gillison M. L., “Human papillomavirus-associated head and neck cancer is a distinct epidemiologic, clinical, and molecular entity,” Semin. Oncol. 31, 744–754 (2004).10.1053/j.seminoncol.2004.09.011 - DOI - PubMed
    1. Edge S. B. and A. J. C. on Cancer, AJCC Cancer Staging Manual, 7th ed. (Springer, New York, 2010), pp. xiv, 648 p.
    1. Som P. M., Curtin H. D., and Mancuso A. A., “Imaging-based nodal classification for evaluation of neck metastatic adenopathy,” Am. J. Roentgenol. 174, 837–844 (2000).10.2214/ajr.174.3.1740837 - DOI - PubMed

LinkOut - more resources