. 2016 Jun 8;36(23):6147-55.
doi: 10.1523/JNEUROSCI.4590-15.2016.

Task Encoding across the Multiple Demand Cortex Is Consistent with a Frontoparietal and Cingulo-Opercular Dual Networks Distinction

Affiliations

Task Encoding across the Multiple Demand Cortex Is Consistent with a Frontoparietal and Cingulo-Opercular Dual Networks Distinction

Ben M Crittenden et al. J Neurosci. .

Erratum in

Abstract

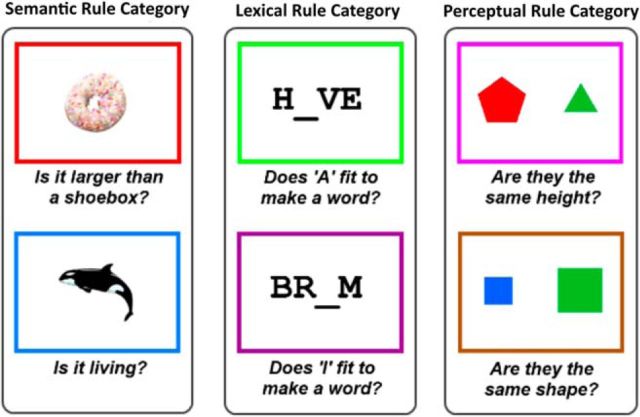
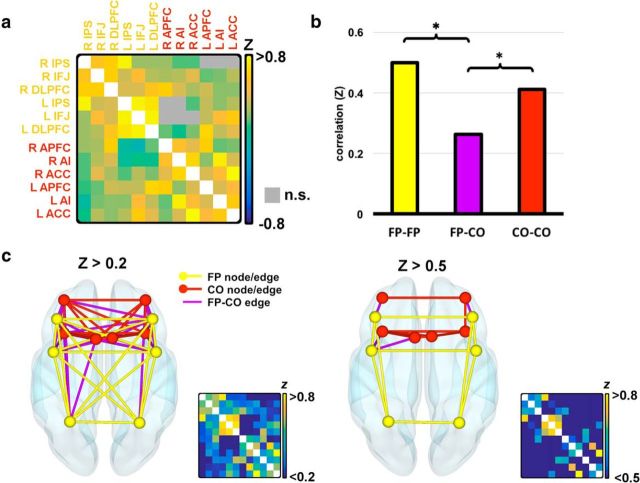
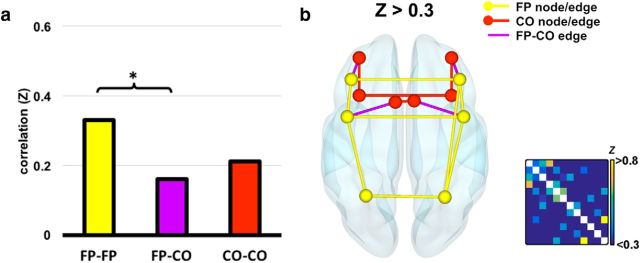
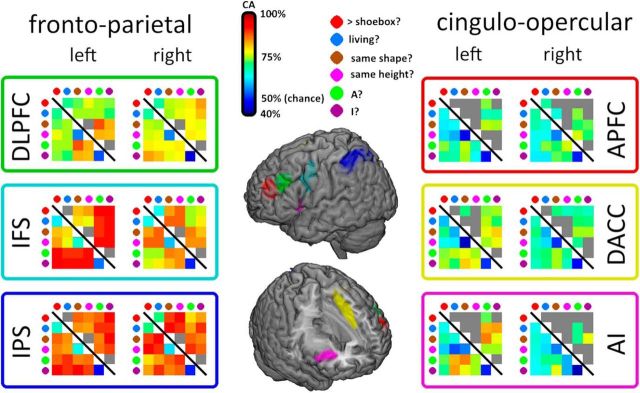
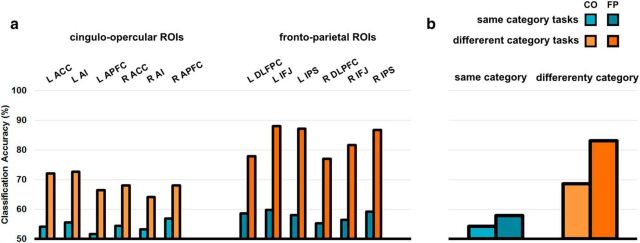
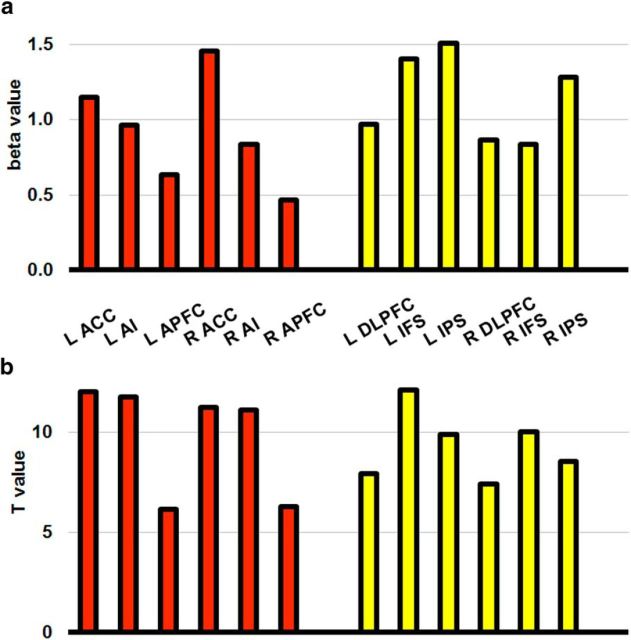
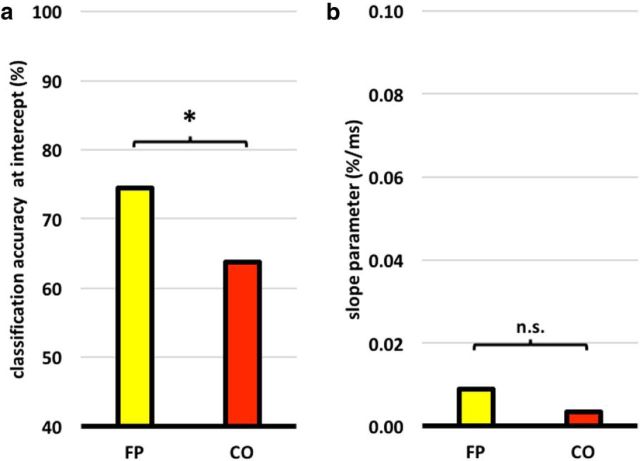
Multiple-demand (MD) regions of the human brain show coactivation during many different kinds of task performance. Previous work based on resting-state functional magnetic resonance imaging (fMRI) has shown that MD regions may be divided into two closely coupled subnetworks centered around the lateral frontoparietal (FP) and cingulo-opercular cortex. Here, we used on-task fMRI to test whether this division is apparent during the performance of an executive task. Furthermore, we investigated whether there is a difference in the encoding of task between the two subnetworks. Using connectivity methods, we found that activity across the entire MD cortex is correlated during task performance. Meanwhile, however, there was significantly stronger connectivity within each of the subnetworks than between them. Using multivoxel pattern analysis, we also found that, although we were able to decode task-relevant information from all regions of the MD cortex, classification accuracy scores were significantly higher in the FP subnetwork. These results suggest a nested picture with MD regions as a whole showing coactivation and broad rule representation, but with significant functional distinctions between component subnetworks.

Significance statement: Multiple-demand (MD) regions of frontal and parietal cortex appear essential for the orchestration of goal-directed behavior and problem solving. Understanding the relative specialization of regions within the MD cortex is crucial to understanding how we can coordinate and execute complex action plans. By examining functional connectivity during task performance, we extend previous findings suggesting that the MD cortex can be divided into two subnetworks centered around the frontoparietal (FP) and cingulo-opercular (CO) cortex. Furthermore, using multivoxel pattern analysis, we show that, compared with the CO subnetwork, the FP subnetwork manifests more differentiated coding of specific task events.

Keywords: cognitive control; dual networks; executive function; multiple demand.


Figures

Figure 1.
Figure 1.
Task rules. Subjects were trained to associate six different task rules with the color of a border surrounding the trial stimuli. Rules were grouped into three categories—semantic, lexical, and perceptual—with two alternative rules per category.
Figure 2.
Figure 2.
Functional connectivity between MD ROIs. a, Fisher-transformed correlation values (Z) between all ROIs. Gray squares above the diagonal represent nonsignificant correlations. b, Mean connectivity strength within each subnetwork and between the two subnetworks. Connections between hemispheric homologs (e.g., DLPFC–DLPFC) were not included. Significant differences at the level p < 0.05 are shown. c, Graphs resulting from a threshold of Z > 0.2 and Z > 0.5. Yellow nodes and lines represent the FP ROIs and the surviving connections between them. Red nodes and lines represent the CO ROIs and the surviving connections between them. Purple lines represent surviving connections between the two subnetworks. The smaller correlation matrix is the thresholded and rescaled version of the matrix shown in a. All values below the threshold are shown as dark blue as given by the color scale.
Figure 3.
Figure 3.
Functional connectivity of residual activity between MD ROIs. a, Mean connectivity within each subnetwork and between the two subnetworks. Significant differences at the level p < 0.05 are shown. b, Graph resulting from a threshold of Z > 0.3. For conventions, see Figure 2.
Figure 4.
Figure 4.
Task decoding across the multiple demand ROIs. The MD ROIs are shown on the central brain rendering. Results for FP ROIs are shown on the left and those for CO ROIs on the right. Within each ROI, each colored matrix shows mean CA for all task pairs averaged across participants. The bottom left of each matrix shows all CAs; the top right shows the same CAs but with nonsignificant CAs greyed out.
Figure 5.
Figure 5.
Task decoding in FP and CO subnetworks. Blue indicates similar task decoding; orange dissimilar task decoding. Lighter colors indicate CO ROI and darker colors FP ROIs. a, Mean classification accuracy across subjects associated with each ROI separately for similar and dissimilar tasks. CO ROIs are shown on the left, FP ROIs on the right. b, Mean classification accuracies after averaging over CO and FP ROIs.
Figure 6.
Figure 6.
Univariate activity across the MD ROIs. a, Mean task-related change in β values relative to baseline in each of the MD ROIs across participants. Results show that all regions were more active when engaged on the task, but there is no clear difference in activation between the two subnetworks. b, t-values from a two-tailed, paired t test of β values shown in a against the implicit baseline across participants. Similar t-values give an indication that the signal-to-noise ratio of the univariate signal is comparable across the two subnetworks.
Figure 7.
Figure 7.
Mean parameter estimates of α and β after regression of classification accuracy on absolute response time differences. a, Mean value of α across participants for each of the two subnetworks. α values for both subnetworks were significantly greater than chance (50%) at the p < 0.05 level. b, Mean value of β across participants for each of the two subnetworks. Neither was significantly greater than 0.

References

    1. Brainard DH. The Psychophysics Toolbox. Spat Vis. 1997;10:433–436. doi: 10.1163/156856897X00357. - DOI - PubMed
    1. Buschman TJ, Denovellis EL, Diogo C, Bullock D, Miller EK. Synchronous oscillatory neural ensembles for rules in the prefrontal cortex. Neuron. 2012;76:838–846. doi: 10.1016/j.neuron.2012.09.029. - DOI - PMC - PubMed
    1. Cabeza R, Nyberg L. Imaging cognition II: An empirical review of 275 PET and fMRI studies. J Cogn Neurosci. 2000;12:1–47. - PubMed
    1. Christophel TB, Hebart MN, Haynes JD. Decoding the contents of visual short-term memory from human visual and parietal cortex. J Neurosci. 2012;32:12983–12989. doi: 10.1523/JNEUROSCI.0184-12.2012. - DOI - PMC - PubMed
    1. Cole MW, Schneider W. The cognitive control network: Integrated cortical regions with dissociable functions. Neuroimage. 2007;37:343–360. doi: 10.1016/j.neuroimage.2007.03.071. - DOI - PubMed

Publication types

MeSH terms

LinkOut - more resources