. 2016 Aug;19(8):899-906.
doi: 10.1111/ele.12626. Epub 2016 Jun 9.

Environmental changes define ecological limits to species richness and reveal the mode of macroevolutionary competition

Affiliations

Environmental changes define ecological limits to species richness and reveal the mode of macroevolutionary competition

Thomas H G Ezard et al. Ecol Lett. 2016 Aug.

Erratum in

Abstract

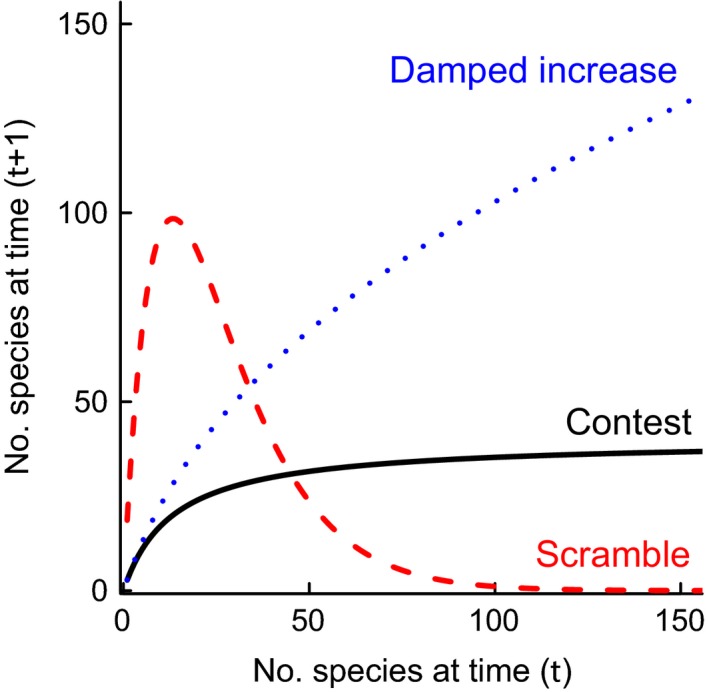
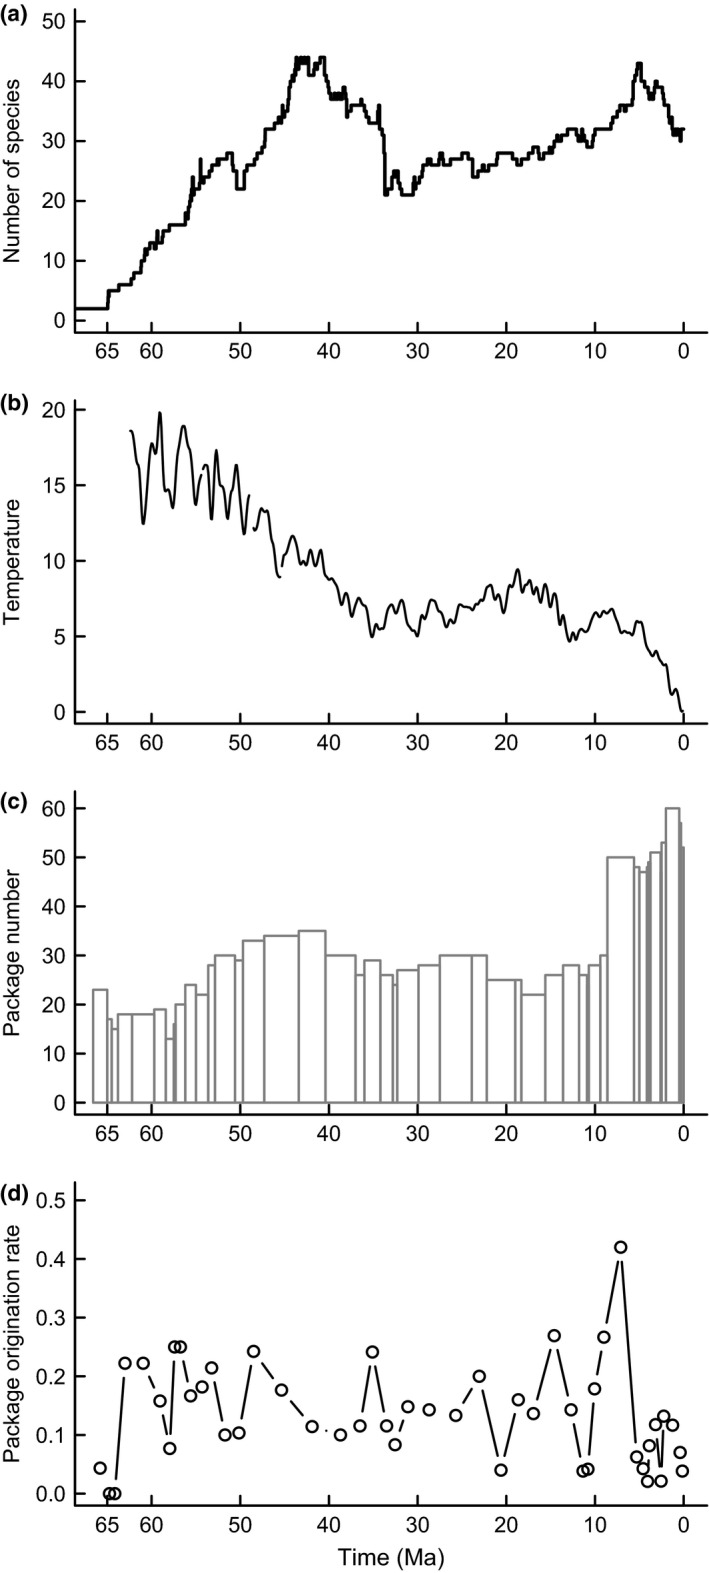
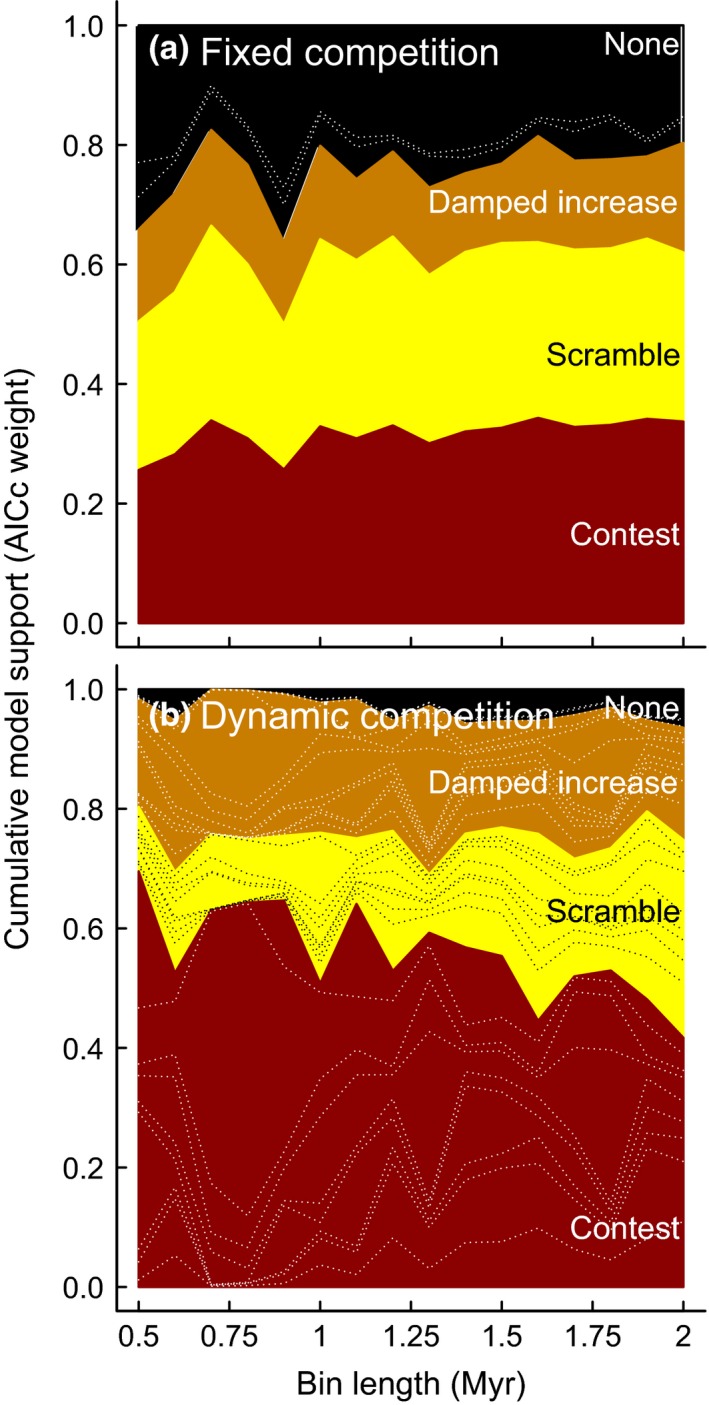
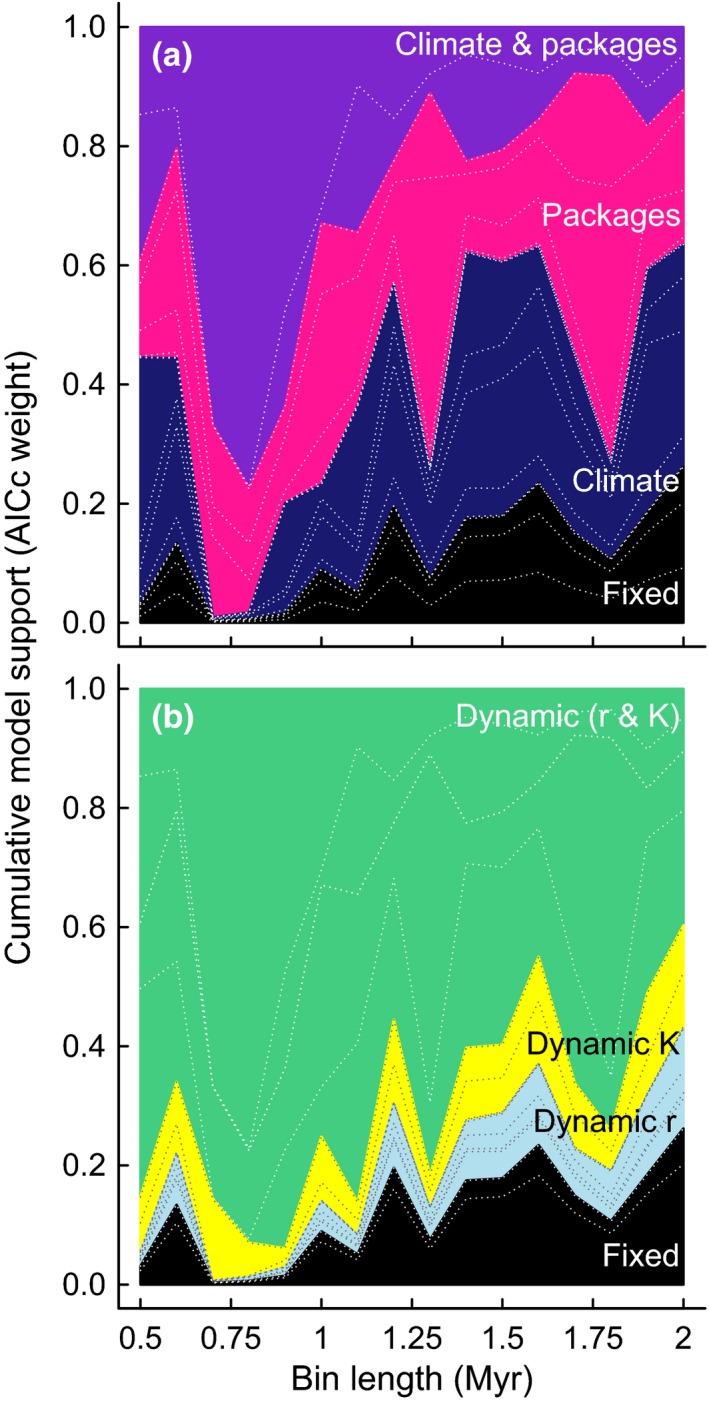
Co-dependent geological and climatic changes obscure how species interact in deep time. The interplay between these environmental factors makes it hard to discern whether ecological competition exerts an upper limit on species richness. Here, using the exceptional fossil record of Cenozoic Era macroperforate planktonic foraminifera, we assess the evidence for alternative modes of macroevolutionary competition. Our models support an environmentally dependent macroevolutionary form of contest competition that yields finite upper bounds on species richness. Models of biotic competition assuming unchanging environmental conditions were overwhelmingly rejected. In the best-supported model, temperature affects the per-lineage diversification rate, while both temperature and an environmental driver of sediment accumulation defines the upper limit. The support for contest competition implies that incumbency constrains species richness by restricting niche availability, and that the number of macroevolutionary niches varies as a function of environmental changes.

Keywords: Beverton-Holt; Ricker; contest competition; diversification; diversity-dependence; ecological limits; microfossil; scramble competition.


Figures

Figure 1
Figure 1
Schematic of contest (black solid line), scramble (red dashed line) and damped increase (blue dotted line) dynamics. Two dynamical features indicate scramble rather than contest competition: more rapid growth at low diversity and abrupt extinction pulses of negative, rather than zero, net change at high diversity (forms of contest competition are always non‐decreasing). Parameters (see Table 1): k 1 = 3, = 40, k 2 = r/K = 0.075 and = 0.5. r is the per‐lineage diversification rate, K the finite upper ecological limit and c the competition coefficient.
Figure 2
Figure 2
The raw data: (a) the number of evolutionary species of macroperforate planktonic foraminifera (Aze et al. 2011); (b) the deep sea temperature reconstruction from Mg/Ca isotopes compiled by Cramer et al. (2011); the (c) number of packages (Peters et al. 2013) and (d) the rate of package origination per geological zone (Peters et al. 2013).
Figure 3
Figure 3
Akaike (AICc) weights indicate a signature of biotic competition assuming constant (a) and dynamic (b) functional forms (Table 1). While support for scramble is slightly greater than contest competition assuming fixed parameters, the reverse is true once the parameters vary with environmental change. Akaike weights can be interpreted as the probability that a given model is correct given those being compared. Dashed lines indicate support for particular models. See Supporting Information Table S1 for AICc scores, which, unlike Akaike weights, vary systematically with bin size (Fig S1).
Figure 4
Figure 4
Akaike (AICc) weights for model combinations grouped by (a) whether geological and/or climatic change leaves a signature in the diversity dynamics or (b) whether diversification rate r and/or upper ecological limit K responds to climatic and/or geological change. Gaps between dashed lines give the support for particular models within the grouping – the model class with most support (package‐related upper ecological limit and temperature‐related diversification rate) is above the highest dashed line in both panels. Akaike weights can be interpreted as the probability that a given model is correct given those being compared. See Tables S1–S4 for AICc scores, which, unlike Akaike weights, vary systematically with bin size (Fig. S1).
Figure 5
Figure 5
Model‐averaged predictions explain at least 80% of the observed variation in species richness from one time bin to the next (top row; the dashed line is y = x, i.e. a perfect fit) and the residuals do not indicate a temporal pattern to any error (bottom row; the dashed line is a residual of 0, i.e. a perfect fit). There is no evidence of autocorrelation in the model‐averaged residuals (Fig. S7). As bin size decreases, the variance explained by the model‐averaged predictions increases to 95%, which reiterates the importance of high‐resolution analysis to unpick co‐dependent geological, biological and climatic dynamics.

References

    1. Allen, A.P. , Gillooly, J. , Savage, V. & Brown, J.H. (2006). Kinetic effects of temperature on rates of genetic divergence and speciation. Proc. Natl Acad. Sci. USA, 103, 9130–9135. - PMC - PubMed
    1. Alroy, J. (1996). Constant extinction, constrained diversification, and uncoordinated stasis in North American mammals. Palaeogeog., Palaeoclimatol., Palaeoecol., 127, 285–311.
    1. Alroy, J. (2010). The shifting balance of diversity among major marine animal groups. Science, 329, 1191–1194. - PubMed
    1. Alroy, J. , Marshall, C.R. , Bambach, R.K. , Bezusko, K. , Foote, M. , Fürsich, F.T. et al (2001). Effects of sampling standardization on estimates of Phanerozoic marine diversification. Proc. Natl Acad. Sci. USA, 98, 6261–6266. - PMC - PubMed
    1. Aze, T. , Ezard, T.H.G. , Purvis, A. , Coxall, H.K. , Stewart, D.R.M. , Wade, B.S. et al (2011). A phylogeny of Cenozoic macroperforate planktonic foraminifera from fossil data. Biol. Rev., 86, 900–927. - PubMed

Publication types