. 2017 Mar;35(3):590-599.
doi: 10.1002/jor.23327. Epub 2017 Jan 30.

Time-dependent loss of mitochondrial function precedes progressive histologic cartilage degeneration in a rabbit meniscal destabilization model

Affiliations

Time-dependent loss of mitochondrial function precedes progressive histologic cartilage degeneration in a rabbit meniscal destabilization model

Jessica E Goetz et al. J Orthop Res. 2017 Mar.

Abstract

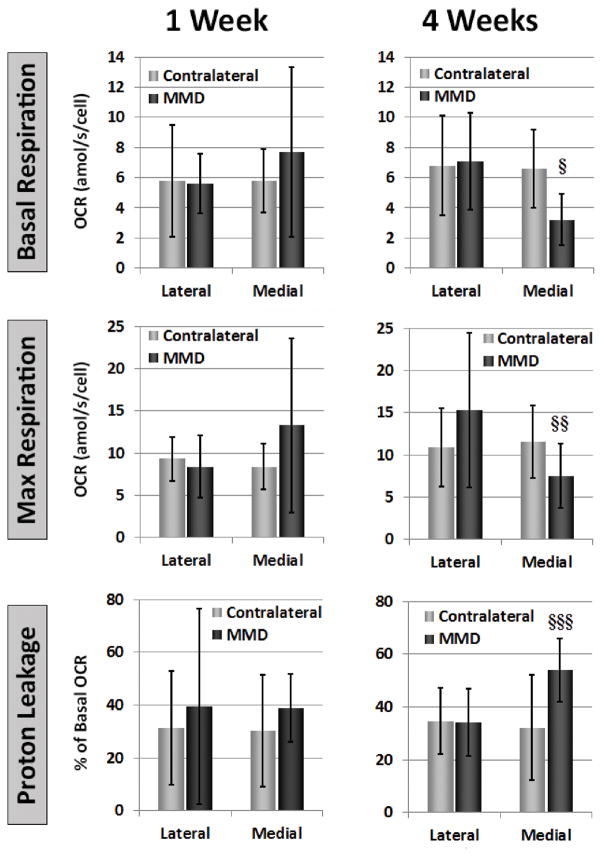
The goals of this work were to characterize progression of osteoarthritic cartilage degeneration in a rabbit medial meniscus destabilization (MMD) model and then to use the model to identify pre-histologic disruptions in chondrocyte metabolism under chronically elevated joint contact stresses in vivo. To characterize PTOA progression, 24 rabbits received either MMD or sham surgery. Limb loading was analyzed preoperatively and at regular postoperative intervals using a Tekscan pressure-sensitive walkway. Animals were euthanized 8 (n = 8 MMD; n = 8 sham) or 26 weeks (n = 8 MMD) postoperatively for histological cartilage evaluation by an objective, semi-automated Mankin scoring routine. To examine pre-histologic pathology, MMD was performed on an additional 20 rabbits, euthanized 1 (n = 9) or 4 weeks (n = 10) postoperatively. Chondrocytes were harvested fresh for measurement of mitochondrial function, an intracellular indicator of pathology after mechanical injury. Both MMD and sham surgery caused slight decreases in limb loading which returned to preoperative levels after 2 weeks. Histologically apparent cartilage damage progressed from 8 to 26 weeks after MMD. Changes in chondrocyte respiration were variable at 1 week, but by 4 weeks postoperatively chondrocyte mitochondrial function was significantly reduced. Many human injuries that lead to PTOA are relatively mild, and the cell-level mechanisms leading to disease remain unclear. We have documented PTOA progression in an animal model of subtle joint injury under continued use, and demonstrated that this model provides a realistic environment for investigation of multi-stage cellular pathology that develops prior to overt tissue degeneration and which could be targeted for disease modifying treatments. © 2017 Orthopaedic Research Society. Published by Wiley Periodicals, Inc. J Orthop Res 35:590-599, 2017.

Keywords: Mankin score; mitochondria; overload; post-traumatic osteoarthritis; rabbit.


Figures

Figure 1
Figure 1
Peak vertical force (top) and vertical impulse (bottom) in the operated limb (either MMD or sham) and the non-operated contralateral limbs from the MMD and sham groups. Data points are an average and bars are standard deviations. N=8 for all data points except for MMD and MMD Cont at times before 8W when the data were pooled from the 8W-MMD and 26W-MMD groups (n=16). The insets (in gray) show limb loading results on an expanded axis to better illustrate the extremely modest early differences in limb loading associated with surgery and between the MMD and sham groups. Each data series is slightly offset from the others horizontally to allow for visualization of the individual error bars at each time point.
Figure 2
Figure 2
Average Mankin scores are plotted on the top left, and individual scoring components contributing to the overall score are plotted in the other three panels. For every plot, open shapes are individual animal data, filled shapes are group averages and vertical bars are standard deviations. Statistical significance between groups as determined by Tukey’s multiple comparisons tests is indicated with horizontal bars and associated multiplicity adjusted p values. Differences in structural scores between the sham, 8W-MMD and 26W-MMD groups appear to be the greatest contributors to the differences in total Mankin scores between the groups.
Figure 3
Figure 3
Quantitive histological data for all compartments of the rabbit stifle (knee) provided by the semi-automated Mankin scoring program. For every plot, open shapes are individual animal data, filled shapes are group averages and vertical bars are standard deviations. Statistical significance is indicated with p<0.05 (*), p<0.01 (**), p <0.001 (***). MMD caused progressive cell loss in the superficial zone that appeared to be progressive from 8 to 26 weeks. Cell loss deeper in the cartilage varied with time and compartment. PG loss was initially very similar between MMD and sham animals 8 weeks postoperatively, but was greater 26 weeks postoperatively.
Figure 4
Figure 4
Representative histology images of the medial tibial plateau from the rabbits comprising the three different study groups used to establish PTOA progression. Images were selected from the n=8 images available per group and oriented with anterior on the left. The least severe damage in each group is on the top row, and the most severe damage is in the bottom row. Rows 2 and 3 are representative intermediate levels of degeneration most representative of the group as a whole. The most notable progression in overall joint damage is localized erosion (**) that began to become apparent in a few animals in the 8W-MMD group, but was more severe and present in more animals at 26 weeks. This feature was not well-captured by the automated histology scoring program, and is best appreciated by qualitative observation.
Figure 5
Figure 5
Average chondrocyte respiration measurements. Shaded columns represent group average values and error bars indicate standard deviations. Pairwise statistical comparison indicated differences only at 4 weeks between medial MMD and lateral MMD/lateral contralateral basal respiration (§ indicates p=0.045/0.020), between medial MMD and lateral MMD max respiration (§§ indicates p=0.030), and between medial MMD and medial contralateral/lateral MMD/lateral contralateral proton leakage (§§§ indicates p=0.011/p=0.023/p=0.029).

References

    1. Anderson DD, Chubinskaya S, Guilak F, et al. Post-traumatic osteoarthritis: improved understanding and opportunities for early intervention. J Orthop Res. 2011;29:802–809. - PMC - PubMed
    1. Buckwalter JA, Anderson DD, Brown TD, et al. The Roles of Mechanical Stresses in the Pathogenesis of Osteoarthritis: Implications for Treatment of Joint Injuries. Cartilage. 2013;4:286–294. - PMC - PubMed
    1. Glasson SS, Blanchet TJ, Morris EA. The surgical destabilization of the medial meniscus (DMM) model of osteoarthritis in the 129/SvEv mouse. Osteoarthritis Cartilage. 2007;15:1061–1069. - PubMed
    1. Arunakul M, Tochigi Y, Goetz JE, et al. Replication of chronic abnormal cartilage loading by medial meniscus destabilization for modeling osteoarthritis in the rabbit knee in vivo. J Orthop Res. 2013;31:1555–1560. - PMC - PubMed
    1. Brophy RH, Martinez M, Borrelli J, Jr, Silva MJ. Effect of combined traumatic impact and radial transection of medial meniscus on knee articular cartilage in a rabbit in vivo model. Arthroscopy. 2012;28:1490–1496. - PMC - PubMed

Publication types