. 2016 Jun 9:6:27631.
doi: 10.1038/srep27631.

Cytochrome bd Displays Significant Quinol Peroxidase Activity

Affiliations

Cytochrome bd Displays Significant Quinol Peroxidase Activity

Sinan Al-Attar et al. Sci Rep. .

Abstract

Cytochrome bd is a prokaryotic terminal oxidase that catalyses the electrogenic reduction of oxygen to water using ubiquinol as electron donor. Cytochrome bd is a tri-haem integral membrane enzyme carrying a low-spin haem b558, and two high-spin haems: b595 and d. Here we show that besides its oxidase activity, cytochrome bd from Escherichia coli is a genuine quinol peroxidase (QPO) that reduces hydrogen peroxide to water. The highly active and pure enzyme preparation used in this study did not display the catalase activity recently reported for E. coli cytochrome bd. To our knowledge, cytochrome bd is the first membrane-bound quinol peroxidase detected in E. coli. The observation that cytochrome bd is a quinol peroxidase, can provide a biochemical basis for its role in detoxification of hydrogen peroxide and may explain the frequent findings reported in the literature that indicate increased sensitivity to hydrogen peroxide and decreased virulence in mutants that lack the enzyme.


Conflict of interest statement

The authors declare no competing financial interests.

Figures

Figure 1
Figure 1. Analytical chromatography of purified cytochrome bd.
Purified cytochrome bd was subjected to analytical gel filtration chromatography. UV absorption at 280 nm is shown in black, refractive index and right angle light scattering are shown in gray and light gray, respectively. A monodisperse protein peak was detected at an elution volume of 11.3 mL, corresponding to a mass of approximately 470 kDa. A second non-protein peak was detected at 13.7 mL, corresponding to a mass of approximately 70 kDa.
Figure 2
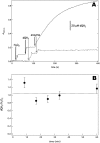
Figure 2. Cytochrome bd has quinol peroxidase activity.
(A) The QPO reaction catalysed by cytochrome bd is monitored as dQH2 oxidation (260 nm). The dotted trace represents a control experiment where only the enzyme and dQH2 are added showing a lack of background activity and inferring that the system is anaerobic. Upon addition of H2O2, dQH2 is oxidized (solid trace). The reaction buffer contained 120 μM dQH2 and 23 nM cytochrome bd with (solid trace) or without (dotted trace) 6 mM H2O2. Solid and dotted arrows indicate the time of the additions corresponding to the solid and dotted traces, respectively. (B) The dQH2/H2O2 ratio of the QPO reaction catalysed by cytochrome bd. The average dQH2/H2O2 ratio was determined at 1.05 ± 0.19 by analyzing the reaction buffer at different time intervals during the reaction. The average ratio is consistent with the peroxidase reaction (Eq. 3). The results are presented as means ± SD of duplicates (n = 2).
Figure 3
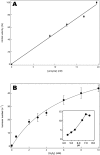
Figure 3. Kinetics of quinol peroxidase activity by cytochrome bd.
(A) The proportional relation between the initial rate of quinol-peroxide reduction and cytochrome bd concentration. The QPO initial rates were measured in standard buffer in the presence of 120 μM dQH2 and 1 mM H2O2 at room temperature. (B) The QPO activity of cytochrome bd as function of the H2O2 concentration showing saturation kinetics. Initial rates are expressed as turnover number (mol dQH2/mol enzyme/s). The data were fitted to the Michaelis-Menten equation (lines). The fitting parameters (apparent Vmax and KM values) were Vmax = 75 ± 4.5 s−1 and KM = 6.6 ± 1.1 mM. The inset shows the pH-dependence of the QPO reactions at 1 mM H2O2. The assays were performed in the presence of 120 μM dQH2 and 23 nM cytochrome bd. The results are presented as means ± SD of duplicates (n = 2). The inset shows single measurements.
Figure 4
Figure 4. Inhibition of quinol peroxidase activity by nitric oxide.
Reversible inhibition of the QPO reaction by NO was monitored spectrophotometrically. After addition of 6 μM NO, the reaction is inhibited promptly but resumes due to disappearance of NO. The QPO reaction was started by addition of 200 μM dQH2 and 10 mM H2O2 to 9 nM of cytochrome bd at room temperature.
Figure 5
Figure 5. Lack of catalase activity of purified cytochrome bd in non- and mid-turnover conditions.
(A) Oxygen measurement in the presence of cytochrome bd and H2O2 shows that the enzyme does not have catalase activity. The enzyme (125 nM) in standard buffer was first purged with nitrogen gas (N2) to lower the oxygen concentration to ~130 μM. The addition of 1 mM H2O2 did not show any generation of oxygen indicating the lack of catalase activity. As a positive control, 1 μM of catalase was added resulting in a rapid increase in oxygen concentration. Due to oxygen leakage into the measuring chamber, a slow background increase in oxygen concentration is observed. (B) Test for catalase activity by cytochrome bd using buffer and detergent reported in. Lack of catalase activity of cytochrome bd determined polarographically. The buffer was 50 mM KPi, 0.1 mM EDTA, 0.05% LS, pH 7.0 the same as in. The buffer was purged with nitrogen gas (N2) to lower the oxygen concentration prior to addition of 1 mM H2O2. Then, cytochrome bd was added successively indicated by numbered arrows: 1, 0.075 μM; 2, 0.225 μM and 3, 1 μM (accumulative concentrations). No catalase activity was detected after any of these additions. When 200 μM dQH2 was added a rapid decrease in oxygen concentration is observed due to the oxidase activity of cytochrome bd. (C) Polarographic test for catalase activity during turnover as previously reported in. Oxidase turnover was started, by consecutively adding 10 mM DTT, 50 μM UQ-0 and 100 nM enzyme to the standard buffer. During turnover 1 mM of H2O2 was added to the reaction and a decrease in oxidase activity of 9 ± 2% could be observed. Oxygen formation was only observed after adding 20 nM catalase.
Figure 6
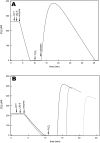
Figure 6. Lack of catalase activity of purified cytochrome bd in post-turnover conditions.
Polarographic test for catalase activity after achieving anoxia through cytochrome bd oxidase turnover as in. (A) Oxidase turnover was started, by consecutively adding 10 mM DTT, 50 μM UQ-0 and 100 nM enzyme to the standard buffer. 90 seconds after reaching anoxia, 1 mM of H2O2 was added to the reaction and no increase in oxygen could be observed. 150 seconds after peroxide addition, 20 nM catalase were added and formation of oxygen was observed. (B) Identical reaction parameters as in (A) were used. The reaction mixture was incubated for 2.5 (black), 5 (gray) and 10 minutes (light gray) after addition of 1 mM H2O2. After incubation, 100 nM of catalase were added and formation of different quantities of oxygen was observed.
Figure 7
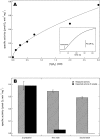
Figure 7. Catalase activity in an E. coli membrane fraction.
(A) The dependence of the catalase activity of isolated E. coli membranes on H2O2 concentration. Membranes were added to H2O2 containing standard buffer. The dashed line is a non-hyperbolic power law fit: Specific activity = y0 + A * [H2O2]n. where y0 = 0.015, A = 0.34 and n = 0.65. The inset is a representative activity trace that shows oxygen formation in the presence of 0.25 mM H2O2. (B) The catalase activity is membrane-associated. A weak catalase activity measured at 1 mM H2O2 was observed in the membranes of E. coli. The bulk of the catalase activity (striped bars) was resistant to washing/sonication cycles (See Materials and Methods) indicating that the activity is membrane-associated. A theoretical activity profile (solid bars) is shown representing the expected remaining catalase activity for a soluble entity (7.7% and 0.60% remaining activity after the first and second washing steps, respectively). The results are presented as means ± SD of duplicates (n = 2).

References

    1. Borisov V. B., Gennis R. B., Hemp J. & Verkhovsky M. I. The cytochrome bd respiratory oxygen reductases. Biochim. Biophys. Acta 1807, 1398–1413, doi: 10.1016/j.bbabio.2011.06.016 ( 2011). - DOI - PMC - PubMed
    1. Junemann S. Cytochrome bd terminal oxidase. Biochim. Biophys. Acta 1321, 107–127 (1997). - PubMed
    1. Miller M. J. & Gennis R. B. The purification and characterization of the cytochrome d terminal oxidase complex of the Escherichia coli aerobic respiratory chain. J. Biol. Chem. 258, 9159–9165 (1983). - PubMed
    1. Kita K., Konishi K. & Anraku Y. Terminal oxidases of Escherichia coli aerobic respiratory chain. II. Purification and properties of cytochrome b558-d complex from cells grown with limited oxygen and evidence of branched electron-carrying systems. J. Biol. Chem. 259, 3375–3381 (1984). - PubMed
    1. Baughn A. D. & Malamy M. H. The strict anaerobe Bacteroides fragilis grows in and benefits from nanomolar concentrations of oxygen. Nature 427, 441–444, doi: 10.1038/nature02285 (2004). - DOI - PubMed

Publication types

MeSH terms

LinkOut - more resources