. 2016 Sep 15;214(6):884-94.
doi: 10.1093/infdis/jiw225. Epub 2016 Jun 7.

Sporozoite Route of Infection Influences In Vitro var Gene Transcription of Plasmodium falciparum Parasites From Controlled Human Infections

Affiliations

Sporozoite Route of Infection Influences In Vitro var Gene Transcription of Plasmodium falciparum Parasites From Controlled Human Infections

Sandra Dimonte et al. J Infect Dis. .

Abstract

Background: Antigenic variation in Plasmodium falciparum is mediated by the multicopy var gene family. Each parasite possesses about 60 var genes, and switching between active var loci results in antigenic variation. In the current study, the effect of mosquito and host passage on in vitro var gene transcription was investigated.

Methods: Thirty malaria-naive individuals were inoculated by intradermal or intravenous injection with cryopreserved, isogenic NF54 P. falciparum sporozoites (PfSPZ) generated from 1 premosquito culture. Microscopic parasitemia developed in 22 individuals, and 21 in vitro cultures were established. The var gene transcript levels were determined in early and late postpatient cultures and in the premosquito culture.

Results: At the early time point, all cultures preferentially transcribed 8 subtelomeric var genes. Intradermal infections had higher var gene transcript levels than intravenous infections and a significantly longer intrahost replication time (P = .03). At the late time point, 9 subtelomeric and 8 central var genes were transcribed at the same levels in almost all cultures. Premosquito and late postpatient cultures transcribed the same subtelomeric and central var genes, except for var2csa

Conclusions: The duration of intrahost replication influences in vitro var gene transcript patterns. Differences between premosquito and postpatient cultures decrease with prolonged in vitro growth.

Keywords: Plasmodium falciparum; controlled human malaria infections; epigenetics; malaria; transcription; var genes.


Figures

Figure 1.
Figure 1.
Transcription analysis of NF54 parasites with or without passage through mosquito and human host. The upper part of the figure depicts the generation of sporozoites, controlled human infection by the intradermal or intravenous route, and subsequent in vitro culture. Transcription analysis was performed at time points 1 (t1; mean, 16 generations after infection) and 2 (t2; mean, 41 generations after infection). Gametocytogenesis was induced after 3 mitotic divisions. The lower part of the figure shows an aliquot of the original NF54 culture, maintained in continuous in vitro culture. This was done with 2 independent vials of the same NF54 WCB SAN02-073009 frozen stock. Transcriptional analysis was performed after 21 mitotic divisions (time point 3 [t3]). Abbreviation: PfSPZ, Plasmodium falciparum sporozoites.
Figure 2.
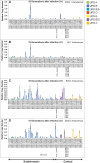
Figure 2.
Transcription analysis of NF 54 parasites at time point 1 (t1) after intradermal or intravenous infection. Representative individual transcription profiles of NF54 parasites obtained from individuals infected intradermally (2500 Plasmodium falciparum sporozoites [PfSPZ]) (A) or intravenously (50, 800, or 3200 PfSPZ) (BD). Patient identifiers (eg, 2500.1 ID) refer to dosage and route of administration (ID, intradermal; IV, intravenous); see Table 1 for details. The transcription signal is quantified in relative copy numbers (y-axis), and var genes are arranged according to chromosomal position (centrally located [central] or in subtelomeric region) and promoter type (UPSA, B, C, B/A, B/C, E, and D) and annotated according to the reannotation at www.GeneDB.org. (For previous annotation see Supplementary Table 2).
Figure 3.
Figure 3.
Transcription analysis of all cultures at time period 1 (t1). A, var Gene transcription heat map. The transcription signal is expressed as the percentage of the highest individual var gene transcriptional signal in the entire population (PF3D7_0223500 of 2500.3 ID) and reflected in the color of the boxes of the heat map (bar at far left). Patient identifiers with corresponding infection route and dose are displayed to the left of the heat map; individual var loci are listed at the bottom. Patient identifiers (eg, 2500.3 ID) refer to dosage and route of administration (ID, intradermal; IV, intravenous); see Table 1 for details. Promoter type and chromosomal position are indicated by the boxes above the heat map. Promoter types of var genes are marked with colored boxes. Subtelomeric var genes are marked as white and central var genes as black boxes. Note that a cluster of 8 subtelomeric var genes exhibits the highest transcription levels in all cultures. The 2 clusters of cultures from the different study participants are depicted on the right. Cluster 1: 2500.1–3 ID, 50.1 IV, and 3200.4 IV. Cluster 2: 200.1 IV, 800.1–5 IV, 3200.2 IV, 3200.3 IV, and 3200.5–9 IV. B, C, Overlay peak plots of clusters 1 and 2. Cultures from patients with the same dose and route of infection were collapsed to a single peak plot. The relative copy number as a percentage (of PF3D7_0223500 of 2500.3 ID) is indicated on the y-axis, and the individual var gene loci on the x-axis. The order of var genes is the same as in Figure 2.
Figure 4.
Figure 4.
Transcription analysis of all cultures at t2. A, var Gene transcription heat map, following the same scheme as in Figure 3. Note that the cluster of var genes with the highest transcriptional levels is now composed of 10 subtelomeric and 7 central var genes. B, C, Overlay peak plot of cultures comprising cluster 3 and 4 following the same scheme as in Figure 3; var transcription levels have decreased across all cultures, except the 50.1 IV culture. Patient identifiers (eg, 3200.7 ID) refer to dosage and route of administration (ID, intradermal; IV, intravenous); see Table 1 for details.
Figure 5.
Figure 5.
var Gene transcription profiles are influenced by route of infection and duration of intrahost replication. A, Prepatent periods of clusters 1 and 2; y-axis denotes the time from infection to blood smear positivity (prepatent period). B, Representative overlay peak plots of individual parasite populations (top, 2500.1 ID; middle, 50.1 IV; bottom, 3200.4 IV) at different times of in vitro culture. Relative copy number as a percentage (scaled to PF3D7_0223500 of 2500.3 ID) is indicated on the y-axis, individual var gene loci on the x-axis. Note that the transcriptional signal level for 3200.4 IV decreases faster than in the 2500.1 ID and 50.1 IV cultures. Patient identifiers (eg, 2500.1 ID) refer to dosage and route of administration (ID, intradermal; IV, intravenous); see Table 1 for details. C, Comparison of total var gene signal (AUC) of cluster 1 and 2 between the day of blood smear positivity (ex vivo) and in vitro (t1 and t2). Note that cluster 2 exhibits a statistically significant decrease of total the var gene signal (AUC) between ex vivo and in vitro (t1 and t2) (indicated by the asterisks). Cluster 1 shows no statistically significant decrease in total var signal (AUC) between ex vivo and in vitro. The same housekeeping gene (arginyl-tRNA synthetase; PF3D7_1218600) was used to analyze ex vivo and in vitro t1 and t2 real-time polymerase chain reaction. In clusters 1 and 2, 50.1 IV and 800.5 IV are removed because no RNA was available for this analysis at the ex vivo time point. Abbreviation: AUC, area under the curve.
Figure 6.
Figure 6.
Transcription analysis of premosquito (time period 3 [t3]) and postpatient (time periods 1 and 2 [t1, t2) NF54 parasites. A, Transcription overlay plots of the same NF54 culture after exclusive mitotic replication for 21 generations compared with 19 and 40 mitotic replications plus 1 meiotic division and host passage. The transcription signal of the original NF54 parasites after t3 (21 mitotic divisions) is represented by triangles. The height of the transcription signal is indicated on the y-axis, and the individual var gene loci on the x-axis. B, var Gene transcription fold changes after mosquito and host passage. Log2 ratios for t1 (dark gray) and t2 (light gray) compared with t3 were calculated using the delta delta cycle threshold method [35]; individual var loci are depicted on the left. Genes that are transcribed with stronger signals at t3 (premosquito culture) will have a value <1; var2csa and the majority of central var genes belong to this group. Subtelomeric var loci at t1 represent the majority of var genes transcribed at higher levels after passage through mosquito and human host (value, >1).

References

    1. World Health Organization. World malaria report 2014. Available at: http://www.who.int/malaria/publications/world_malaria_report_2014/report... Accessed 27 March 2015.
    1. Miller LH, Baruch DI, Marsh K, Doumbo OK. The pathogenic basis of malaria. Nature 2002; 415:673–9. - PubMed
    1. Smith JD, Chitnis CE, Craig AG et al. . Switches in expression of Plasmodium falciparum var genes correlate with changes in antigenic and cytoadherent phenotypes of infected erythrocytes. Cell 1995; 82:101–10. - PMC - PubMed
    1. Su XZ, Heatwole VM, Wertheimer SP et al. . The large diverse gene family var encodes proteins involved in cytoadherence and antigenic variation of Plasmodium falciparum-infected erythrocytes. Cell 1995; 82:89–100. - PubMed
    1. Baruch DI, Pasloske BL, Singh HB et al. . Cloning the P. falciparum gene encoding PfEMP1, a malarial variant antigen and adherence receptor on the surface of parasitized human erythrocytes. Cell 1995; 82:77–87. - PubMed

Publication types

Substances