. 2016;1(7):e86943.
doi: 10.1172/jci.insight.86943. Epub 2016 May 19.

Quantitative podocyte parameters predict human native kidney and allograft half-lives

Affiliations

Quantitative podocyte parameters predict human native kidney and allograft half-lives

Abhijit S Naik et al. JCI Insight. 2016.

Abstract

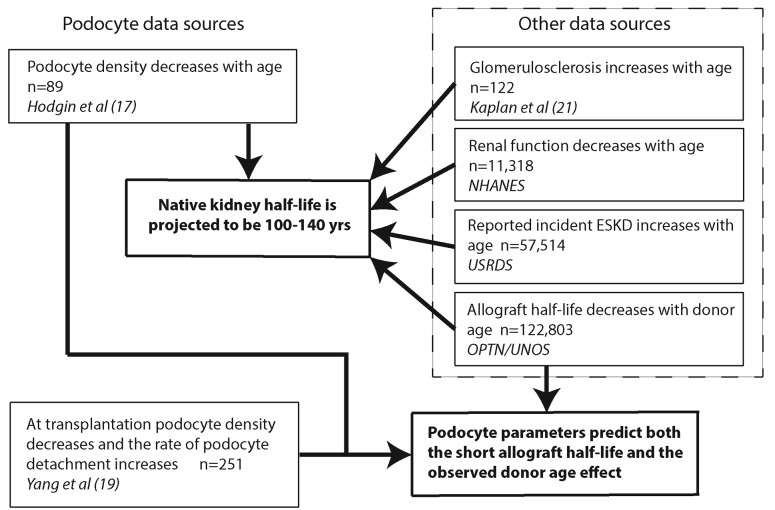
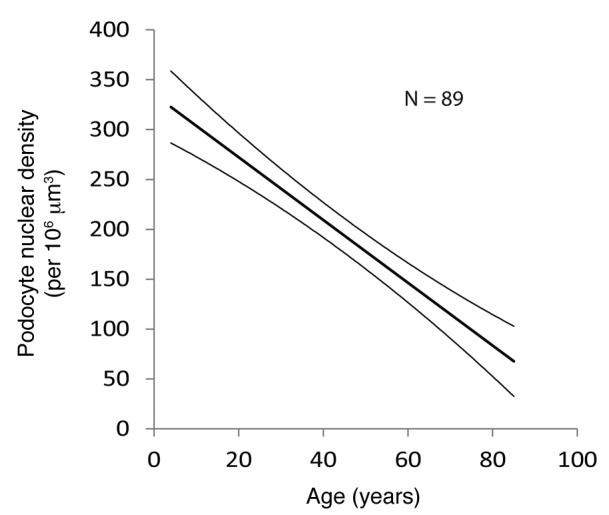
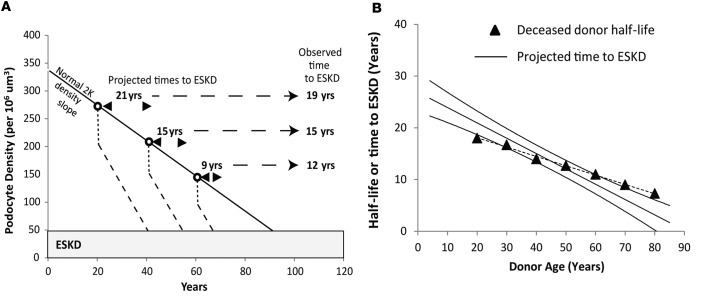
Background: Kidney function decreases with age. A potential mechanistic explanation for kidney and allograft half-life has evolved through the realization that linear reduction in glomerular podocyte density could drive progressive glomerulosclerosis to impact both native kidney and allograft half-lives.

Methods: Predictions from podometrics (quantitation of podocyte parameters) were tested using independent pathologic, functional, and outcome data for native kidneys and allografts derived from published reports and large registries.

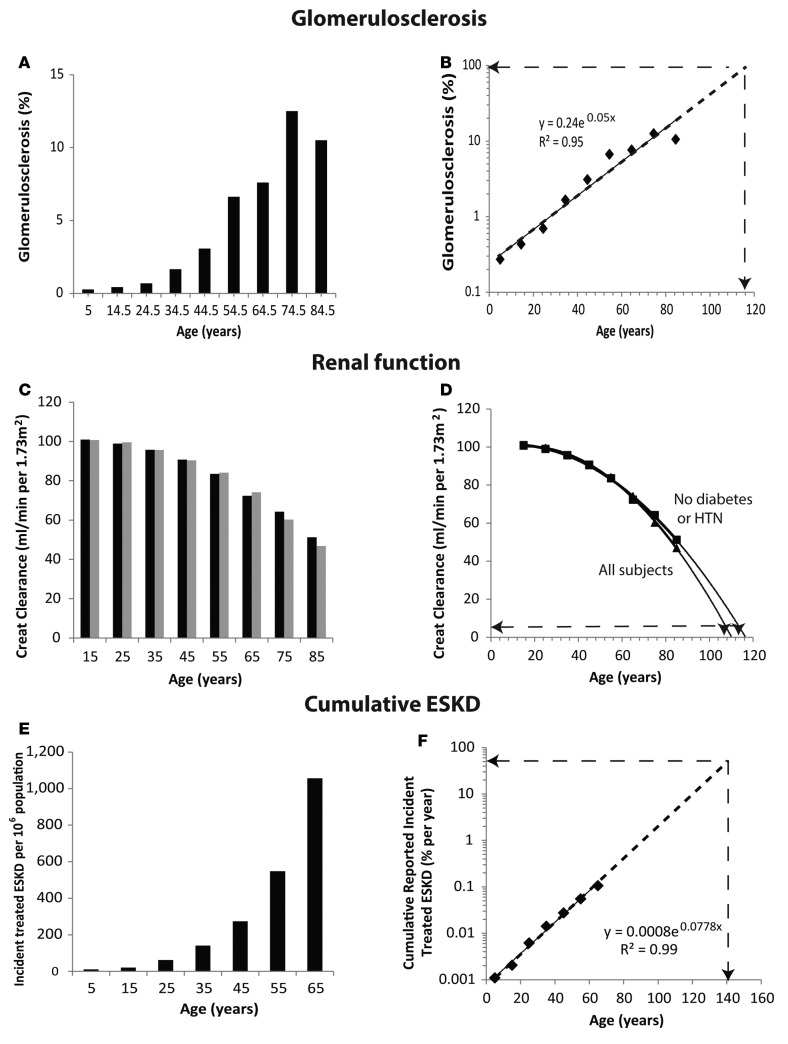
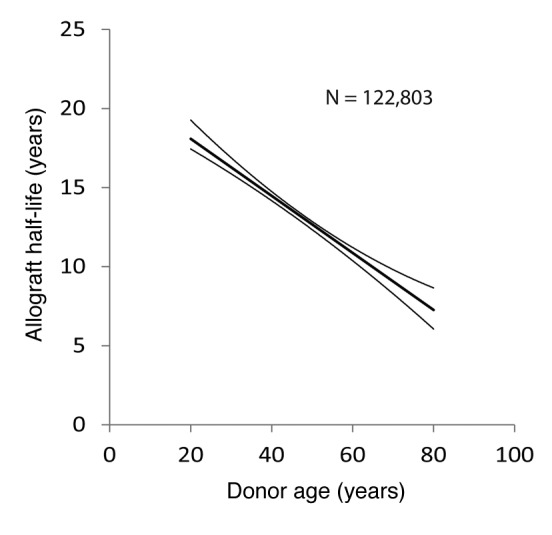
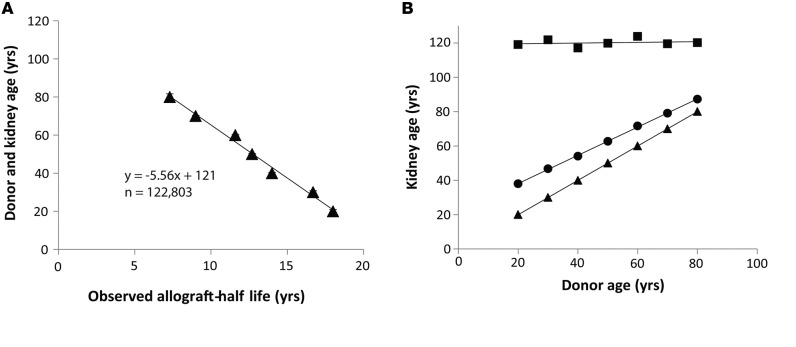
Results: With age, native kidneys exponentially develop glomerulosclerosis, reduced renal function, and end-stage kidney disease, projecting a finite average kidney life span. The slope of allograft failure rate versus age parallels that of reduction in podocyte density versus age. Quantitative modeling projects allograft half-life at any donor age, and rate of podocyte detachment parallels the observed allograft loss rate.

Conclusion: Native kidneys are designed to have a limited average life span of about 100-140 years. Allografts undergo an accelerated aging-like process that accounts for their unexpectedly short half-life (about 15 years), the observation that older donor age is associated with shorter allograft half-life, and the fact that long-term allograft survival has not substantially improved. Podometrics provides potential readouts for these processes, thereby offering new approaches for monitoring and intervention.

Funding: National Institutes of Health.


Figures

Figure 1
Figure 1. Overview of data sources.
Podocyte data were derived from two recent reports dealing with podocytes in normal human aging (17) and in kidney transplantation (19). Predictions derived from podocyte data were tested using other data sources, including glomerulosclerotic changes with age (21), changing renal function with age (National Health and Nutrition Examination Survey [NHANES] (22, 23), incident end-stage kidney disease (ESKD; United States Renal Data System [USRDS]; ref. 24), and allograft outcome (Organ Procurement and Transplantation Network [OPTN]/United Network for Organ Sharing (UNOS) Standard Transplant and Research [STAR]; ref. 25) data sets.
Figure 2
Figure 2. Linear decrease in podocyte density with age.
The data shown are the median and 95% confidence limits for the reduction in podocyte density with age in human glomeruli as previously reported (17). The characteristics of the slope are given by the equation y = –3.17 × age + 338, projecting that the age at which y = 0 will be 107 years.
Figure 3
Figure 3. Native kidney half-life estimations.
(A and B) Proportion of glomeruli with global glomerulosclerosis derived from Kaplan et al. (21). Meaned data for global glomerulosclerosis prevalence appears to increase exponentially with age. The dotted line is extended to determine the age at which 95% of glomeruli are projected to be sclerotic (presumed to be incident end-stage kidney disease [ESKD]), as shown by the dashed lines with arrows. This projected value is 116 years. (C and D) Estimated glomerular filtration rate (eGFR) projections from the NHANES dataset. eGFR was calculated as the creatinine (Creat) clearance per 1.73 m2. (C) Reduction in eGFR with age of all subjects (black bars) and only those subjects without diabetes or hypertension (gray bars). (D) The rate of decrease in eGFR accelerates with age such that the age at which eGRF is projected to reach 5 ml/min per 1.73 m2 (presumed to be ESKD) for all subjects is about 107 years and for only those without diabetes or hypertension is about 110 years, as shown by the dotted lines with arrows. See supplemental material for details of fitting a quadratic polynomial equation and the derived mean projected age and ranges at ESKD. (E and F) Reported incident treated ESKD from the USRDS Annual Data Report (24). The number of incident aggregated treated ESKD per million of population is shown in E, demonstrating an exponential increase with age. (F) Cumulative reported treated ESKD as percentage of the population plotted on a log scale in order to estimate the age at which 50% of the population would be projected to reach ESKD (i.e., the half-life of native kidneys), as shown by the arrows. The projected value is 140 years. The r2 values shown are for aggregated data.
Figure 4
Figure 4. The slope of allograft half-life in relation to donor age.
Data for death-censored donor allograft survival versus age were derived from the OPTN/UNOS database as of September 5, 2014, as outlined in Methods (25). The median and 95% confidence limits are shown together with the n.
Figure 5
Figure 5. Simulation of allograft time to ESKD versus donor age derived from podometric data and comparison to observed transplant outcomes data versus age.
(A) Method and assumptions. The normal reduction in podocyte density by age is illustrated by the diagonal solid line as previously reported (17). Open circles represent hypothetical kidney donation ages at 20, 40, and 60 years. At implantation both the kidney and glomerulus rapidly increase in size by 20% (19). Podocytes cannot divide and therefore have to undergo rapid compensatory hypertrophy, resulting in reduced podocyte density, as shown by the dotted line at each donor age. Following implantation, allografts continue to lose podocytes at an increased rate on average 6-fold above the native kidney control rate (19). This increased rate of podocyte detachment will result in an accelerated rate (steeper slope compared with native kidneys) of further reduction in podocyte density (dashed lines). At a podocyte density value below 50 per 106 μm3, global sclerosis will supervene and kidneys will be at end-stage kidney disease (ESKD). The predicted time to ESKD can therefore be estimated for any putative donor age, as shown by the arrowheads. The observed mean value for time to ESKD for deceased donor kidney transplants at each of the three donor ages is shown at right as derived from the OPTN/UNOS database as of September 5, 2014. (B) Comparison of projected to observed kidney transplant half-life by age. Each data point (n = 89) from the previously reported aging study (17) was used to estimate the projected time to ESKD that would have occurred were that kidney to have been transplanted according to the above criteria. The regression line ± 95% confidence limit is shown. The closed triangles show aggregated half-lives by age for deceased donors as derived from the OPTN/UNOS database as of September 5, 2014. The slope of the linear regression line derived from podometric data (solid line) is steeper than the observed OPTN/UNOS data, although this difference is not statistically significant (P = 0.42; general linear model).
Figure 6
Figure 6. Donor age in relation to allograft half-life plots.
(A) Donor age versus allograft half-life. Deceased donor allograft half-life is plotted on the x axis and kidney age on the y axis from data shown in Table 1. Donor kidney age is linearly related to allograft half-life over all donor ages from 20 to 80 years (P < 0.001 for aggregated data, n = 122,803; linear regression model). The slope coordinates can be interpreted to show that the allograft aging rate is 5.6-fold faster than the donor aging rate, and that had the kidney not been transplanted (half-life = 0 years), its expected life span would have been about 121 years. (B) “Biologic” versus “chronologic” kidney aging. Donor age is plotted on the x axis and total kidney age (either chronologic or biologic) on the y axis. The triangles represent the kidney age at time of donation. The circles show the average total chronologic kidney age at which the allograft will fail for various donor ages (estimated as the kidney age at donation + the chronologic allograft half-life). The squares show the total biologic kidney age at which the kidney will fail (estimated as the kidney age at donation + the allograft half-life × 5.6 to account for accelerated allograft biologic aging). Thus, all allografts, whatever their donor age, will on average fail when their total biologic age (donor age + allograft age × 5.6) = 121 years. The difference between the squares and the circles at any donor age represents the lost allograft function due to the accelerated aging-like process experienced by allografts that could be targeted therapeutically. Data are from the OPTN/UNOS database as of September 5,2014 (25).

Similar articles

Cited by

References

    1. Kriz W, Gretz N, Lemley KV. Progression of glomerular diseases: Is the podocyte the culprit? Kidney Int. 1998;54(3):687–697. doi: 10.1046/j.1523-1755.1998.00044.x. - DOI - PubMed
    1. Kriz W, LeHir M. Pathways to nephron loss starting from glomerular diseases: insights from animal models. Kidney Int. 2005;67:404–419. doi: 10.1111/j.1523-1755.2005.67097.x. - DOI - PubMed
    1. Wiggins RC. The spectrum of podocytopathies: a unifying view of glomerular diseases. Kidney Int. 2007;71(12):1205–1214. doi: 10.1038/sj.ki.5002222. - DOI - PubMed
    1. Kikuchi M, Wickman L, Wiggins RC. Podometrics as a potential clinical tool for glomerular disease management. Semin Nephrol. 2015;35(3):245–255. doi: 10.1016/j.semnephrol.2015.04.004. - DOI - PMC - PubMed
    1. Wharram BL, et al. Podocyte depletion causes glomerulosclerosis: Diphtheria toxin-induced podocyte depletion in rats expressing human diphtheria toxin receptor transgene. J Am Soc Nephrol. 2005;16(10):2941–2952. doi: 10.1681/ASN.2005010055. - DOI - PubMed