. 2016 Jun 9;11(6):e0156996.
doi: 10.1371/journal.pone.0156996. eCollection 2016.

Distinct Roles for Intracellular and Extracellular Lipids in Hepatitis C Virus Infection

Affiliations

Distinct Roles for Intracellular and Extracellular Lipids in Hepatitis C Virus Infection

Sowmya Narayanan et al. PLoS One. .

Abstract

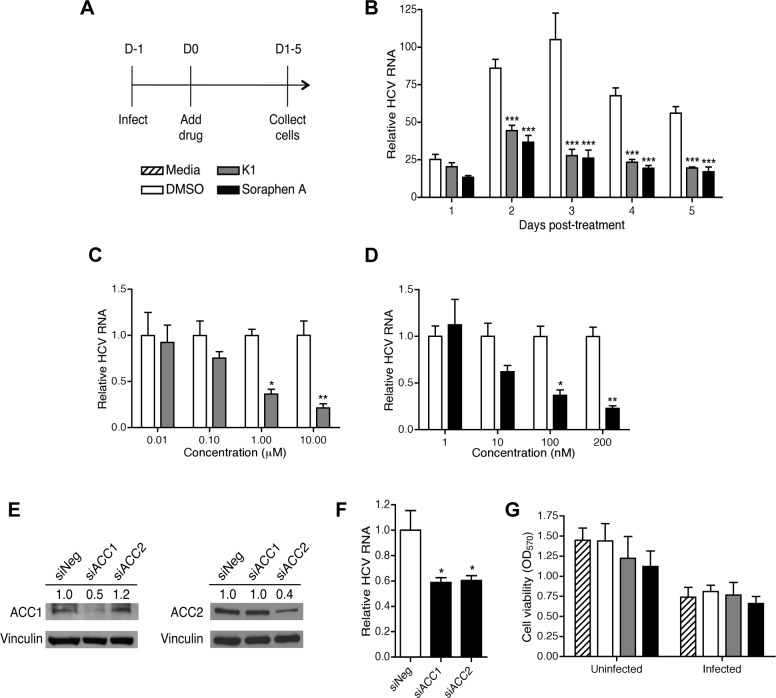
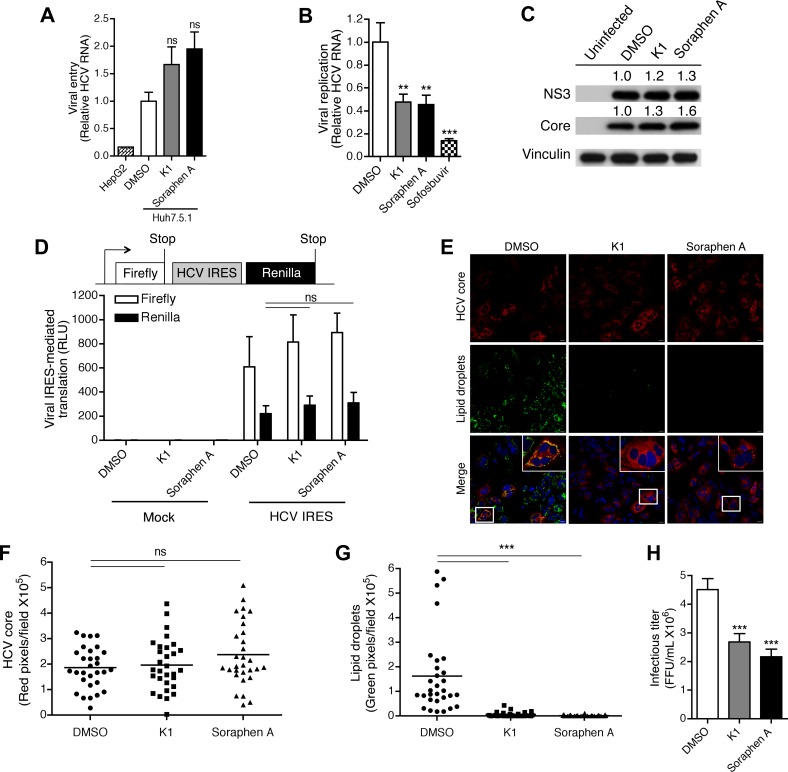
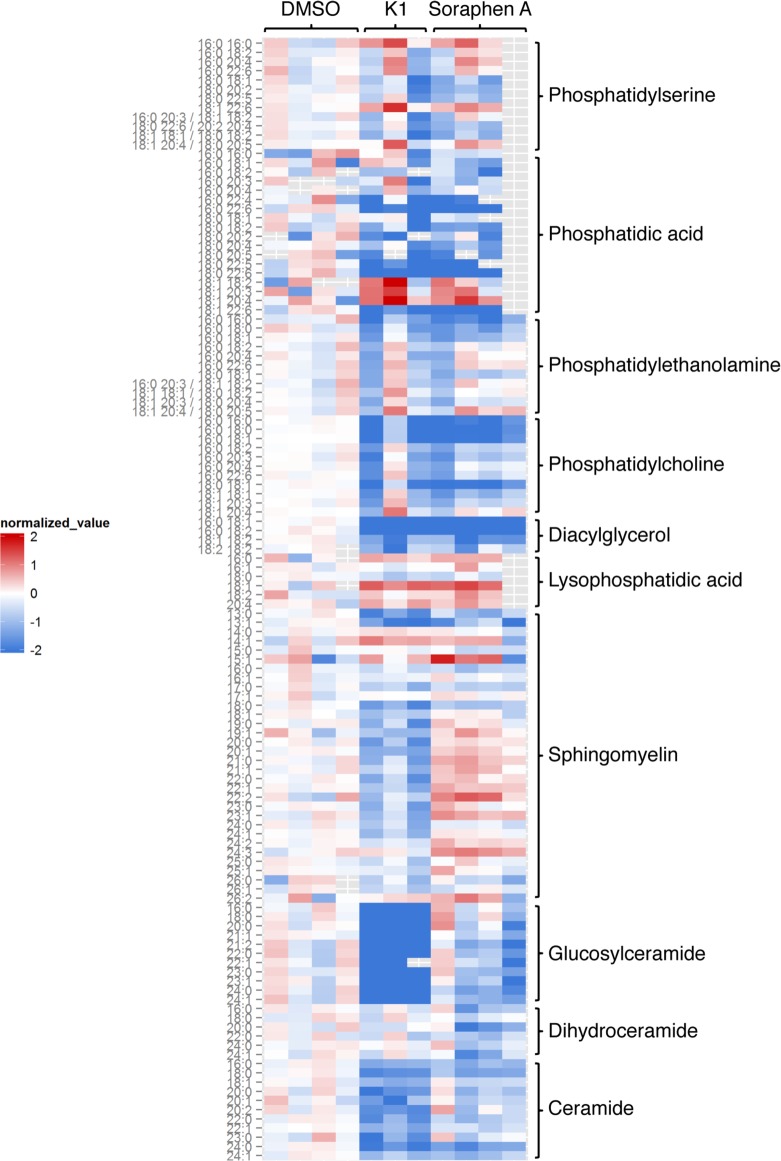
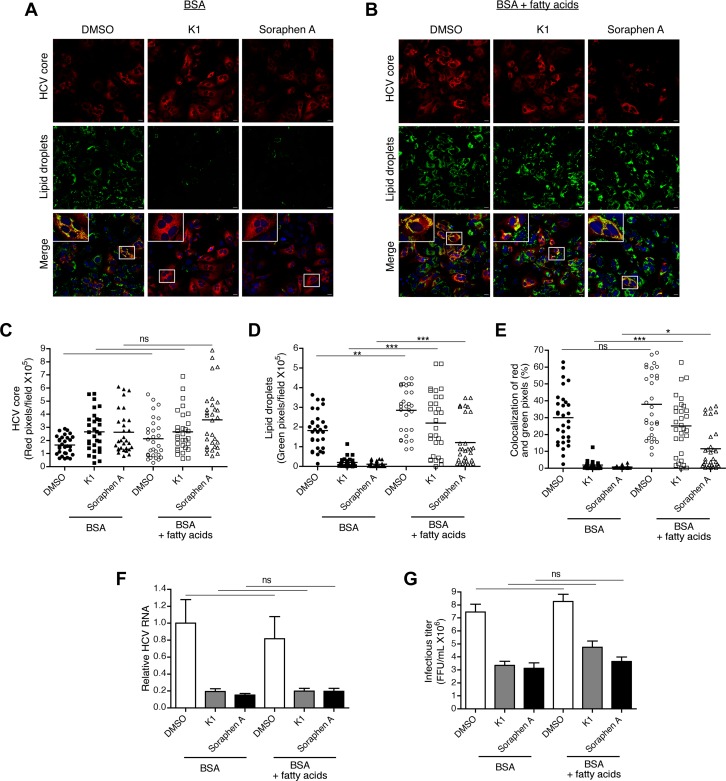
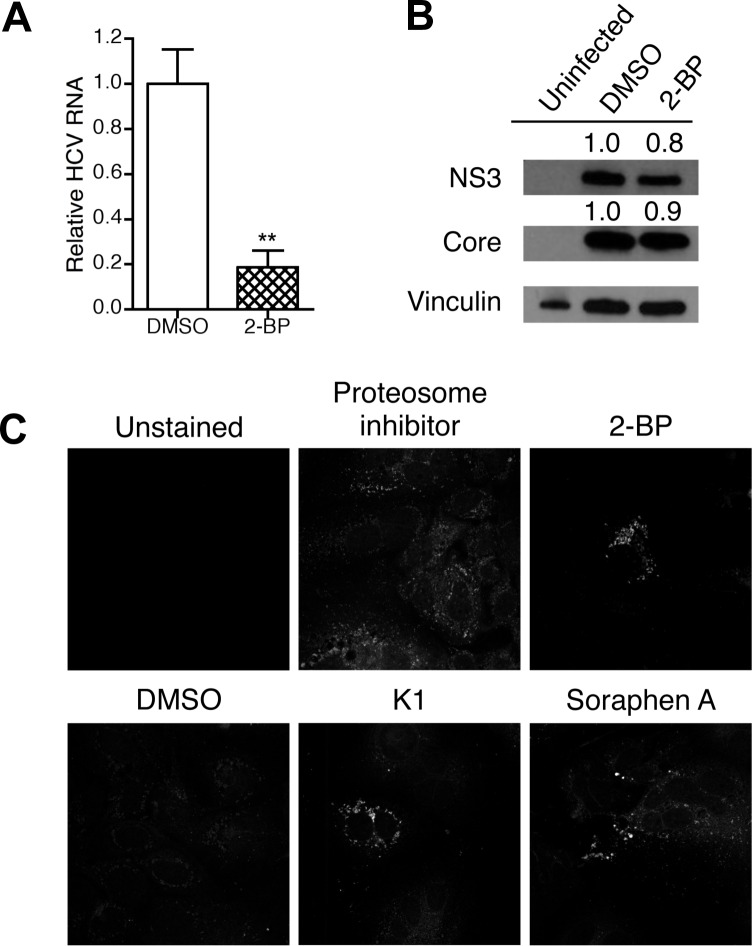
Hepatitis C is a chronic liver disease that contributes to progressive metabolic dysfunction. Infection of hepatocytes by hepatitis C virus (HCV) results in reprogramming of hepatic and serum lipids. However, the specific contribution of these distinct pools of lipids to HCV infection remains ill defined. In this study, we investigated the role of hepatic lipogenesis in HCV infection by targeting the rate-limiting step in this pathway, which is catalyzed by the acetyl-CoA carboxylase (ACC) enzymes. Using two structurally unrelated ACC inhibitors, we determined that blockade of lipogenesis resulted in reduced viral replication, assembly, and release. Supplementing exogenous lipids to cells treated with ACC inhibitors rescued HCV assembly with no effect on viral replication and release. Intriguingly, loss of viral RNA was not recapitulated at the protein level and addition of 2-bromopalmitate, a competitive inhibitor of protein palmitoylation, mirrored the effects of ACC inhibitors on reduced viral RNA without a concurrent loss in protein expression. These correlative results suggest that newly synthesized lipids may have a role in protein palmitoylation during HCV infection.


Conflict of interest statement

Competing Interests: Authors TDE, SDB, EW, and RJA were former employees of Cropsolution, Inc., which supplied the ACC inhibitor, K1. This does not alter the authors' adherence to PLOS ONE policies on sharing data and materials.

Figures

Fig 1
Fig 1. Inhibition of de novo lipogenesis decreases intracellular HCV RNA.
(A) Experimental setup. (B) Kinetics of changes in HCV RNA. Infected Huh7.5.1 cells were treated with 1 μM K1 or 100 nM soraphen A. DMSO was added at an equivalent volume. The media was replaced with fresh ACC inhibitors on D3 post-treatment (PT). HCV RNA was detected by qRT-PCR. The plotted values are fold increases relative to D0 PT (1 day post-infection, before addition of ACC inhibitors). (C, D) Dose response of K1 (C) and soraphen A (D). Infected Huh7.5.1 cells were treated with DMSO, K1, or soraphen A for 3 days before qRT-PCR analysis. (E, F) Silencing of ACC1 and ACC2. Infected Huh7.5.1 cells were transfected with a pool of siRNA against ACC1 or ACC2 for 3 days before immunoblot (E) and qRT-PCR analysis (F). (G) Cell viability upon treatment with K1 and soraphen A. Uninfected and infected Huh7.5.1 were treated with media, DMSO, 1 μM K1, or 100 nM soraphen A for 3 days. Viability was determined by crystal violet staining. Results are the representative or mean ± SEM of 3–5 independent experiments. Statistical significance was calculated by two-way ANOVA with Bonferroni post-tests (B-D) or one-way ANOVA with Tukey’s post-test (F). nd: not detected, *p<0.05, **p<0.01, ***p<0.001.
Fig 2
Fig 2. De novo lipogenesis is required for HCV replication and release and supplies cellular lipid droplets that may contribute to viral assembly.
(A) Effect on entry. Huh7.5.1 cells were treated with DMSO, 1 μM K1, or 100 nM soraphen A for 3 days after which the media was replaced with JFH-1 (MOI 0.1). HepG2 cells were used as a negative control. Cells were collected for qRT-PCR analysis at 1 hour post-infection. (B) Effect on replication. Huh7.5 cells harboring HCV subgenomic replicons were treated with DMSO, 1 μM K1, 100 nM soraphen A, or 250 nM of the NS5B polymerase inhibitor, sofosbuvir, for 3 days. HCV RNA was detected by qRT-PCR. (C) Effect on viral protein. Infected Huh7.5.1 cells were treated with DMSO, 1 μM K1, or 100 nM soraphen A for 3 days. Intracellular viral protein was assessed by immunoblotting. Densities of NS3 and core staining were calculated relative to vinculin and then normalized to DMSO. (D) Effect on translation. Huh7.5.1 cells were transfected with the bicistronic pFR_HCV_xb construct in which the HCV IRES regulated translation of renilla luciferase. Mock transfected cells served as controls. Twenty-four hours post-transfection, the media was replaced with DMSO, 1 μM K1, or 100 nM soraphen A for 3 days. Cellular lysates were assessed for both firefly and renilla luciferase activity. (E-G) Effect on assembly. Infected Huh7.5.1 cells were treated with DMSO, 1 μM K1 or 100 nM soraphen A for 3 days and stained for the nucleocapsid core protein and lipid droplets. Number of red (HCV core, F) and green (lipid droplets, G) was quantified over 10 fields in each experiment. Scale bar is equivalent to 20 μm. (H) Effect on infectious titer. Huh7.5.1 were infected with serially diluted supernatants of infected Huh7.5.1 cells that had been treated with DMSO, 1 μM K1, or 100 nM soraphen A for 3 days. The number of HCV-core positive focus forming units (FFU) was quantified 3 days post-infection. Results are the representative or mean ± SEM of 3–6 independent experiments. Statistical significance was calculated by one-way ANOVA with Tukey’s post-test. ns: not significant, **p<0.01, ***p<0.001.
Fig 3
Fig 3. Inhibiting de novo lipogenesis leads to broad changes in the hepatocyte lipidome.
Infected Huh7.5.1 cells were treated with DMSO, 1 μM K1, or 100 nM soraphen A for 3 days. Indicated lipids were quantified by mass spectrometry and are plotted as normalized values relative to the average in DMSO treated cells. Fatty acid chain length and degree of saturation are indicated on the left. Hashed gray boxes represent replicates that were not detected by the spectrometer. Results are from 3–4 independent experiments.
Fig 4
Fig 4. Exogenous lipids contribute to HCV assembly via lipid droplet formation but are dispensable for replication and release.
(A-E) Infected Huh7.5.1 cells were treated with 1 μM K1, 100 nM soraphen A, or an equivalent volume of DMSO in media containing BSA (A) only or BSA + fatty acids (palmitate, oleate, and linoleate) (B). At D3 of treatment, cells were stained for the HCV nucleocapsid core protein and lipid droplets. Nuclei are indicated in blue. Areas of co-localization may be indicative of assembly of infectious virions. Scale bar is equivalent to 20 μm. Number of red (HCV core, C) pixels and green (lipid droplets, D) pixels were quantified over 10 fields in each experiment. Percentage of red pixels that colocalized with green pixels (E). (F) Infected Huh7.5.1 cells were treated as described in A-E. Intracellular HCV RNA was detected by qRT-PCR. (G) Supernatants of cells treated as described in A-E were used to infect Huh7.5.1 cells for 3 days after which the number of core positive foci was quantified. Results are the representative or mean ± SEM of 3–5 independent experiments. Statistical significance was calculated by one-way ANOVA with Tukey’s post-test. ns: not significant, *p<0.05, **p<0.01, ***p<0.001.
Fig 5
Fig 5. Inhibition of protein palmitoylation also leads to a loss in viral RNA without a concurrent loss in viral protein.
(A, B) Infected Huh7.5.1 cells were treated with 60 μM 2-bromopalmitate (2-BP) or an equivalent volume of DMSO for 3 days. A, Intracellular HCV RNA was detected by qRT-PCR. B, Intracellular viral protein was assessed by immunoblotting. Densities of NS3 and core were calculated relative to vinculin and then normalized to DMSO. (C) Infected Huh7.5.1 cells were treated with DMSO, 1 μM K1, 100 nM soraphen A, or 60 μM 2-BP for 3 days and stained for protein aggregates. Cells treated for 6 hours with 5 μM MG-132, a proteosome inhibitor, served as the positive control. Results are the representative or mean ± SEM of 3–4 independent experiments. Statistical significance was calculated by an unpaired t test. **p<0.01.

Similar articles

Cited by

References

    1. Chen S, Yin P, Zhao X, Xing W, Hu C, Zhou L, et al. Serum lipid profiling of patients with chronic hepatitis B, cirrhosis, and hepatocellular carcinoma by ultra fast LC/IT-TOF MS. Electrophoresis. 2013;34(19):2848–56. Epub 2013/11/15. . - PubMed
    1. Fon Tacer K, Rozman D. Nonalcoholic Fatty liver disease: focus on lipoprotein and lipid deregulation. J Lipids. 2011;2011:783976 Epub 2011/07/21. 10.1155/2011/783976 21773052; PubMed Central PMCID: PMC3136146. - DOI - PMC - PubMed
    1. Reddy JK, Rao MS. Lipid metabolism and liver inflammation. II. Fatty liver disease and fatty acid oxidation. Am J Physiol Gastrointest Liver Physiol. 2006;290(5):G852–8. Epub 2006/04/11. 10.1152/ajpgi.00521.2005 . - DOI - PubMed
    1. Visser BJ, Wieten RW, Nagel IM, Grobusch MP. Serum lipids and lipoproteins in malaria—a systematic review and meta-analysis. Malar J. 2013;12:442 Epub 2013/12/10. 10.1186/1475-2875-12-442 - DOI - PMC - PubMed
    1. Wu L, Parhofer KG. Diabetic dyslipidemia. Metabolism. 2014;63(12):1469–79. Epub 2014/09/23. 10.1016/j.metabol.2014.08.010 . - DOI - PubMed