. 2016 Jun 9;14(6):e1002474.
doi: 10.1371/journal.pbio.1002474. eCollection 2016 Jun.

Membrane Tension Acts Through PLD2 and mTORC2 to Limit Actin Network Assembly During Neutrophil Migration

Affiliations

Membrane Tension Acts Through PLD2 and mTORC2 to Limit Actin Network Assembly During Neutrophil Migration

Alba Diz-Muñoz et al. PLoS Biol. .

Abstract

For efficient polarity and migration, cells need to regulate the magnitude and spatial distribution of actin assembly. This process is coordinated by reciprocal interactions between the actin cytoskeleton and mechanical forces. Actin polymerization-based protrusion increases tension in the plasma membrane, which in turn acts as a long-range inhibitor of actin assembly. These interactions form a negative feedback circuit that limits the magnitude of membrane tension in neutrophils and prevents expansion of the existing front and the formation of secondary fronts. It has been suggested that the plasma membrane directly inhibits actin assembly by serving as a physical barrier that opposes protrusion. Here we show that efficient control of actin polymerization-based protrusion requires an additional mechanosensory feedback cascade that indirectly links membrane tension with actin assembly. Specifically, elevated membrane tension acts through phospholipase D2 (PLD2) and the mammalian target of rapamycin complex 2 (mTORC2) to limit actin nucleation. In the absence of this pathway, neutrophils exhibit larger leading edges, higher membrane tension, and profoundly defective chemotaxis. Mathematical modeling suggests roles for both the direct (mechanical) and indirect (biochemical via PLD2 and mTORC2) feedback loops in organizing cell polarity and motility-the indirect loop is better suited to enable competition between fronts, whereas the direct loop helps spatially organize actin nucleation for efficient leading edge formation and cell movement. This circuit is essential for polarity, motility, and the control of membrane tension.


Conflict of interest statement

The authors have declared that no competing interests exist.

Figures

Fig 1
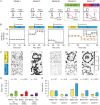
Fig 1. Acute stretching of the plasma membrane leads to an increase in membrane tension and an activation of mTORC2.
(A) Existing model of direct inhibition of actin network assembly by membrane tension (solid links) with potential mTORC2-based mechanosensory pathway that converts increases in tension to decreases in actin assembly (dashed links). (B) Top: Schematic of tether pulling with an atomic force microscope (AFM) to measure tether force and membrane tension. Bottom: Example force–time trace showing membrane tether force quantification. The AFM cantilever (purple line indicates position of the cantilever) is brought into contact with the cell for 5 s (II) and then withdrawn (III). At this time, a membrane tether connecting the cell to the cantilever produces a negative force reading (green line). After tether breakage (IV), the force experienced by the cantilever returns to zero. The difference between the pre-breakage and post-breakage force indicates the tether force. Data fitted with the Kerssemakers algorithm (in grey). See Materials and Methods for details. (C) We used two perturbations to increase membrane tension. Top: Schematic of tether pulling before and after hypo-osmotic shock. Bottom: Schematic of tether pulling for cells plated on a stretchable substrate. (D) Static tether force for chemoattractant-stimulated cells before and after 140 or 70 mOsm hypo-osmotic shocks or 40% radial stretch. Connected colored lines indicate the same cell before and after hypo-osmotic shock. 70 mOsm hypo-osmotic shock and 40% radial stretch both increase membrane tension to a similar degree (p ≤ 0.01). (E) Left: Median of the pAkt S473 immunofluorescence peak by phospho-flow following 140 or 70 mOsm hypo-osmotic shock. Right: Mean of the pAkt S473 immunofluorescence intensity by epifluorescence before and after 40% stretch (all normalized to corresponding control untreated cells in green). Both perturbations that increase membrane tension also increase mTORC2 activation (p < 0.01). Nbiological replicates: D = 3 (140mOsm shock), 12 (70 mOsm shock), 2 (40% stretch). E = 5 (140mOsm shock), 7 (70mOsm shock), and 2 (40% stretch). Ncells: D = 6 (140mOsm shock), 13 (70 mOsm shock), 11 (before 40% stretch), 6 (after 40% stretch). E >10000 (140 or 70 mOsm shock), 26 (before 40% stretch), and 33 (after 40% stretch). Ntethers: D = 15 (before 140 mOsm shock), 13 (after 140 mOsm shock), 34 (before 70 mOsm shock), 25 (after 70 mOsm shock), 21 (before 40% stretch), 19 (after 40% stretch). Statistics: Mann-Whitney test. Boxes in all box plots (D) extend from the 25th to 75th percentiles, with a line at the median. Whiskers extend to ×1.5 IQR (interquartile range) or the max/min data points if they fall within ×1.5 IQR.
Fig 2
Fig 2. mTORC2 is an inhibitor of actin network assembly and is necessary for cell polarity, migration, and membrane tension regulation.
(A) Representative western blot for Rictor in control and knockdown cell lines (see S2A Fig for complete blot). (B) Median of the pAkt S473 immunofluorescence peak (readout of mTORC2 activity) before and after a 70 mOsm hypo-osmotic shock (normalized to Ns shRNA untreated cells). Mean ± SEM. Rictor is required for the membrane stretch-induced phosphorylation of mTORC2 effectors (p < 0.05). (C) Transwell assay for chemotaxis. Mean ± SEM. Rictor knockdown cells are highly defective in chemotaxis (p < 0.01). (D) Left: Representative images of Hem1-GFP (a subunit of the neutrophil WAVE2 complex) recruitment in Nonsense and Rictor shRNA cells. Dashed white line corresponds to cell outline. Right: Quantification of area covered by wave fronts over a 10 min period. Mean ± SEM. Rictor knockdown cells have significantly larger regions of WAVE2 complex recruitment (p < 0.05). See Materials and Methods for how the WAVE2 area measurements were performed. See S2 and S3 Movies. (E) Median of the phalloidin staining before and after 3 or 10 min of fMLP stimulation. Rictor knockdown cells have more sustained actin assembly than control cells (p < 0.05). Mean ± SEM. (F) Static tether force for stimulated Nonsense and Rictor shRNA cells. Rictor knockdown cells have significantly increased membrane tension (p < 0.05). Nbiological replicates: B = 5. C = 7. D = 4. E = 5. F = 14. Ncells: B >10,000/data point. C = 300,000/well. D = 11 (Ns shRNA) and 12 (Rictor shRNA). E >10,000/data point. F = 32 (Ns shRNA), 41 (Rictor shRNA). Ntethers: F = 60 (Ns shRNA) and 83 (Rictor shRNA). Statistics: Mann-Whitney test (B, D, E, F) and t test (C). Boxes in all box plots (F) extend from the 25th to 75th percentiles, with a line at the median. Whiskers extend to ×1.5 IQR (interquartile range) or the max/min data points if they fall within ×1.5 IQR.
Fig 3
Fig 3. PLD2 couples membrane stretch to mTORC2 activation and supports proper actin dynamics, directed cell migration, and membrane tension regulation.
(A) Representative western blot for PLD2 and band densitometry (see S1B Fig for complete blot). (B) Median of the immunofluorescence peak of pAkt 473 (as readout for mTORC2 activity) before and after a 70 mOsm hypo-osmotic shock (normalized to Nonsense shRNA untreated cells). Mean ± SEM. PLD2 is required for the membrane stretch-induced activation of mTORC2 (p < 0.05). (C) Transwell assay for chemotaxis. Mean ± SEM. PLD2 knockdown cells are highly defective in chemotaxis (p < 0.01). (D) Left: Representative images of Hem1-GFP (a subunit of the neutrophil WAVE2 complex) recruitment in Nonsense and PLD2 shRNA cells. Dashed white line corresponds to cell outline. Right: Quantification of area covered by wave fronts over a 10 min period. Mean ± SEM. PLD2 knockdown cells have significantly larger regions of WAVE2 complex recruitment (p < 0.05). See Materials and Methods for how the WAVE2 area measurements were performed. See S2 and S4 Movies. (E) Median of phalloidin staining before and 3 and 10 min after fMLP stimulation. PLD2 knockdown cells have more sustained actin assembly than control cells (p < 0.05). Mean ± SEM. (F) Static tether force for stimulated Nonsense and PLD2 shRNA cells. PLD2 knockdown cells have significantly increased membrane tension (p < 0.01). Nbiological replicates: B = 4. C = 8. D = 5. E = 5. F = 13. Ncells: B >10,000/data point. C = 300,000/well. D = 11 (Ns shRNA) and 15 (PLD2 shRNA). E >10,000/data point. F = 32 (Ns shRNA), 25 (PLD2 shRNA). Ntethers: F = 60 (Ns shRNA) and 52 (PLD2 shRNA). Statistics: Mann-Whitney test (D, E, F) and t test (B, C). Boxes in all box plots (F) extend from the 25th to 75th percentiles, with a line at the median. Whiskers extend to ×1.5 IQR (interquartile range) or the max/min data points if they fall within ×1.5 IQR.
Fig 4
Fig 4. PLD2 and mTORC2 are required to convert increases in membrane tension to decreases in actin network assembly.
(A) Prediction: Knockdown of the PLD2–mTORC2-based tension circuit should result in a slower decrease of actin nucleation following an increase in membrane tension. (B) Paired static tether force measurements for stimulated cells before and after 5 min of 70 mOsm hypo-osmotic shock. Connected colored lines indicate the same cell before and after hypo-osmotic shock. All conditions significantly increase their membrane tension following hypo-osmotic shock (p < 0.05). (C) Representative images of Hem1-GFP before and 10 sec after a 70 mOsm hypo-osmotic shock. Dashed white line corresponds to cell outline. Scale bar = 10 μm. Rictor and PLD2 knockdown cells are delayed in the detachment of the WAVE2 complex from the membrane following hypo-osmotic shock. See S4 Fig for complete time series of WAVE2 complex loss following 70 mOsm hypo-osmotic shock. (D) Quantification of the dynamics of Hem1-GFP on the membrane after 70 mOsm hypo-osmotic shock. Mean ± SEM. Rictor and PLD2 knockdown cells are delayed in the detachment of the WAVE2 complex from the membrane following hypo-osmotic shock (p < 0.05). Ncells: B = 8 (Ns shRNA), 12 (Rictor shRNA), and 7 (PLD2 shRNA). D = 22 (Ns shRNA), 17 (Rictor shRNA), and 12 (PLD2 shRNA). Ntethers: B = 17 (Ns shRNA), 19 (Rictor shRNA), and 9 (PLD2 shRNA). Statistics: paired t test (B) and t test (D). Boxes in all box plots (B) extend from the 25th to 75th percentiles, with a line at the median. Whiskers extend to ×1.5 IQR (interquartile range) or the max/min data points if they fall within ×1.5 IQR.
Fig 5
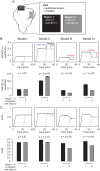
Fig 5. Probing possible topologies of membrane tension-based inhibition of actin network assembly.
(A) Schematic of the different network topologies investigated. Model I: WAVE2 complex dynamics in the absence of tension-mediated inhibition of actin polymerization (see also S5B Fig for early time points). Model II: Global inhibition of actin polymerization by membrane tension only. Model III: Global inhibition of the WAVE2 complex by mTORC2 only. Model IV: Two distinct negative feedbacks from membrane tension to actin network assembly (from tension to actin polymerization and from PLD2–mTORC2 to the WAVE2 complex). Model IV*: Model IV with reduced mTORC2 mediated feedback strength, reflecting our shRNA lines. See Materials and Methods and S1 Text for details of the simulation. (B) WAVE2 complex on the membrane before and after hypo-osmotic shock in the different models. Mean ± SD of 20 stochastic simulations. Only the models with the link from PLD2–mTORC2 to WAVE2 (Model III and Model IV) match our experimental observation of tension-based decreases in WAVE2 association with the membrane (Fig 4C and 4D). Inset: Ratio of models IV, IV*, showing that the difference is larger after osmotic shock. (C) Snapshots of typical simulations before and after osmotic shock (simulated as a step increase in membrane tension of 80 μN/m). See S5 Movie. (D) Quantification of the Wave Index (WI) in control (Ns shRNA), Rictor, and PLD2 shRNA cells before and after osmotic shock. Mean ± SEM. Data used from Fig 4D. (E) Quantification of the Wave Index in the different models before and after osmotic shock. Mean ± SD of 20 stochastic simulations. Model IV exhibits the expected increase of WI upon osmotic shock and shows a similar level of WI to experimental cells (Fig 5D). Ncells/simulations: D = 20 (Ns shRNA), 15 (Rictor shRNA), and 13 (PLD2 shRNA). E = 20 each condition. Statistics: Mann-Whitney test.
Fig 6
Fig 6. Simulated competition between two nucleating regions that share membrane tension.
(A) Schematic of competition simulations. We simulated the response of two spatially separate sites of actin assembly that are linked via membrane tension. The two regions each have individual dynamics of actin polymerization and WAVE2 membrane binding but are coupled via cellular membrane tension and level of mTORC2 activity. (B,C) Quantification of time-varying (graphs) and time-averaged (bar plots) WAVE2 complex (B) and polymerized actin (C) at the membrane. A site of actin nucleation (number 1) starts alone, but is then placed in competition with a second site of actin nucleation (number 2). Mean ± SD of 20 stochastic simulations. Only Models III and IV show competition between protrusions at the level of WAVE2 complex recruitment. See S8 Fig for how competition affects the Wave Index. Statistics: t test.
Fig 7
Fig 7. Working model of PLD2–TORC2 membrane tension negative feedback loop.
Actin assembly increases membrane tension, which activates two inhibitory links to actin network growth. In the first link, membrane tension directly inhibits actin polymerization by acting as a physical barrier to growth. In the second link, membrane tension acts through the PLD2–mTORC2 pathway to inhibit actin nucleation via the WAVE2 complex. This circuit forms a mechanosensory negative feedback loop that regulates membrane tension and controls the spatial organization of actin assembly during neutrophil polarity and movement.

Similar articles

Cited by

References

    1. Paluch E, Heisenberg C-P. Biology and physics of cell shape changes in development. Curr Biol. 2009;19: R790–9. 10.1016/j.cub.2009.07.029 - DOI - PubMed
    1. Yu H, Mouw JK, Weaver VM. Forcing form and function: biomechanical regulation of tumor evolution. Trends Cell Biol. 2011;21: 47–56. 10.1016/j.tcb.2010.08.015 - DOI - PMC - PubMed
    1. Boulant S, Kural C, Zeeh J-C, Ubelmann F, Kirchhausen T. Actin dynamics counteract membrane tension during clathrin-mediated endocytosis. Nat Cell Biol. 2011;13: 1124–1131. 10.1038/ncb2307 - DOI - PMC - PubMed
    1. Sinha B, Köster D, Ruez R, Gonnord P, Bastiani M, Abankwa D, et al. Cells respond to mechanical stress by rapid disassembly of caveolae. Cell. 2011;144: 402–413. 10.1016/j.cell.2010.12.031 - DOI - PMC - PubMed
    1. Houk AR, Jilkine A, Mejean CO, Boltyanskiy R, Dufresne ER, Angenent SB, et al. Membrane tension maintains cell polarity by confining signals to the leading edge during neutrophil migration. Cell. 2012;148: 175–188. 10.1016/j.cell.2011.10.050 - DOI - PMC - PubMed

MeSH terms

LinkOut - more resources