. 2016 Jun 9;12(6):e1006104.
doi: 10.1371/journal.pgen.1006104. eCollection 2016 Jun.

The Drosophila ETV5 Homologue Ets96B: Molecular Link between Obesity and Bipolar Disorder

Affiliations

The Drosophila ETV5 Homologue Ets96B: Molecular Link between Obesity and Bipolar Disorder

Michael J Williams et al. PLoS Genet. .

Abstract

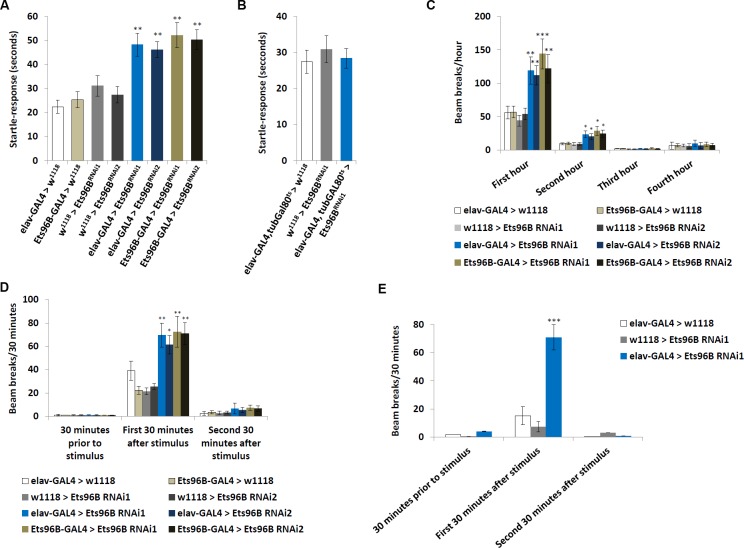
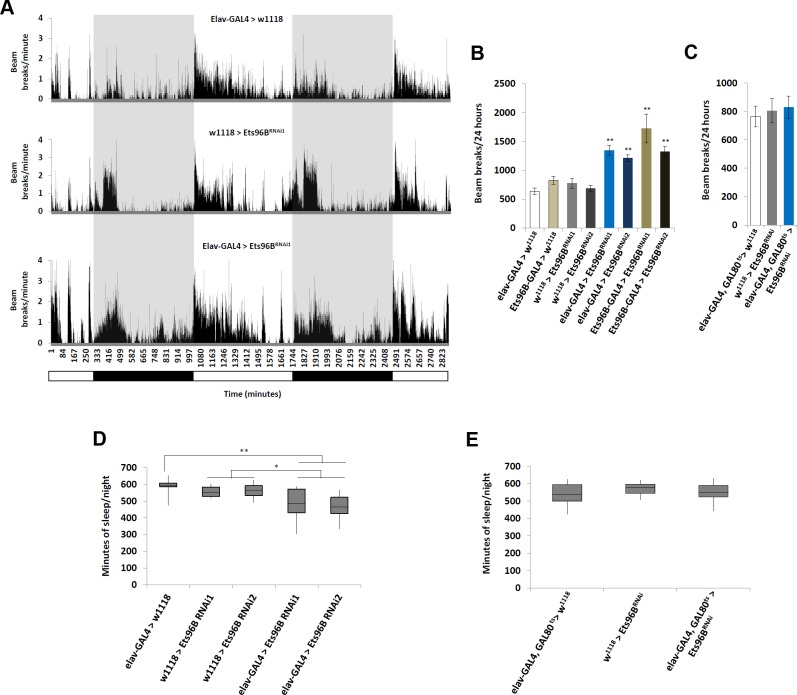
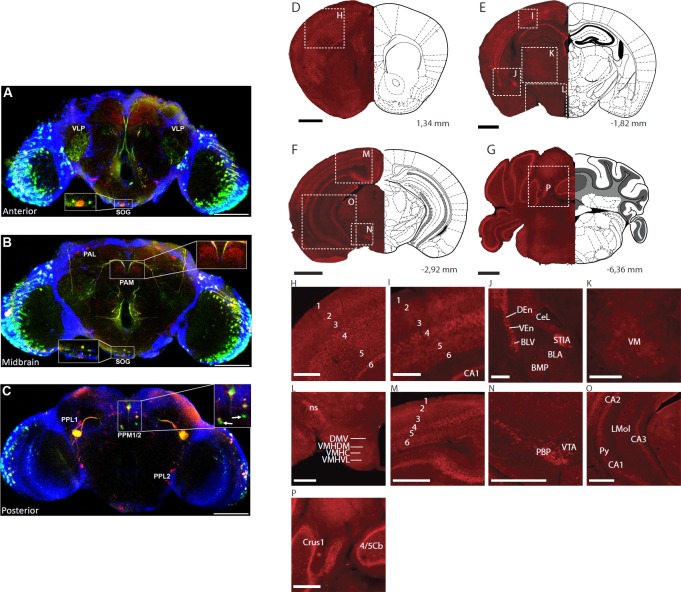
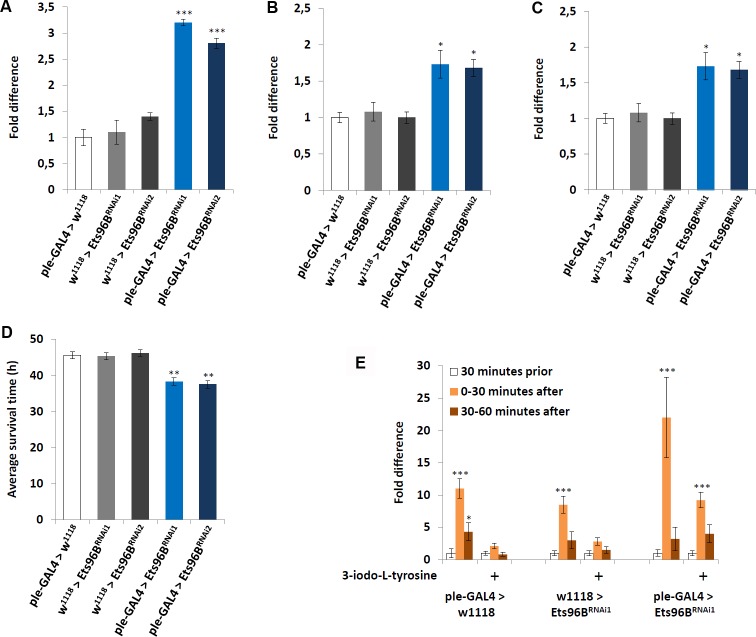
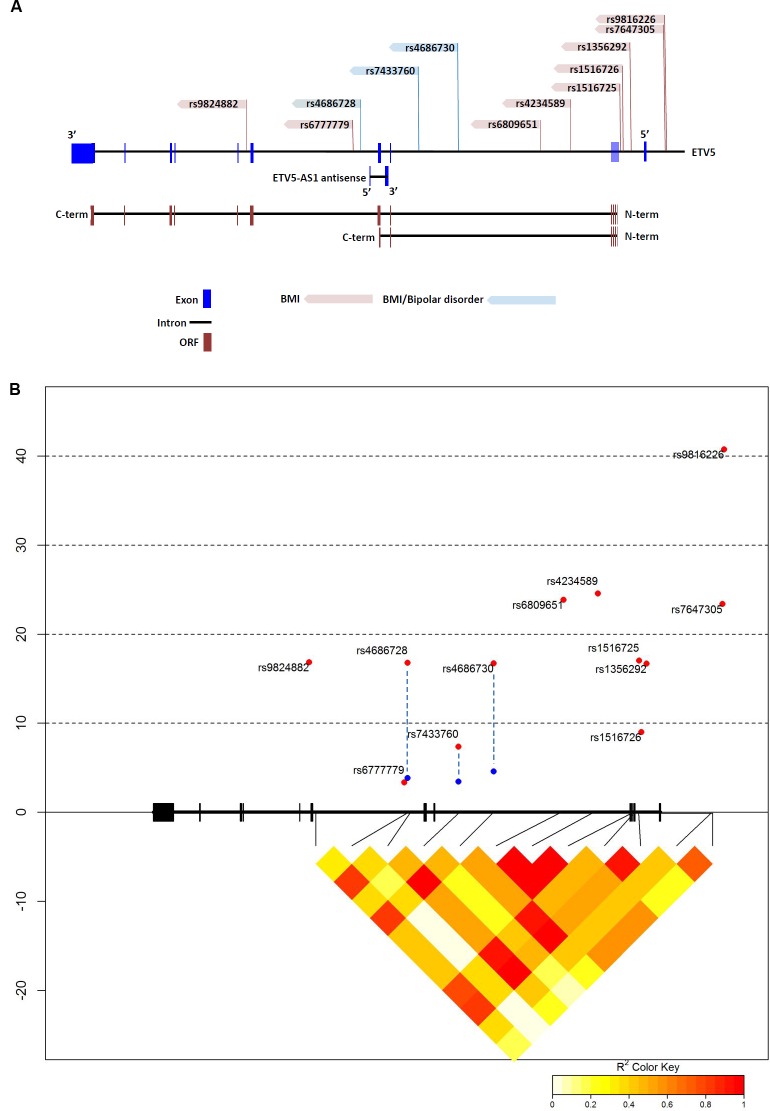
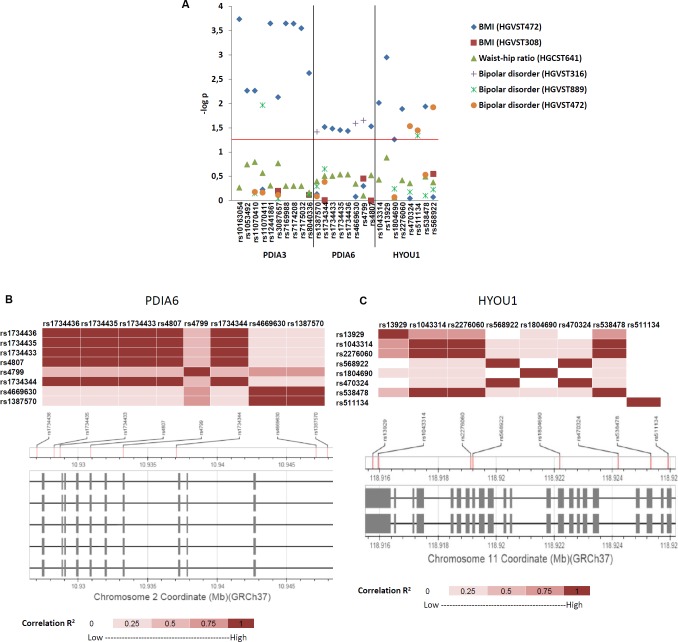
Several reports suggest obesity and bipolar disorder (BD) share some physiological and behavioural similarities. For instance, obese individuals are more impulsive and have heightened reward responsiveness, phenotypes associated with BD, while bipolar patients become obese at a higher rate and earlier age than people without BD; however, the molecular mechanisms of such an association remain obscure. Here we demonstrate, using whole transcriptome analysis, that Drosophila Ets96B, homologue of obesity-linked gene ETV5, regulates cellular systems associated with obesity and BD. Consistent with a role in obesity and BD, loss of nervous system Ets96B during development increases triacylglyceride concentration, while inducing a heightened startle-response, as well as increasing hyperactivity and reducing sleep. Of notable interest, mouse Etv5 and Drosophila Ets96B are expressed in dopaminergic-rich regions, and loss of Ets96B specifically in dopaminergic neurons recapitulates the metabolic and behavioural phenotypes. Moreover, our data indicate Ets96B inhibits dopaminergic-specific neuroprotective systems. Additionally, we reveal that multiple SNPs in human ETV5 link to body mass index (BMI) and BD, providing further evidence for ETV5 as an important and novel molecular intermediate between obesity and BD. We identify a novel molecular link between obesity and bipolar disorder. The Drosophila ETV5 homologue Ets96B regulates the expression of cellular systems with links to obesity and behaviour, including the expression of a conserved endoplasmic reticulum molecular chaperone complex known to be neuroprotective. Finally, a connection between the obesity-linked gene ETV5 and bipolar disorder emphasizes a functional relationship between obesity and BD at the molecular level.


Conflict of interest statement

The authors have declared that no competing interests exist.

Figures

Fig 1
Fig 1
Comparison of Drosophila Ets96B with mammalian PEA3-family members (A) The evolutionary relationship was inferred using the Maximum-likelihood method. The optimal tree with the sum of branch length = 3.794 is shown. The percentage of replicate trees in which the associated taxa clustered together in the bootstrap test (5000 replicates) are shown next to the branches. The tree is drawn to scale, with branch lengths in the same units as those of the evolutionary distances used to infer the phylogenetic tree. (B) The protein sequences were aligned and edited using CLC Sequence Viewer 6. Colors correspond to amino acid conservation (black = conserved, blue = no conservation). The predicted ETS DNA binding domain is indicated by a dark blue underlining of amino acids near C-terminus. Human sumoylation sites are indicated by black underlining; predicted Drosophila sumoylation site is indicated by light blue underlining.
Fig 2
Fig 2
Ets96B regulates genes involved in oxidative phosphorylation and redox reactions (A) Relative expression level of Ets96B in 5–7 day old control males or males where Ets96B was knocked down in the entire nervous system throughout development. This assay was repeated at least 7 times. (n = 25 males per treatment; ** P<0.005 compared with controls, one-way ANOVA with Tukey’s post hoc test for multiple comparisons). Error bars = SEM. (B) Pie chart showing KEGG classification of gene groups (percentage of total Ets96B up or down regulated genes /percentage of all genes in the genome belonging to a particular category). (C) Drosophila genome depicting the location of genes up (green) or down (red) regulated in Ets96B SOLiD sequencing of the entire Drosophila transcriptome.
Fig 3
Fig 3. Ets96B regulates a conserved molecular chaperone complex.
(A) SOLiD data for elav-GAL4>Ets96BRNAi versus controls (w, elav-GAL4>w1118 and w1118> Ets96BRNAi) 5–7 day old male heads. Only genes regulated more than ±log2 2.5-fold change are included. (B) Relative expression levels of CaBP1, ERp60 and Crc in 5–7 day old control males or males where Ets96B was knocked down in the entire nervous system throughout development. This assay was repeated at least 7 times. Error bars indicate SEM. (n = 25 males per treatment; *** P<0.005 compared with elav-GAL4 controls, one-way ANOVA with Tukey’s post hoc test for multiple comparisons). (C) Biogrid and String were used to find all genes that interact with the molecular chaperone genes recovered in the Ets96B knockdown males. Genes in red were recovered in the Ets96B SOLiD sequencing. (D) Data showing human homologues of Drosophila genes recovered in Biogrid and String analysis. Genes in red were recovered in the Ets96B SOLiD sequencing. (E) Diagram depicting molecules involved in endoplasmic reticulum protein folding. These include molecular chaperones that function to prevent aggregation (Bip, HSP90B1, DNAJC3, HYOU1 and CALR), protein disulfide isomerases that catalyze disulfide bond formation, isomerization and reduction (PDIA3, PDIA3 and P4HB), and proteins involved in de- or re-glycosylation of improperly folded glycoproteins (PRKCSH and UGGT1). Drosophila homologues that were up-regulated when Ets96B was knocked down are in red, and those that were up-regulated more than 2.5-fold are underlined.
Fig 4
Fig 4. Ets96B regulates starvation resistance.
(A) We tested the effect of Ets96B-knockdown in flies using the starvation survival assay. 5–7 day old control and Ets96B knockdown males (GAL4 driver crossed to either Ets96BRNAi1 or Ets96BRNAi2) were placed in a vial containing 1% agarose and maintained at 25°C. DAMS was used to monitor activity. (n = 30–60 flies per genotype, one-way ANOVA with Tukey’s post hoc test for multiple comparisons) (B) To examine how starvation affects the expression level of Ets96B, RNA was extracted from normal fed flies, as well as after 24 and 48 h of starvation. (C) To examine how nutritional state affects the expression levels of Ets96B, RNA was extracted under different nutritional states. Flies fed ad lib were set as 100%, represented by 1 on the graphs (B, C: n = 10 replicates, one-way ANOVA with Tukey’s post hoc test for multiple comparisons) (D, E) Triglyceride levels were determined in male flies at 0, 12 and 24 hours of starvation. The (D) elav-Gal4 driver was used to express Ets96B RNAi (Ets96BRNAi1 or Ets96BRNAi2) throughout development (UAS-Ets96BRNAi1 and UAS-Ets96BRNAi2) and (E) the elav-GAL4,tub-GAL80ts driver was used to knockdown Ets96B (Ets96BRNAi1 or Ets96BRNAi2) in adult males. (D, E: n = 30 males per treatment, assay was repeated at least 10 times for each genotype, one-way ANOVA with Tukey’s post hoc test for multiple comparisons). In all graphs significance levels are indicated: *, P<0.05; **, P<0.01; ***, P <0.005. Error bars = SEM.
Fig 5
Fig 5. Ets96B knockdown during development induces a heightened startle-response.
(A, B) Startle-response test demonstrating Ets96B knockdown males have a hyperactive startle-response. (A) Ets96B knocked down throughout development using UAS-Ets96BRNAi1 or UAS-Ets96BRNAi2 crossed to the pan-neuronal driver elav-GAL4 (B) Ets96B knocked down only in adults using UAS-Ets96BRNAi1 crossed to the pan-neuronal driver and temperature sensitive allele of the GAL4 inhibitor GAL80 elav-GAL4, tub-Gal80ts. (A, B: n = 50 males per strain; ** P<0.01 compared with controls, one-way ANOVA with Tukey’s post hoc test for multiple comparisons). (C) The DAMS system was used to monitor locomotion for the first four hours flies were placed in the system. (D) The DAMS system was used to monitor locomotion prior to and after light stimulation. (E) The DAMS system was used to monitor locomotion prior to and after sound stimulation (65–70 dB). Only Ets96BRNAi1 was used for this assay. (C-E: n = 30–60 males per strain; * P < 0.05, ** P<0.01, *** P < 0.005 compared with controls, one-way ANOVA with Tukey’s post hoc test for multiple comparisons) In all graphs error bars = SEM.
Fig 6
Fig 6. Ets96B regulates activity and sleep/wake behaviour.
The DAMS system was used to monitor locomotion and sleep/wake behaviour over a 48 hour period. (A) Bar diagram indicating general activity over a 48 hour period of adult flies maintained on a 12:12 hour light:dark cycle. White bar indicates lights-on and dark bar and gray highlight indicate lights-off. Representative result for one run using Ets96BRNAi1 is shown (B) Total number a beam breaks over a 24 hour period in control flies or flies were Ets96B was knocked down (Ets96BRNAi1 or Ets96BRNAi2) throughout development either in the entire nervous system (elav-GAL4) or specifically in Ets96B neurons (Ets96B-GAL4). (C) Total number a beam breaks over a 24 hour period in control flies or flies were Ets96B was knocked down (Ets96BRNAi1) specifically in adult neurons (elav-GAL4;tubGAL80ts). (D) Total minutes flies slept per night in control flies or flies were Ets96B was knocked down (Ets96BRNAi1 or Ets96BRNAi2) throughout development, either in the entire nervous system (elav-GAL4) or specifically in Ets96B neurons (Ets96B-GAL4). (E) Total minutes flies slept per night in control flies or flies were Ets96B was knocked down (Ets96BRNAi1) specifically in adult neurons (elav-GAL4;tubGAL80ts). (B-E, n = 30–60 males per strain; * P < 0.05, ** P<0.01 compared with controls, one-way ANOVA with Tukey’s post hoc test for multiple comparisons) In all graphs error bars = SEM.
Fig 7
Fig 7. Ets96B and Etv5 expressed on dopaminergic neurons.
(A-C) Ets96B-GAL4 was crossed to UAS-GFP to examine Ets96B expression in adult male brains. Adult male brains were then stained for GFP and Tyrosine hydroxylase (TH) expression. (A) Anterior section showing co-expression of GFP and TH in the eye, the ventrolateral prototcerebrum (VLP and the suboesophageal ganglion (SOG, see inset). (B) Midbrain, no co-expression was observed in the dopaminergic clusters PAM or PAL, while coexpression was observed in the SOG (see inset). (C) In the posterior brain section no co-expression was observed in dopaminergic clusters PPL1 or PPL2, but there was co-expression of GFP and TH in cluster PPM1/2 (see inset). There were also two neurons near the dopaminergic PPM1/2 cluster that were GFP specific, and had no TH expression (see inset, white arrow). In A-C size bar is equivalent to 100 μm. (D-G) Black scale bar, 1mm. (H-P) white scale bar, 0.5 mm. Bregma levels and described brain regions are according to Allen Mouse Brain Atlas. (H, I) Cortex layers 1–6. (J) basolateral amygdaloid nucleus, anterior part (BLA), basolateral amygdaloid nucleus, ventral part (BLV), basomedial amygdaloid nucleus, posterior part (BMP), central nucleus of amygdala, lateral part (CeL), dorsal endopiriform claustrum (DEn), stria medullaris (STIA), ventral endopiriform claustrum (VEn), (K) ventromedial thalamic nucleus (VM), (L) dorsomedial hypothalamic nucleus, ventral part (DMV), nigrostriatal tract (ns), ventromedial hypothalamic nucleus, central part (VMHC), ventromedial hypothalamuc nucleus, dorsomedial part (VMHDM), ventromedial hypothalamic nucleus, ventrolateral part (VMHVL), (M) Cortex layers 1–6, (N) parabrachial pigmented nucleus of the VTA (PBP), ventral tegmental area (VTA), (O) field CA1 of the hippocampus (CA1), field CA2 of the hippocampus (CA2), field CA3 of the hippocampus (CA3), lacunosum moleculare layer of the hippocampus (LMol), pyramidal layer of the hippocampus (Py), (P) crus 1 of the ansiform lobule (Crus1), lobule 4 and 5 of the cerebellar vermis (4/5Cb).
Fig 8
Fig 8. Ets96B required in dopaminergic neurons.
(A-C) Ets96B was knocked down throughout development (Ets96BRNAi1 or Ets96BRNAi2) specifically in dopaminergic neurons using the ple-GAL4 driver and the transcript level of genes (A) ple, (B) Vmat and (C) DAT was measured. RNA was collected from the heads of 5- to 7-day-old males for each genotype. qPCR was repeated at least 7 times for each transcript. (n = 25 males per treatment; * P<0.05, *** P<0.005 compared with controls, one-way ANOVA with Tukey’s post hoc test for multiple comparisons) (D) Ets96B was knocked down throughout development (Ets96BRNAi1 or Ets96BRNAi2) specifically in dopaminergic neurons using the ple-GAL4 driver. 5–7 day old control and Ets96B knockdown males were placed in a vial containing 1% agarose and maintained at 25°C, DAMS was used to monitor activity. (n = 30–60 flies per genotype, ** = P < 0.01, one-way ANOVA was used to determine significance with Tukey’s post hoc test for multiple comparisons). (E) The DAMS system was used to monitor locomotion prior to and after light stimulation. Only Ets96BRNAi1 was used for this assay. (n = 30 males per strain; * P<0.05, *** P<0.005 compared with controls, Kruskal-Wallis non-parametric ANOVA was used to determine significance). In all graphs error bars = SEM.
Fig 9
Fig 9. Human ETV5 SNPs associated with body mass index and bipolar disorder.
(A) Localization of relevant single nucleotide polymorphisms (SNPs) in the ETV5 gene. SNP names according to NCBI dbSNP. The GWAS central database was used to link ETV5 associated SNPS to BMI. Interestingly, three SNPs were also associated with bipolar disorder (blue SNPs). The three bipolar-linked SNPs all localize around exons 6 and 7, which is also the location of the long, noncoding RNA (lncRNA) ETV5-AS1. Snap Proxy was then used to determine Pair-linked disequilibrium in various populations. (B) Linkage disequilibrium between SNPs in ETV5. Black boxes = exons, thick black lines between boxes = introns, red points = SNPs associated with BMI in GWAS, blue points = SNPs associated with bipolar disorder in GWAS. The LD between SNPs in the CEU population is expressed as R2 and displayed as a color code below the plot.
Fig 10
Fig 10. Human ER molecular chaperon SNPs associated with body mass index and bipolar disorder.
(A) Summary figure of SNP association results from Genome Central [39] for PDIA3, PDIA6 and HYOU1 linkage to body mass index (BMI), Weight-hip ratio and bipolar disorder. Horizontal axis lists significant SNPs and genes. The red line represents P = 0.05 nominal significance level; above the line represents significant results. (B) Linkage disequilibrium between SNPs in PDIA6. Boxes = exons, lines between boxes = introns, The LD between SNPs in the CEU population is expressed as R2 and displayed as a color code below the plot. (C) Linkage disequilibrium between SNPs in HYOU1. Boxes = exons, lines between boxes = introns, The LD between SNPs in the CEU population is expressed as R2 and displayed as a colour code below the plot.

Similar articles

Cited by

References

    1. Houben K, Nederkoorn C, Jansen A. Eating on impulse: the relation between overweight and food-specific inhibitory control. Obesity. 2014;22:6–8. - PubMed
    1. Murphy CM, Stojek MK, Mackillop J. Interrelationships among Impulsive Personality Traits, Food Addiction, and Body Mass Index. Appetite. 2014;73:45–50. - PMC - PubMed
    1. Osby U, Brandt L, Correia N, Ekbom A, Sparen P. Excess mortality in bipolar and unipolar disorder in Sweden. Arch Gen Psychiatry. 2001;58:844–850. - PubMed
    1. Keck PE, McElroy SL. Bipolar disorder, obesity, and pharmacotherapy-associated weight gain. J Clin Psychiatry. 2003;64:1426–1435. - PubMed
    1. Maina G, Salvi V, Vitalucci A, D'Ambrosio V, Bogetto F. Prevalence and correlates of overweight in drug-naive patients with bipolar disorder. J Affect Disord. 2008;110:149–155. 10.1016/j.jad.2007.12.233 - DOI - PubMed

Publication types

MeSH terms