. 2016 Jun 9;12(6):e1005663.
doi: 10.1371/journal.ppat.1005663. eCollection 2016 Jun.

Sequential Dysfunction and Progressive Depletion of Candida albicans-Specific CD4 T Cell Response in HIV-1 Infection

Affiliations

Sequential Dysfunction and Progressive Depletion of Candida albicans-Specific CD4 T Cell Response in HIV-1 Infection

Fengliang Liu et al. PLoS Pathog. .

Abstract

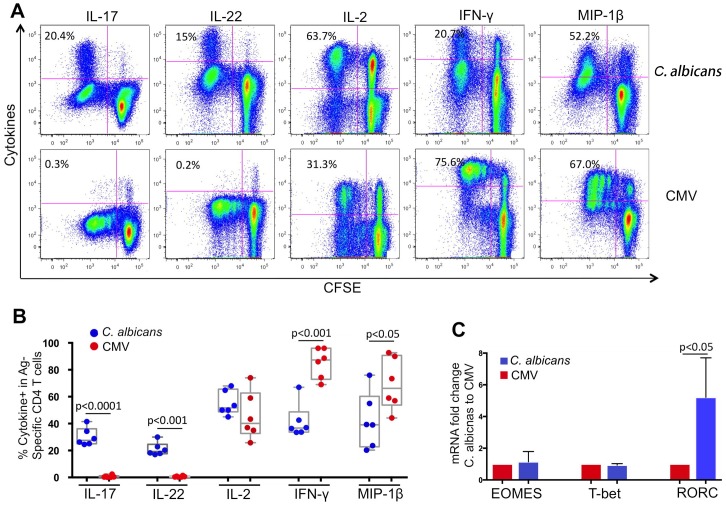
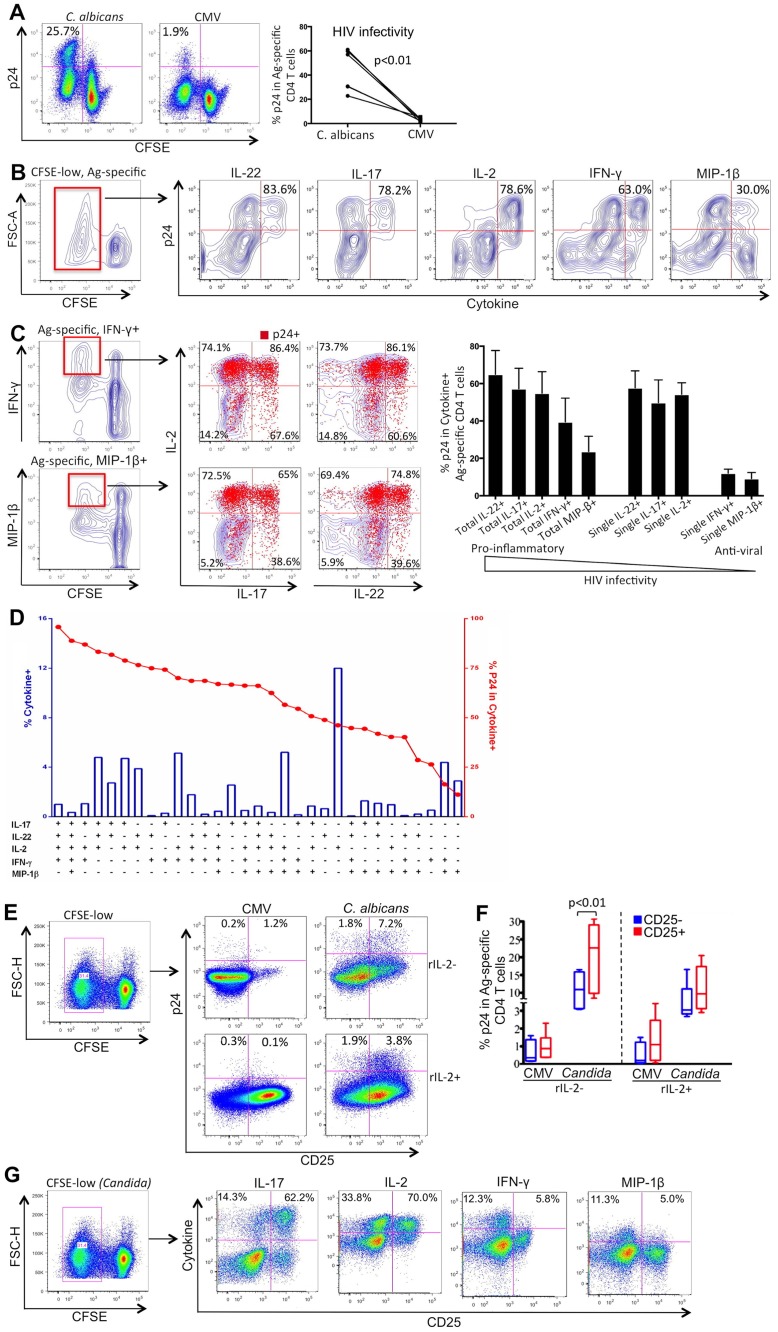
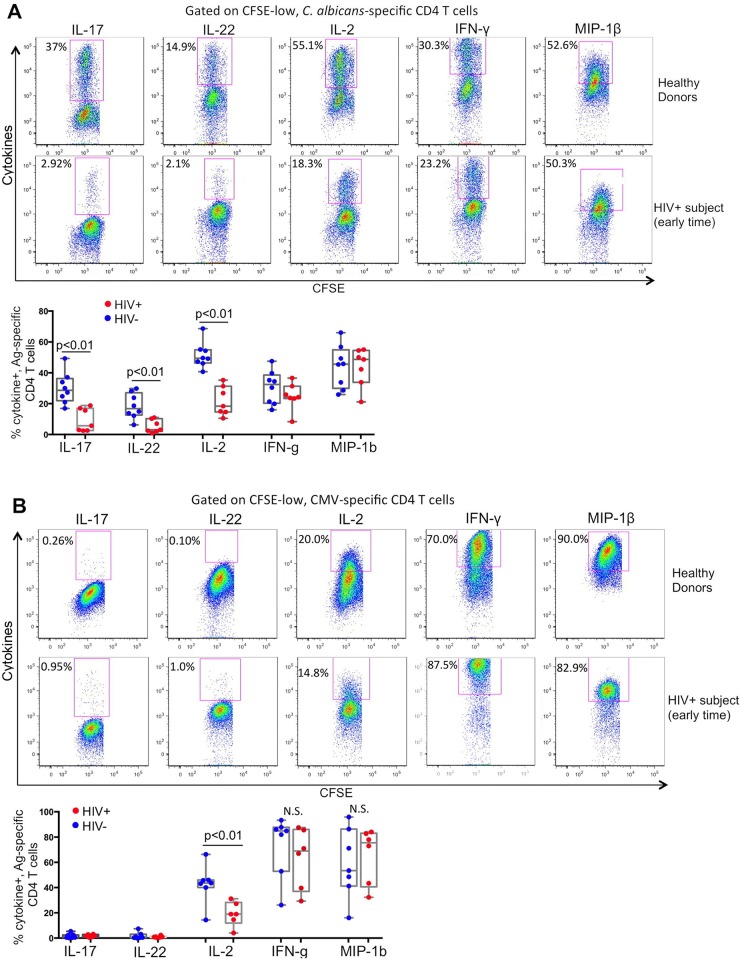
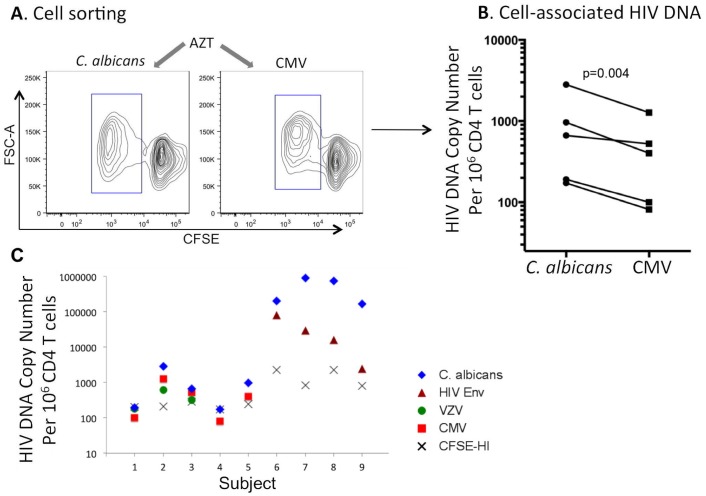
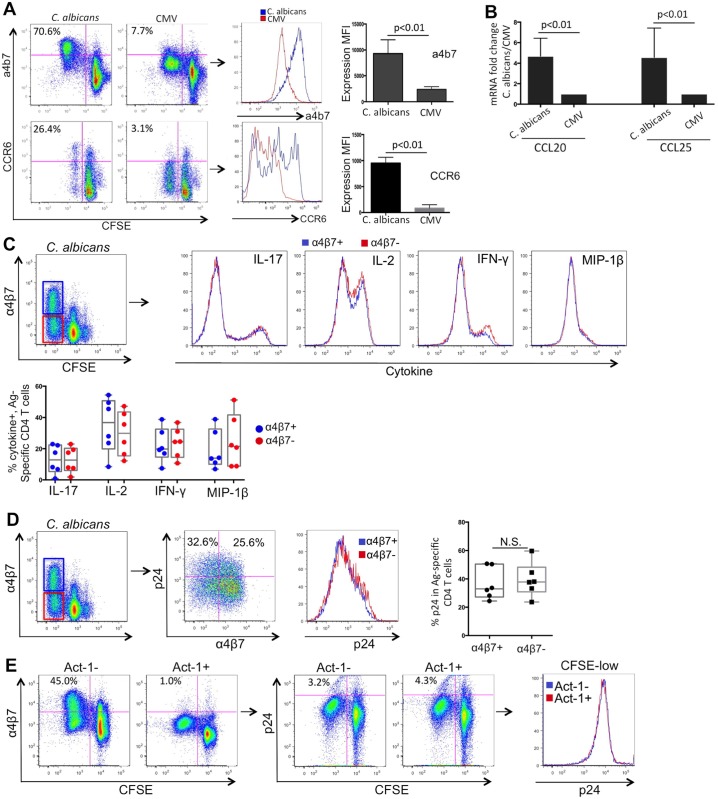
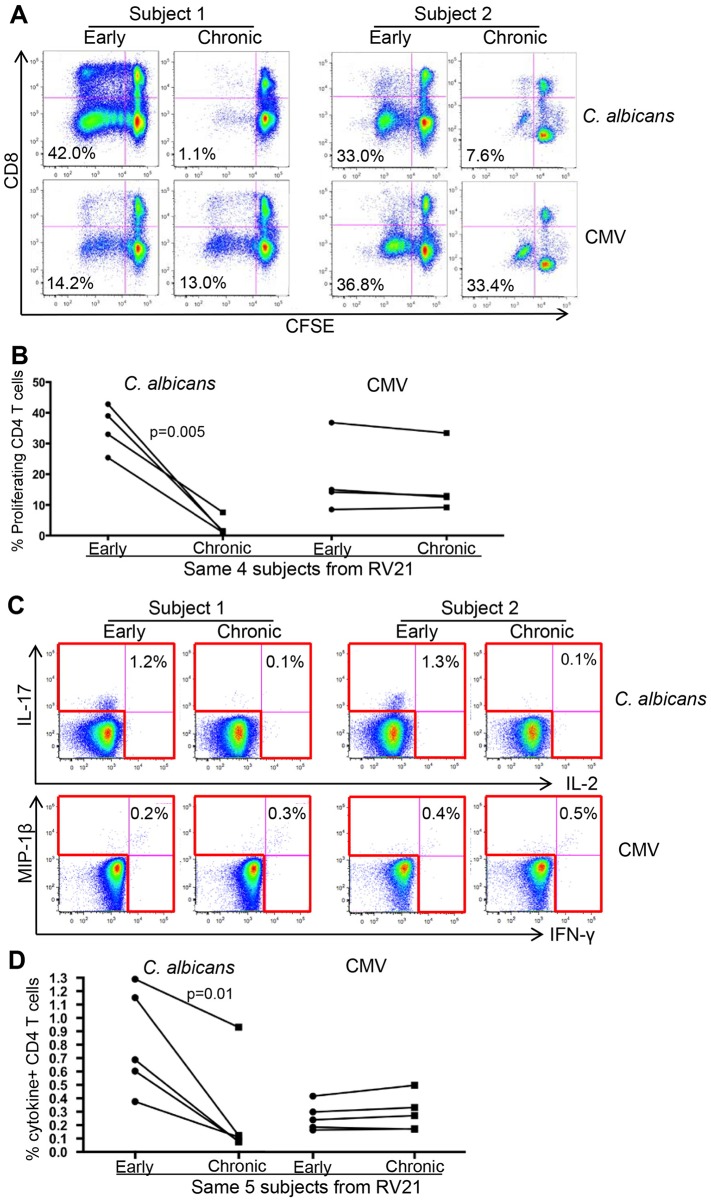
Loss of immune control over opportunistic infections can occur at different stages of HIV-1 (HIV) disease, among which mucosal candidiasis caused by the fungal pathogen Candida albicans (C. albicans) is one of the early and common manifestations in HIV-infected human subjects. The underlying immunological basis is not well defined. We have previously shown that compared to cytomegalovirus (CMV)-specific CD4 cells, C. albicans-specific CD4 T cells are highly permissive to HIV in vitro. Here, based on an antiretroviral treatment (ART) naïve HIV infection cohort (RV21), we investigated longitudinally the impact of HIV on C. albicans- and CMV-specific CD4 T-cell immunity in vivo. We found a sequential dysfunction and preferential depletion for C. albicans-specific CD4 T cell response during progressive HIV infection. Compared to Th1 (IFN-γ, MIP-1β) functional subsets, the Th17 functional subsets (IL-17, IL-22) of C. albicans-specific CD4 T cells were more permissive to HIV in vitro and impaired earlier in HIV-infected subjects. Infection history analysis showed that C. albicans-specific CD4 T cells were more susceptible to HIV in vivo, harboring modestly but significantly higher levels of HIV DNA, than CMV-specific CD4 T cells. Longitudinal analysis of HIV-infected individuals with ongoing CD4 depletion demonstrated that C. albicans-specific CD4 T-cell response was preferentially and progressively depleted. Taken together, these data suggest a potential mechanism for earlier loss of immune control over mucosal candidiasis in HIV-infected patients and provide new insights into pathogen-specific immune failure in AIDS pathogenesis.


Conflict of interest statement

The authors have declared that no competing interests exist.

Figures

Fig 1
Fig 1. Functional characteristics of C. albicans- and CMV-specific CD4 T cells in healthy subjects.
(A) Representative flow cytometric plots are shown for different cytokine expression in CFSE-low CD4+ T cells in PBMC after cognate antigen C. albicans (top) or CMV (bottom) stimulation. CFSE-labeled healthy donor PBMCs were stimulated with antigens for 6 days, followed by re-stimulation with PMA for de novo cytokine synthesis. CD3+CD4+ T lymphocytes are gated for analysis and the number in each plot indicates the percentage of CFSE-low Ag-specific CD4 T cells positive for each cytokine. (B) Comparison for percentages of Ag-specific CD4 T cells positive for each cytokine (cytokine+ CFSE-low%) between C. albicans- and CMV-specific CD4 T cells from multiple healthy subjects (n = 6). (C) Gene expression of Th1 (T-bet and EOMES) and Th17 (RORC) lineage-specific transcription factors between C. albicans- and CMV-specific CD4 T cells. Ag-specific CD4 T cells were sorted from PBMCs based on CFSE-low and subjected to RNA extraction and real-time PCR quantification. The data is shown as fold change for mRNA levels in C. albicans-specific CD4 T cells relative to CMV-specific CD4 T cells.
Fig 2
Fig 2. HIV infectivity in functional subsets of C. albicans-specific CD4 T cells.
(A) Overall in vitro HIV susceptibility of C. albicans- and CMV-specific CD4 T cells in the same healthy donor PBMCs. CFSE-labeled PBMCs were stimulated with C. albicans (left) or CMV (right) for 3 days, and exposed to HIV for infection. HIV infection of Ag-specific CD4 T cells was examined as intracellular p24+ rates in CFSE-low CD4 T cells (number in top-left quadrant). Representative flow cytometric data (left) and cumulative results (right) are shown. (B) Flow cytometric analysis of HIV infection in each cytokine+ subset of C. albicans-specific CD4 T cells. CFSE-low, C. albicans-specific CD4 T cells were gated (left) and co-expression of intracellular p24 and cytokine within the gated population was analyzed (right). Number in top-right quadrant shows p24+ percentage in each cytokine+ population. (C) Analysis of HIV infectivity (p24+, red dot) in IFN-γ- or MIP-1β-producing, C. albicans-specific CD4 T cells with or without co-expression with IL-2, IL-17 or IL-22 (blue background). Number in each quadrant shows p24+% in each functional subset of C. albicans-specific CD4 T cells and calculated using FlowJo program. Comparison of HIV infectivity (p24+%) in different functional subsets of C. albicans-specific CD4 T cells is shown (n = 6). (D) Boolean gating and spice analysis for HIV infectivity (p24+%) in all different functional subsets of C. albicans-specific CD4 T cells. (E) Analysis of CD25 expression and HIV infectivity in C. albicans and CMV-specific CD4 T cells with (top) and without (bottom) exogenous rIL-2. Number in each quadrant shows p24+% in CD25- or CD25+ subset of CFSE-low, Ag-specific CD4 T-cell population. (F) Cumulative data comparing p24+% in CD25- and CD25+ subset for multiple subjects (n = 6). (G) Analysis of CD25 and cytokine co-expression in C. albicans-specific CD4 T cells. Two-tailed p values are denoted.
Fig 3
Fig 3. Functional profiles of C. albicans- and CMV-specific CD4 T-cell responses in healthy donors and HIV-infected subjects.
(A) Functional profile of C. albicans-CD4 T cell responses. Representative flow cytometry data showing expression of each cytokine in CFSE-low, C. albicans-specific CD4 T cells in PBMCs of un-infected healthy (top) or HIV-infected (bottom) subjects. PBMCs of HIV-infected subjects used here were collected during early infection before massive CD4 depletion occurred. Shown are the gated CFSE-low CD4 T cells and the number in each plot shows cytokine+ % in CFSE-low C. albicans-specific CD4 T cells. Comparison for percentage of C. albicans-specific CD4 T cells positive for each cytokine from multiple un-infected and HIV-infected subjects (n = 7) is shown. (B) Functional profile of CMV-specific CD4 T cell responses. Representative flow cytometry data showing expression of each cytokine in CFSE-low, CMV-specific CD4 T cells in PBMCs of un-infected healthy (top) or HIV-infected (bottom) subjects. Comparison for multiple un-infected (n = 7) and infected subjects (n = 6) is also shown. Two-tailed p values are denoted. N.S. represents non-significant.
Fig 4
Fig 4. Quantification of cell-associated HIV DNA in sorted Ag-specific CD4 T cells of HIV-infected subjects.
(A) PBMCs of untreated HIV-infected subjects (early during infection before massive CD4 depletion occurred) were CFSE-labeled and stimulated with C. albicans or CMV antigen in the presence of AZT, to prevent de novo HIV replication, for 5 days. C. albicans- and CMV-specific CD4 T cells were sorted from PBMCs based on CFSE-low. (B) Cell-associated HIV DNA in sorted CD4 T cells was quantified by real-time PCR and compared between C. albicans and CMV antigens (n = 5). (C) Comparison of cell-associated HIV DNA in C. albicans-specific CD4 T cells with that in CMV-specific (red), VZV-specific (green), HIV Env-specific (purple) and CFSE-Hi non-specific (gray) CD4 T cells within the same HIV-infected individuals.
Fig 5
Fig 5. Analysis of mucosal homing markers of C. albicans-specific and CMV-specific CD4 T cells.
(A) Representative flow cytometry dot plots (left) and histogram comparison (middle) for expression of α4β7 and CCR6 between C. albicans- and CMV-specific CD4 T cells are shown. Cumulative results for comparing mean fluorescence intensity (MFI) of α4β7 and CCR6 expression between C. albicans- and CMV-specific CD4 T cells is also shown (right) (n = 6). (B) Gene expression of mucosal homing chemokines CCL-20 and CCL-25 in sorted C. albicans- and CMV-specific CD4 T cells. The data is shown as fold change for C. albicans-specific CD4 T cells relative to CMV-specific CD4 T cells. (C) Comparison of cytokine expression in α4β7+ (blue) and α4β7- subsets (red) of C. albicans-specific CD4 T cells. Representative histogram (top) and cumulative results for comparing cytokine+% between α4β7+ and α4β7- subset (bottom) are shown. (D) Comparison of HIV infectivity (p24+%) in α4β7+ and α4β7- subsets of C. albicans-specific CD4 T cells. Both representative and cumulative results are shown. (E) Impact of α4β7 blocking by ACT-1 antibody on HIV infectivity in C. albicans-specific CD4 T cells.
Fig 6
Fig 6. Preferential and progressive depletion of C. albicans-specific CD4 T-cell response in HIV-infected subjects.
(A) Representative flow cytometry data (2 subjects) showing C. albicans- (top) and CMV-specific (bottom) CD4 T-cell proliferative responses within the same PBMCs from HIV-infected subjects who manifested ongoing CD4 depletion. PBMCs collected at early infection (high CD4 count) and chronic infection (low CD4 count) from the same subjects are shown (gated on CD3+ T cells). (B) Longitudinal magnitudes of C. albicans- (left) and CMV- (right) CD4 T-cell proliferative responses from multiple HIV-infected subjects (n = 4) are shown. (C) Short-term ex vivo stimulation of PBMCs with peptide pools (C. albicans MP65 and CMV pp65) and intracellular cytokine staining for measuring frequencies of Ag-specific CD4 T cells in PBMCs. Representative data from 2 subjects show cytokine expression in C. albicans- (IL-17 and IL-2) and CMV-specific (IFN-γ and MIP-1β) CD4 T cells. The number in each plot shows total percentage of CD4 T cells expressing one and both cytokines. (D) Longitudinal frequencies of C. albicans- (left) and CMV- (right) CD4 T cells from multiple HIV-infected subjects (n = 5) are shown. Two-tailed p values are denoted.

Similar articles

Cited by

References

    1. Moir S, Chun TW, Fauci AS. Pathogenic mechanisms of HIV disease. Annual review of pathology. 2011;6:223–48. Epub 2010/11/03. 10.1146/annurev-pathol-011110-130254 . - DOI - PubMed
    1. Maartens G, Celum C, Lewin SR. HIV infection: epidemiology, pathogenesis, treatment, and prevention. Lancet. 2014;384(9939):258–71. 10.1016/S0140-6736(14)60164-1 . - DOI - PubMed
    1. Douek DC, Roederer M, Koup RA. Emerging concepts in the immunopathogenesis of AIDS. Annu Rev Med. 2009;60:471–84. 10.1146/annurev.med.60.041807.123549 - DOI - PMC - PubMed
    1. Munoz A, Schrager LK, Bacellar H, Speizer I, Vermund SH, Detels R, et al. Trends in the incidence of outcomes defining acquired immunodeficiency syndrome (AIDS) in the Multicenter AIDS Cohort Study: 1985–1991. Am J Epidemiol. 1993;137(4):423–38. . - PubMed
    1. Mocroft A, Youle M, Phillips AN, Halai R, Easterbrook P, Johnson MA, et al. The incidence of AIDS-defining illnesses in 4883 patients with human immunodeficiency virus infection. Royal Free/Chelsea and Westminster Hospitals Collaborative Group. Arch Intern Med. 1998;158(5):491–7. . - PubMed