. 2016 Jun 9;11(6):e0155878.
doi: 10.1371/journal.pone.0155878. eCollection 2016.

Low Density Lipoprotein-Receptor Related Protein 1 Is Differentially Expressed by Neuronal and Glial Populations in the Developing and Mature Mouse Central Nervous System

Affiliations

Low Density Lipoprotein-Receptor Related Protein 1 Is Differentially Expressed by Neuronal and Glial Populations in the Developing and Mature Mouse Central Nervous System

Loic Auderset et al. PLoS One. .

Abstract

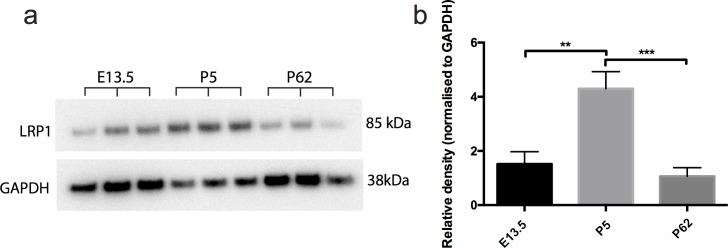
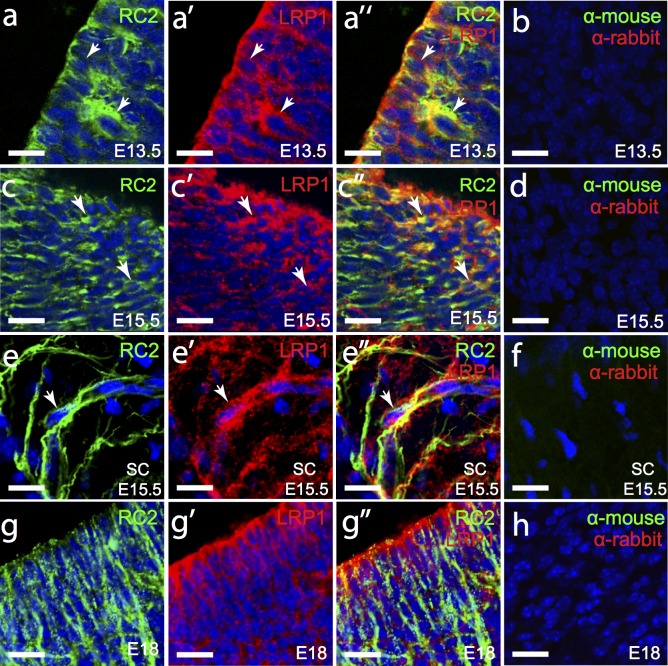
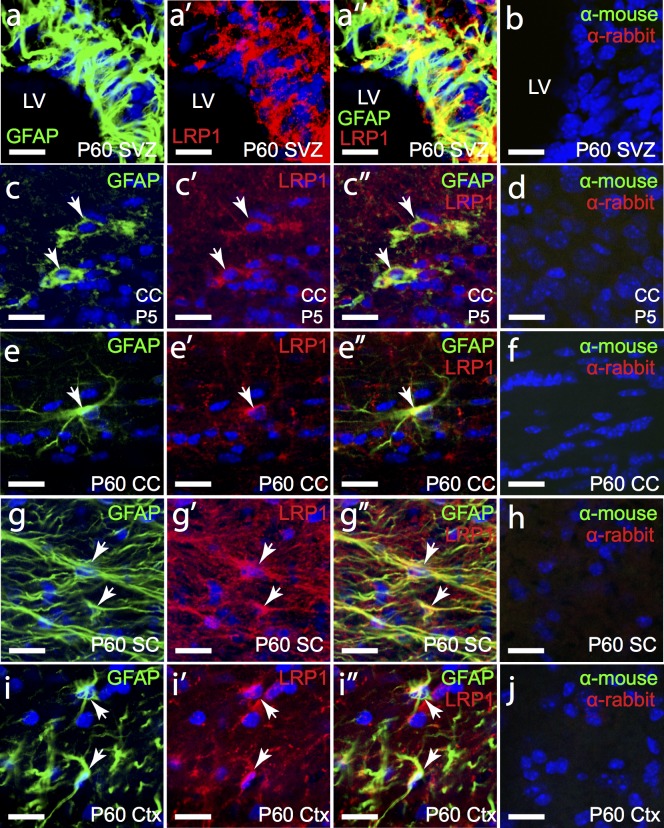
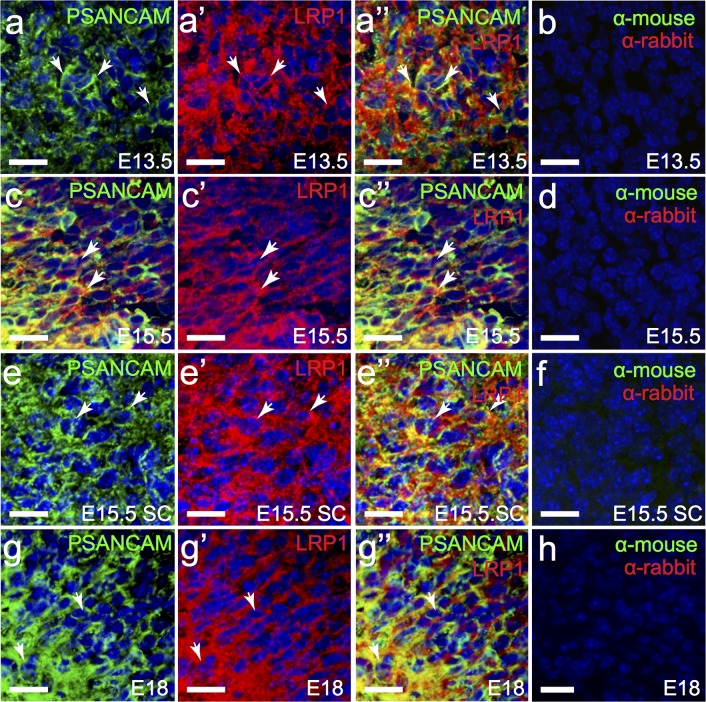
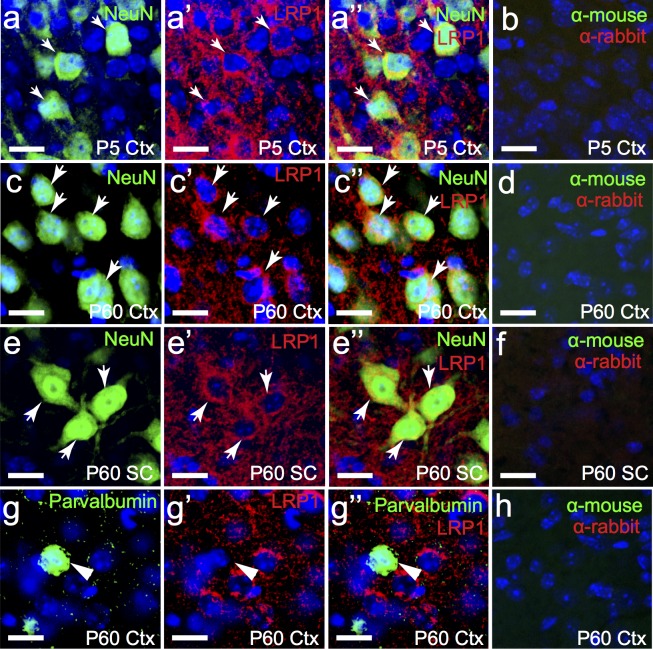
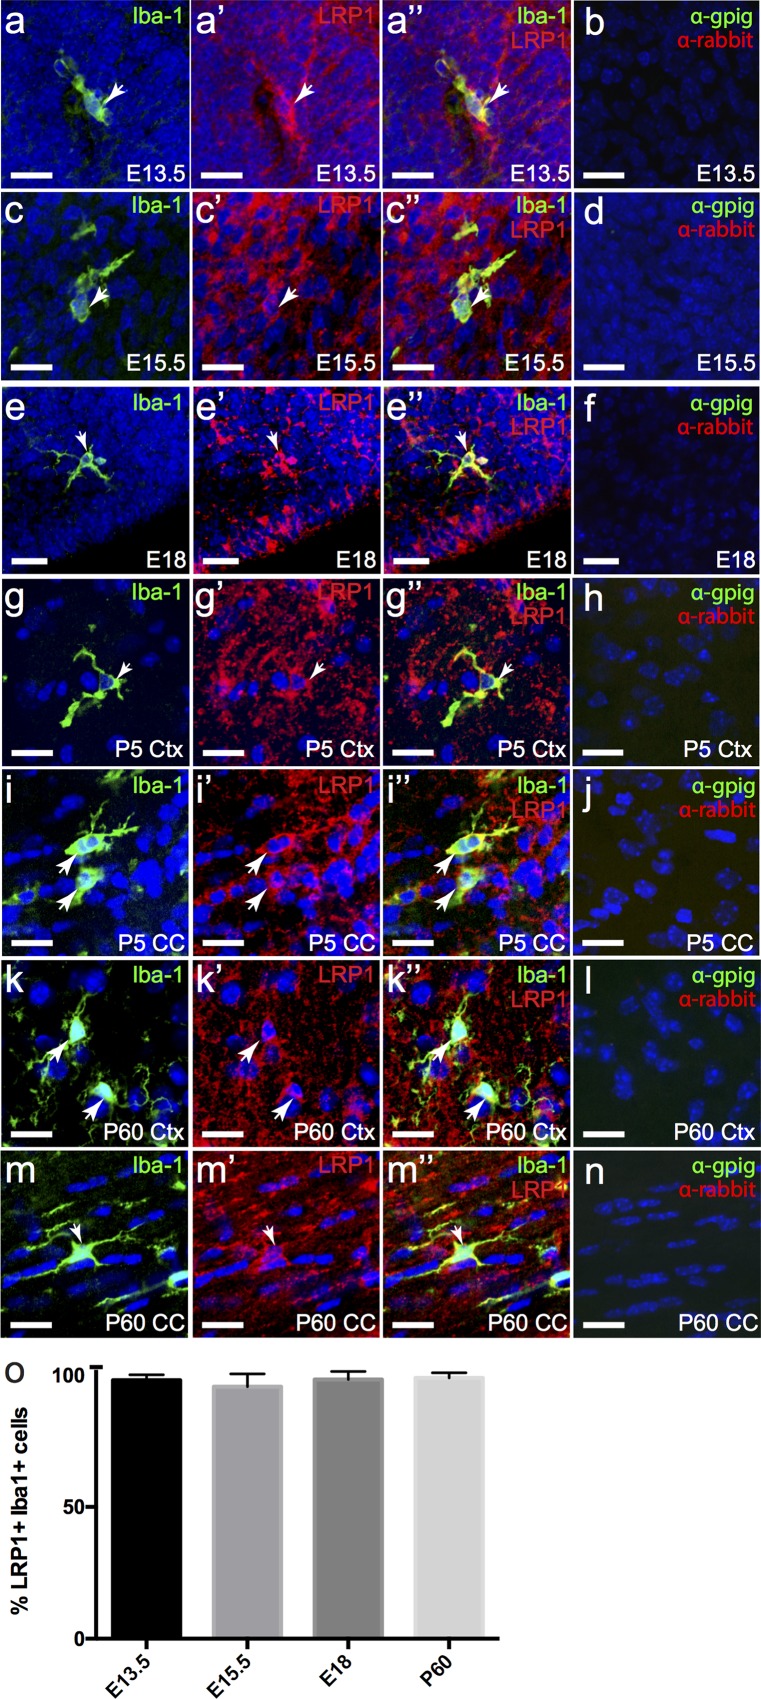
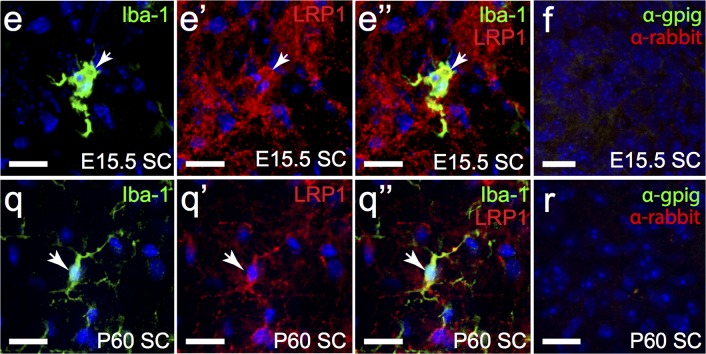
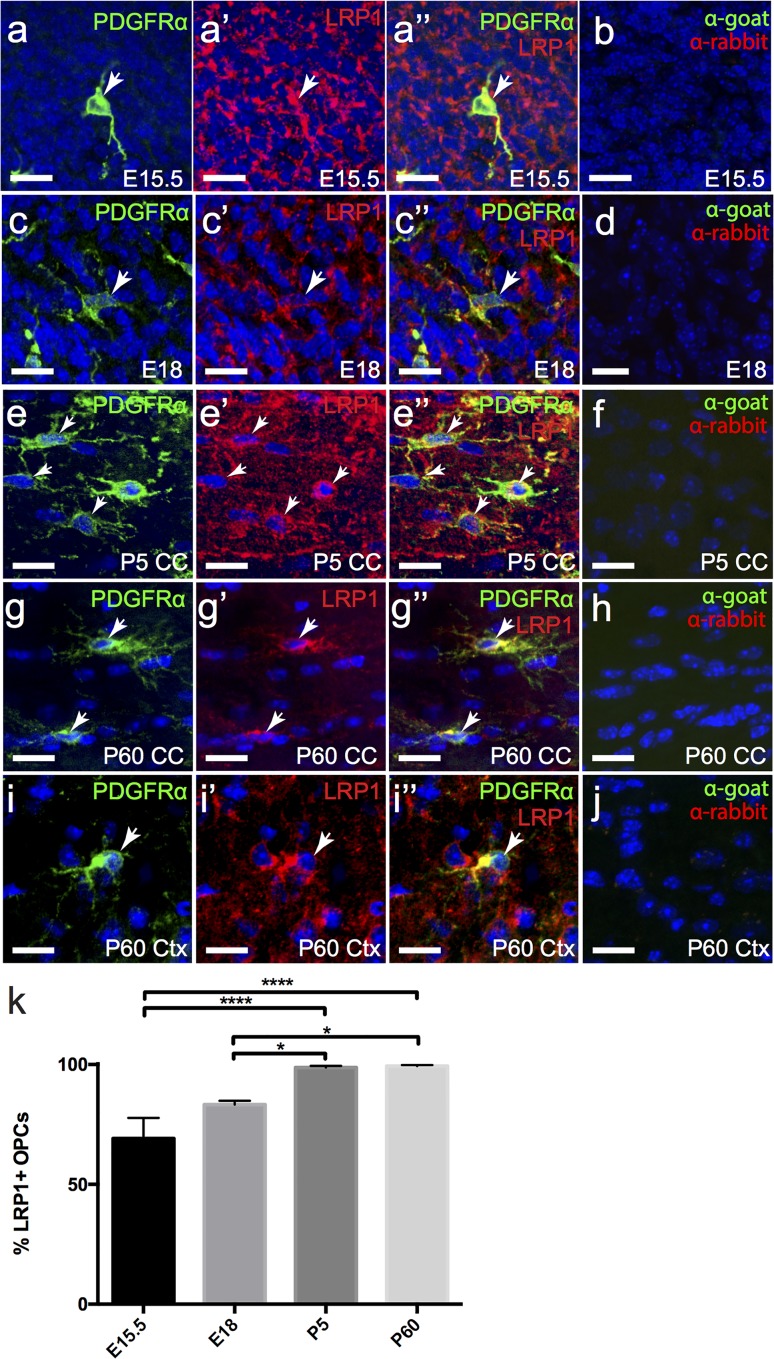
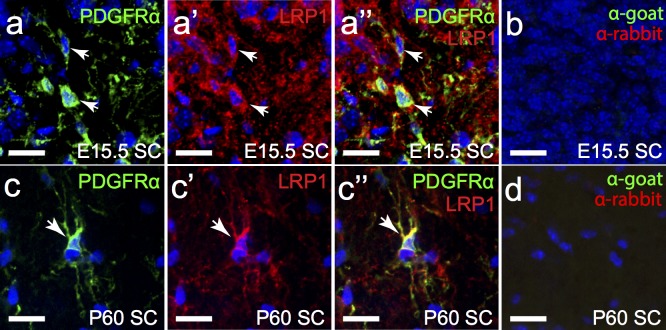
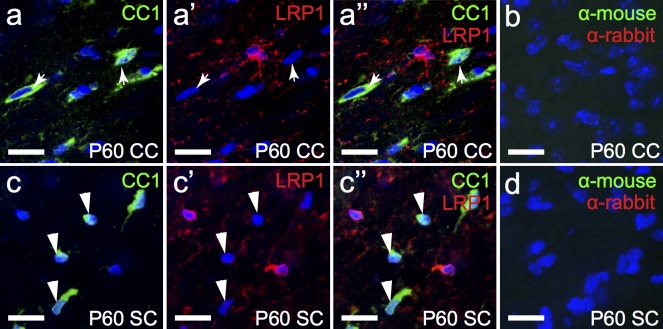
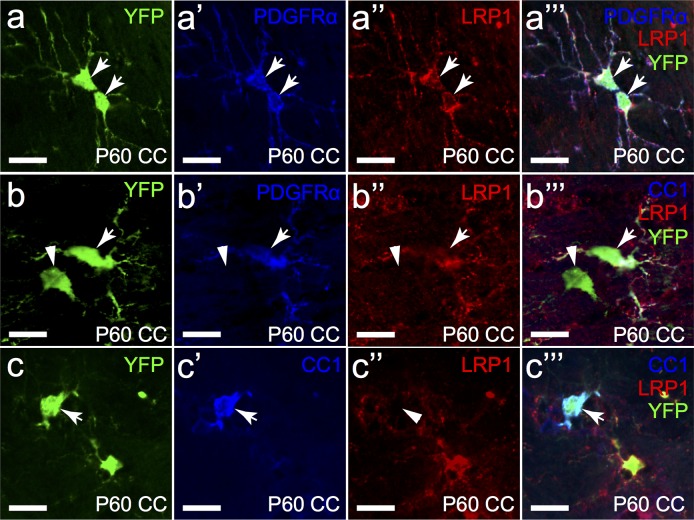
The low density lipoprotein-receptor related protein 1 (LRP1) is a large endocytic cell surface receptor that is known to interact with a variety of ligands, intracellular adaptor proteins and other cell surface receptors to regulate cellular behaviours ranging from proliferation to cell fate specification, migration, axon guidance, and lipid metabolism. A number of studies have demonstrated that LRP1 is expressed in the brain, yet it is unclear which central nervous system cell types express LRP1 during development and in adulthood. Herein we undertake a detailed study of LRP1 expression within the mouse brain and spinal cord, examining a number of developmental stages ranging from embryonic day 13.5 to postnatal day 60. We report that LRP1 expression in the brain peaks during postnatal development. On a cellular level, LRP1 is expressed by radial glia, neuroblasts, microglia, oligodendrocyte progenitor cells (OPCs), astrocytes and neurons, with the exception of parvalbumin+ interneurons in the cortex. Most cell populations exhibit stable expression of LRP1 throughout development; however, the proportion of OPCs that express LRP1 increases significantly from ~69% at E15.5 to ~99% in adulthood. We also report that LRP1 expression is rapidly lost as OPCs differentiate, and is absent from all oligodendrocytes, including newborn oligodendrocytes. While LRP1 function has been primarily examined in mature neurons, these expression data suggest it plays a more critical role in glial cell regulation-where expression levels are much higher.


Conflict of interest statement

Competing Interests: The authors have declared that no competing interests exist.

Figures

Fig 1
Fig 1. LRP1 is highly expressed in the brain.
Whole brain lysates from E13.5, P5 and P62 wildtype mice were analyzed by western blot to detect LRP1 (Fig 1A) and GAPDH (Fig 1A) protein expression. (c) Band pixel intensity was quantified, normalized to the loading control (GAPDH), and shows that LRP1 expression is significantly elevated in the postnatal brain compared to the embryonic (P = 0.001) and adult (P = 0.0004) brain. Results were compared using a one-way ANOVA with a Tukey’s post-hoc test, expressed as mean ± std. **P<0.01, ***P<0.001.
Fig 2
Fig 2. LRP1 is expressed by radial glia in the developing brain and spinal cord.
Coronal sections of the E13.5 (a), E15.5 (c) and E18 (g)mouse brain and transverse sections of the E15.5 spinal cord (e) were immunolabelled to detect radial glia (RC2, green) and LRP1 (red). The nuclear marker Hoechst 33342 was used to label cell nuclei (blue). (b,d,f,h,j) secondary antibody alone controls. All images are single z plane confocal scans. White arrows indicate regions of co-localisation. Scale bars represent 17μm. SC = spinal cord.
Fig 3
Fig 3. LRP1 is highly expressed by fibrous astrocytes.
Coronal brain sections from P5 (c) and P60 (a,e,i) mice and transverse spinal cord sections from P60 mice (g) were immunolabelled to detect astrocytes (GFAP, green) and LRP1 (red). The nuclear marker Hoechst 33342 was used to label cell nuclei (blue). (b,d,f,h,j) secondary antibody alone controls. All images are single z plane confocal scans. White arrows indicate regions of co-localisation. Scale bars represent 17μm. CC = corpus callosum, SC = spinal cord, Ctx = cortex, SVZ = subventricular zone and LV = lateral ventricle.
Fig 4
Fig 4. Neuroblasts in the embryonic brain and spinal cord express LRP1.
Coronal sections through the embryonic mouse brain (E13.5, a; E15.5, c; and E18, g) and transverse sections of embryonic mouse spinal cord (E15.5, e) were immunolabelled to detect neuroblasts (PSANCAM, green) and LRP1 (red). The nuclear marker Hoechst 33342 was used to label cell nuclei (blue). (b,d,f,h,j) secondary antibody alone controls. All images are single z plane confocal scans. White arrows indicate regions of co-localisation. Scale bars represent 17μm. SC = spinal cord.
Fig 5
Fig 5. NeuN-positive neurons express LRP1, but parvalbumin-positive interneurons do not.
Coronal sections through the P5 (a) and P60 (c) mouse brain, and transverse sections through the adult mouse spinal cord (e) were immunolabelled to detect mature neurons (NeuN, green) and LRP1 (red). g) Coronal section of an adult (P60) mouse brain immunolabelled to detect parvalbumin (green) and LRP1 (red). (b,d,f,h) secondary alone controls. The nuclear marker Hoechst 33342 was used to label cell nuclei (blue). All images are single z plane confocal scans. White arrows indicate regions of co-localisation. Arrow heads represent parvalbumin+ neurons that do not express LRP1. Scale bars represent 17μm. Ctx = cortex, SC = spinal cord.
Fig 6
Fig 6. Microglia in the brain stably express LRP1 throughout life.
Coronal sections of E13.5 (a), E15.5 (c), E18 (e), P5 (g, i) and P60 (k,m) mouse brain were immunolabelled to detect microglia (Iba1, green) and LRP1 (red). The nuclear marker Hoechst 33342 was used to label cell nuclei (blue). (o) Graphical depiction of the proportion of Iba1+ cells that expressed LRP1. Results were compared using a one-way ANOVA with a Bonferroni’s post-hoc test, expressed as means ± std and are representative of three independent experiments. (b, d, f, h, j, l, n) secondary antibody alone controls. All images are single z plane confocal scans. White arrows indicate regions of co-localisation. Scale bars represent 17μm. Ctx = cortex, CC = corpus callosum.
Fig 7
Fig 7. Microglia in the spinal cord express high levels of LRP1.
Transverse sections of E15.5 (a) and P60 (c) spinal cord were immuno-labelled to detect microglia (Iba1, green) and LRP1 (red). The nuclear marker Hoechst 33342 was used to label cell nuclei (blue). (b,d) secondary antibody alone controls. All images are single z plane confocal scans. White arrows indicate regions of co-localisation. Scale bars represent 17μm. SC = spinal cord.
Fig 8
Fig 8. LRP1 is developmentally unregulated by OPCs.
Coronal sections of E15.5 (a), E18 (c), P5 (e,i) and P60 (k,m) mouse brain were immunolabelled to detect OPCs (PDGFRα, green) and LRP1 (red). The nuclear marker Hoechst 33342 was used to label cell nuclei (blue). (b,d,f,h,j) secondary antibody alone controls. (k) Graphical representation of the percentage of OPCs that express LRP1 in the brain at each age. Data (n = 3 mice analyzed per age) were compared using a one-way ANOVA with a Bonferroni’s post-hoc test, and expressed as mean ± std. * P<0.05, **** P<0.0001. All images are single z plane confocal scans. White arrows indicate regions of co-localisation. Scale bars represent 17μm. CC = corpus callosum, Ctx = cortex.
Fig 9
Fig 9. OPCs in the spinal cord express LRP1 in their cell bodies and processes.
Transverse sections of E15.5 (a) and P60 (c) mouse spinal cord were immuno-labelled to detect OPCs (PDGFRα, green) and LRP1 (red). The nuclear marker Hoechst 33342 was used to label cell nuclei (blue). (b,d) secondary antibody alone controls. All images are single z plane confocal scans. White arrows indicate regions of co-localisation. Scale bars represent 17μm. SC = spinal cord.
Fig 10
Fig 10. Oligodendrocytes do not express LRP1.
Coronal sections through the P60 mouse brain (a) and transverse sections through P60 mouse spinal cord (c) were immuno-labelled to detect oligodendrocytes (CC1, green) and LRP1 (red). The nuclear marker Hoechst 33342 was used to label cell nuclei (blue). (b,d) secondary antibody alone controls. All images are single z plane confocal scans. Arrowheads indicate oligodendrocyte cell bodies, which do not express LRP1. Scale bars represent 17μm. CC = corpus callosum, SC = spinal cord.
Fig 11
Fig 11. Newly formed oligodendrocytes do not express LRP1.
Tamoxifen was administered to Pdgfra-CreERT2::Rosa26-YFP transgenic mice at P57 to label OPCs and trace them as they generate new oligodendrocytes until P64. Single scan confocal images were collected through the corpus callosum (CC) following immunolabelling with YFP (green), LRP1 (red) and either PDGFRα or CC1 (blue). a-a”‘ YFP+, PDGFRα+ cells were also LRP1+. b-b”‘ YFP+, PDGFRα-negative cells were also negative for LRP1. c-c”‘ YFP+ CC1+ cells were found to be LRP1-negative. White arrows indicate regions of co-localisation. Arrowheads indicate oligodendrocyte cell bodies, which do not express LRP1. Scale bars represent 17μm. CC = corpus callosum.

Similar articles

Cited by

References

    1. Auderset L, Landowski LM, Foa L, Young KM. Low Density Lipoprotein Receptor Related Proteins as Regulators of Neural Stem and Progenitor Cell Function. Stem Cells International. Hindawi Publishing Corporation; 2016: 2108495–16. 10.1155/2016/2108495 - DOI - PMC - PubMed
    1. Li Y, Marzolo MP, van Kerkhof P, Strous GJ, Bu G. The YXXL motif, but not the two NPXY motifs, serves as the dominant endocytosis signal for low density lipoprotein receptor-related protein. Journal of Biological Chemistry. American Society for Biochemistry and Molecular Biology; 2000;275: 17187–17194. 10.1074/jbc.M000490200 - DOI - PubMed
    1. Pi X, Schmitt CE, Xie L, Portbury AL, Wu Y, Lockyer P, et al. LRP1-Dependent Endocytic Mechanism Governs the Signaling Output of the Bmp System in Endothelial Cells and in Angiogenesis. Circ Res. Lippincott Williams & Wilkins; 2012;111: 564–74. 10.1161/CIRCRESAHA.112.274597 - DOI - PMC - PubMed
    1. Gopal U, Bohonowych JE, Lema-Tome C, Liu A, Garrett-Mayer E, Wang B, et al. A Novel Extracellular Hsp90 Mediated Co-Receptor Function for LRP1 Regulates EphA2 Dependent Glioblastoma Cell Invasion. Lesniak M, editor. PLoS ONE. Public Library of Science; 2011; e17649. 10.1371/journal.pone.0017649 - DOI - PMC - PubMed
    1. Shi Y, Mantuano E, Inoue G, Campana WM, Gonias SL. Ligand binding to LRP1 transactivates Trk receptors by a Src family kinase-dependent pathway. Sci Signal. 2009; 2: ra18 10.1126/scisignal.2000188 - DOI - PMC - PubMed

Substances