Explaining the disease phenotype of intergenic SNP through predicted long range regulation
- PMID: 27280978
- PMCID: PMC5062962
- DOI: 10.1093/nar/gkw519
Explaining the disease phenotype of intergenic SNP through predicted long range regulation
Abstract
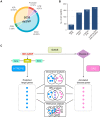
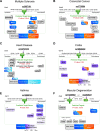
Thousands of disease-associated SNPs (daSNPs) are located in intergenic regions (IGR), making it difficult to understand their association with disease phenotypes. Recent analysis found that non-coding daSNPs were frequently located in or approximate to regulatory elements, inspiring us to try to explain the disease phenotypes of IGR daSNPs through nearby regulatory sequences. Hence, after locating the nearest distal regulatory element (DRE) to a given IGR daSNP, we applied a computational method named INTREPID to predict the target genes regulated by the DRE, and then investigated their functional relevance to the IGR daSNP's disease phenotypes. 36.8% of all IGR daSNP-disease phenotype associations investigated were possibly explainable through the predicted target genes, which were enriched with, were functionally relevant to, or consisted of the corresponding disease genes. This proportion could be further increased to 60.5% if the LD SNPs of daSNPs were also considered. Furthermore, the predicted SNP-target gene pairs were enriched with known eQTL/mQTL SNP-gene relationships. Overall, it's likely that IGR daSNPs may contribute to disease phenotypes by interfering with the regulatory function of their nearby DREs and causing abnormal expression of disease genes.
© The Author(s) 2016. Published by Oxford University Press on behalf of Nucleic Acids Research.
Figures


Similar articles
-
On the identification of potential regulatory variants within genome wide association candidate SNP sets.BMC Med Genomics. 2014 Jun 11;7:34. doi: 10.1186/1755-8794-7-34. BMC Med Genomics. 2014. PMID: 24920305 Free PMC article.
-
TAGOOS: genome-wide supervised learning of non-coding loci associated to complex phenotypes.Nucleic Acids Res. 2019 Aug 22;47(14):e79. doi: 10.1093/nar/gkz320. Nucleic Acids Res. 2019. PMID: 31045203 Free PMC article.
-
Combining Hi-C data with phylogenetic correlation to predict the target genes of distal regulatory elements in human genome.Nucleic Acids Res. 2013 Dec;41(22):10391-402. doi: 10.1093/nar/gkt785. Epub 2013 Sep 3. Nucleic Acids Res. 2013. PMID: 24003029 Free PMC article.
-
Laying a solid foundation for Manhattan--'setting the functional basis for the post-GWAS era'.Trends Genet. 2014 Apr;30(4):140-9. doi: 10.1016/j.tig.2014.02.006. Epub 2014 Mar 22. Trends Genet. 2014. PMID: 24661571 Free PMC article. Review.
-
Non-coding genome functions in diabetes.J Mol Endocrinol. 2016 Jan;56(1):R1-R20. doi: 10.1530/JME-15-0197. Epub 2015 Oct 5. J Mol Endocrinol. 2016. PMID: 26438568 Review.
Cited by
-
A Multi-Dimensional Approach to Map Disease Relationships Challenges Classical Disease Views.Adv Sci (Weinh). 2024 Aug;11(30):e2401754. doi: 10.1002/advs.202401754. Epub 2024 Jun 5. Adv Sci (Weinh). 2024. PMID: 38840452 Free PMC article.
-
Cancer-specific expression quantitative loci are affected by expression dysregulation.Brief Bioinform. 2020 Jan 17;21(1):338-347. doi: 10.1093/bib/bby108. Brief Bioinform. 2020. PMID: 30475999 Free PMC article.
-
The rs13388259 Intergenic Polymorphism in the Genomic Context of the BCYRN1 Gene Is Associated with Parkinson's Disease in the Hungarian Population.Parkinsons Dis. 2018 Apr 3;2018:9351598. doi: 10.1155/2018/9351598. eCollection 2018. Parkinsons Dis. 2018. PMID: 29850016 Free PMC article.
-
Intergenic SNPs in Obstructive Sleep Apnea Syndrome: Revealing Metabolic, Oxidative Stress and Immune-Related Pathways.Diagnostics (Basel). 2021 Sep 24;11(10):1753. doi: 10.3390/diagnostics11101753. Diagnostics (Basel). 2021. PMID: 34679450 Free PMC article.
-
Characterisation of the role played by ELMO1, GPR141 and the intergenic polymorphism rs918980 in Fuchs' dystrophy in the Indian population.FEBS Open Bio. 2025 May;15(5):822-835. doi: 10.1002/2211-5463.70006. Epub 2025 Feb 19. FEBS Open Bio. 2025. PMID: 39967558 Free PMC article.
References
MeSH terms
Substances
LinkOut - more resources
Full Text Sources
Other Literature Sources
Research Materials

