Observational Study
. 2016 Jun;95(23):e3858.
doi: 10.1097/MD.0000000000003858.

Noninvasive fat quantification of the liver and pancreas may provide potential biomarkers of impaired glucose tolerance and type 2 diabetes

Affiliations
Observational Study

Noninvasive fat quantification of the liver and pancreas may provide potential biomarkers of impaired glucose tolerance and type 2 diabetes

Zhi Dong et al. Medicine (Baltimore). 2016 Jun.

Erratum in

  • Erratum: Medicine, Volume 95, Issue 23: Erratum.
    [No authors listed] [No authors listed] Medicine (Baltimore). 2016 Jul 18;95(28):e0916. doi: 10.1097/01.md.0000489580.04709.16. eCollection 2016 Jul. Medicine (Baltimore). 2016. PMID: 31265603 Free PMC article.

Abstract

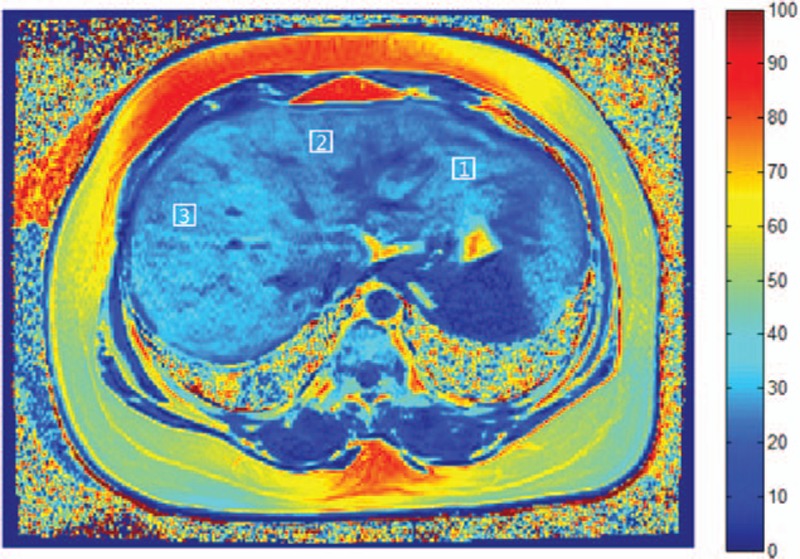
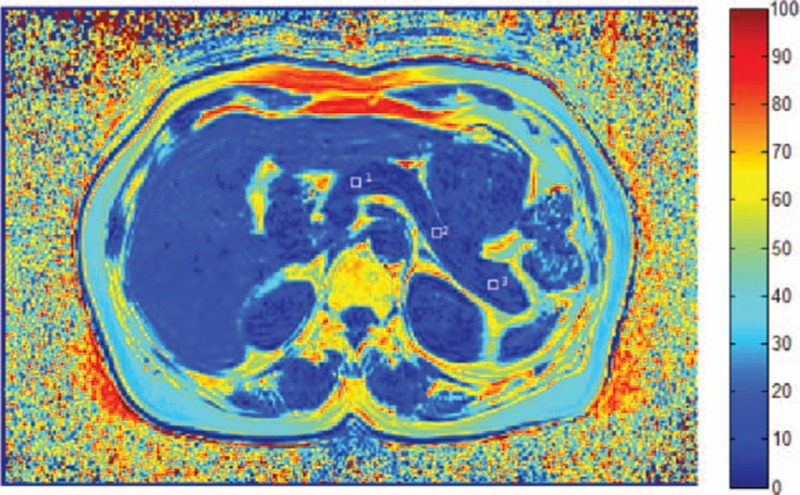
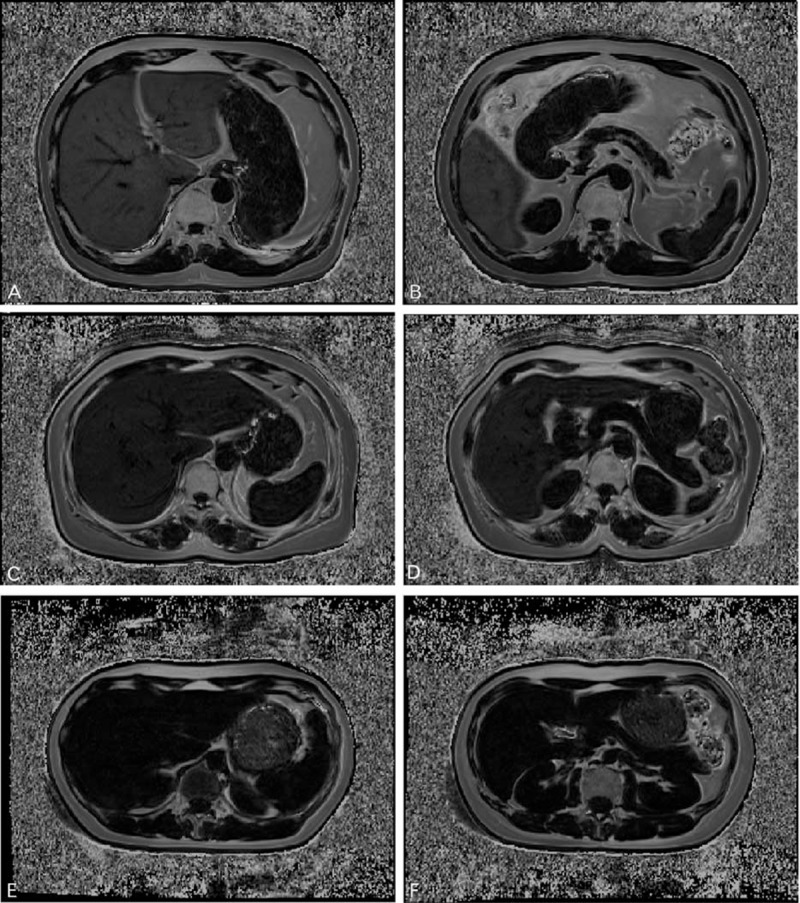
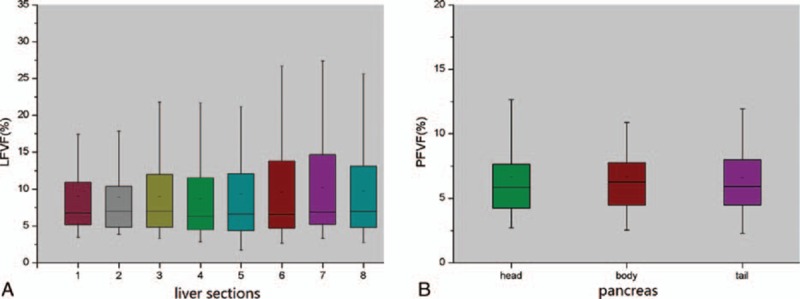
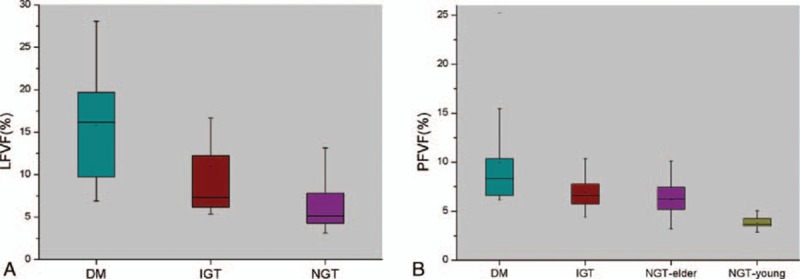
The aim of the study is to investigate if the fat content of the liver and pancreas may indicate impaired glucose tolerance (IGT) or type 2 diabetes mellitus (T2DM). A total of 83 subjects (34 men; aged 46.5 ± 13.5 years) were characterized as T2DM, IGT, or normal glucose tolerant (NGT). NGT individuals were stratified as <40 or ≥40 years. Standard laboratory tests were conducted for insulin resistance and β-cell dysfunction. The magnetic resonance imaging Dixon technique was used to determine fat distribution in the liver and pancreas. Correlations among liver and pancreatic fat volume fractions (LFVFs and PFVFs, respectively) and laboratory parameters were analyzed. Among the groups, fat distribution was consistent throughout sections of the liver and pancreas, and LFVFs closely correlated with PFVFs. LFVFs correlated more closely than PFVFs with insulin resistance and β-cell function. Both the LFVFs and PFVFs were the highest in the T2DM patients, less in the IGT, and least in the NGT; all differences were significant. The PFVFs of the NGT subjects ≥40 years were significantly higher than that of those <40 years. The fat content of the liver and pancreas, particularly the liver, may be a biomarker for IGT and T2DM.


Conflict of interest statement

The authors have no conflicts of interest to disclose.

Figures

Figure 1
Figure 1
FVF map of the liver of a 54-year-old woman from the T2DM group. Square-shaped ROIs (10 × 10 mm2) were manually drawn on each of 8 hepatic segments, avoiding vascular and biliary structures. ROI-1: segment II; ROI-2: segment IV; ROI-3: segment VIII. Key scale on the right represents fat percentage. FVF, fat volume fraction; ROI, region of interest; T2DM, type 2 diabetes mellitus.
Figure 2
Figure 2
FVF map of the pancreas of a 43-year-old woman from the IGT group. Square-shaped ROIs (5 × 5 mm2) were manually drawn on the pancreas head (ROI-1), body (ROI-2), and tail (ROI-3). Key scale on the right represents fat percentage. FVF, fat volume fraction; IGT, impaired glucose tolerance; ROI, region of interest.
Figure 3
Figure 3
Represent FVF maps of the liver (left) and pancreas (right) of women in the (A, B) T2DM, (C, D) IGT, and (E, F) NGT groups. (A, B) A 62-year-old woman who was first diagnosed as T2DM, with a mean LFVF of 25.8% and a mean PFVF of 15.4%. (C, D) A 43-year-old woman diagnosed as IGT, with a mean LFVF of 14.3% and PFVF of 6.6%. (E, F) A 25-year-old healthy NGT woman with a mean LFVF of 3.8% and PFVF of 5.0%. Fat content (correlated with signal intensity) is highest in the T2DM subject, less in the IGT subject, and least in the NGT woman. FVF, fat volume fraction; LFVF, FVF of liver; NGT, normal glucose tolerant; T2DM, type 2 diabetes mellitus.
Figure 4
Figure 4
Boxplots of LFVF and PFVF in liver and pancreas. (A) LFVF values in different liver segments. There was no statistical differences among the FVFs of 8 liver segments (P = 0.77). (B) PFVF values in the pancreas head, body, and tail. No significant difference was found among them (P = 0.84). FVF, fat volume fraction; LFVF, FVF of liver; PFVF, FVF of pancreas.
Figure 5
Figure 5
Boxplots of LFVF and PFVF in liver and pancreas of the patient groups. (A) LFVF values for the T2DM, IGT, and NGT groups. LFVFs in the T2DM group were significantly higher than that of the IGT (P = 0.011) and NGT (P < 0.001) groups, and LFVFs in the IGT group were significantly higher than that of the NGT group (P < 0.001). (B) PFVF values of the T2DM, IGT, NGT-elder, and NGT-young groups. PFVFs in the NGT-elder group were higher than that of the NGT-young group (P < 0.001), whereas no significant difference were found between the NGT-elder group and IGT groups (P = 0.20). PFVFs in the T2DM group were higher than that of the IGT (P = 0.007) and NGT-elder (P < 0.001) groups. FVF, fat volume fraction; IGT, impaired glucose tolerance; LFVF, FVF of liver; PFVF, FVF of pancreas; NGT, normal glucose tolerant; T2DM, type 2 diabetes mellitus.

References

    1. Chng MH, Alonso MN, Barnes SE, et al. Adaptive immunity and antigen-specific activation in obesity-associated insulin resistance. Mediators Inflamm 2015; 2015:593075. - PMC - PubMed
    1. Thomas EL, Fitzpatrick JA, Malik SJ, et al. Whole body fat: content and distribution. Prog Nucl Mag Res SP 2013; 73:56–80. - PubMed
    1. Hu HH, Nayak KS, Goran MI. Assessment of abdominal adipose tissue and organ fat content by magnetic resonance imaging. Obes Rev 2011; 12:e504–e515. - PMC - PubMed
    1. Lee JS. Clinical implications of fatty pancreas: correlations between fatty pancreas and metabolic syndrome. World J Gastroenterol 2009; 15:1869. - PMC - PubMed
    1. Sijens PE. MRI-determined fat content of human liver, pancreas and kidney. World J Gastroenterol 2010; 16:1993. - PMC - PubMed

Publication types

MeSH terms