. 2016 Jun 23;534(7608):494-9.
doi: 10.1038/nature17976. Epub 2016 Jun 6.

Selective spider toxins reveal a role for the Nav1.1 channel in mechanical pain

Affiliations

Selective spider toxins reveal a role for the Nav1.1 channel in mechanical pain

Jeremiah D Osteen et al. Nature. .

Abstract

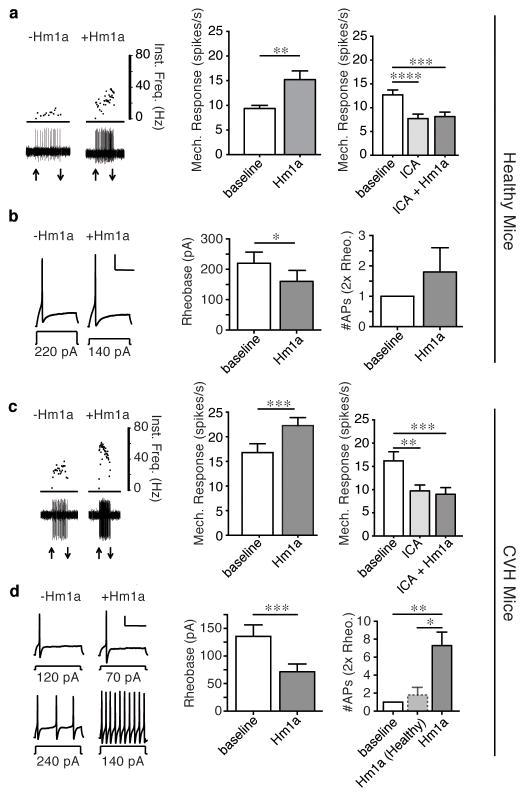
Voltage-gated sodium (Nav) channels initiate action potentials in most neurons, including primary afferent nerve fibres of the pain pathway. Local anaesthetics block pain through non-specific actions at all Nav channels, but the discovery of selective modulators would facilitate the analysis of individual subtypes of these channels and their contributions to chemical, mechanical, or thermal pain. Here we identify and characterize spider (Heteroscodra maculata) toxins that selectively activate the Nav1.1 subtype, the role of which in nociception and pain has not been elucidated. We use these probes to show that Nav1.1-expressing fibres are modality-specific nociceptors: their activation elicits robust pain behaviours without neurogenic inflammation and produces profound hypersensitivity to mechanical, but not thermal, stimuli. In the gut, high-threshold mechanosensitive fibres also express Nav1.1 and show enhanced toxin sensitivity in a mouse model of irritable bowel syndrome. Together, these findings establish an unexpected role for Nav1.1 channels in regulating the excitability of sensory nerve fibres that mediate mechanical pain.


Conflict of interest statement

The authors declare competing financial interests: details are available in the online version of the paper.

Figures

Extended Data Figure 1
Extended Data Figure 1. Hm1a and 1b selectively target Nav1.1 in sensory neurons
a, (Left) HPLC chromatogram showing reversed-phase C18 fractionation of Heteroscodra maculata venom; peaks containing Hm1a and Hm1b are labeled. Peptide sequences as determined by Edman degradation are displayed above. (Middle) MALDI-TOF spectra of native undigested Hm1b (top) and native Hm1b digested with carboxypeptidase Y for 20 min (bottom), with inserted spectra showing the monoisotopic mass of each in Dalton (Da). The observed mass difference of 146 Da between the intact and digested Hm1b corresponds to the final residue, Phe, with an amidated C-terminus. (Right) Chromatograms show reversed-phase C18 HPLC profiles of native and synthetic Hm1a, which were indistinguishable when co-injected. b, Representative currents from oocytes expressing hNav subtypes before (black) and after (grey) bath application of ICA-121431 (500 nM). Currents were elicited during 1 Hz stimulation to induce use-dependent block. c, (Top) Amino acid sequence comparison of Hm1a with SGTx1, a related, but non-selective fast-inactivation inhibitor. (Bottom) Representative calcium imaging experiment comparing ICA-121431-mediated block of Hm1a- or SGTx1-evoked responses in cultured embryonic DRG neurons, with group data at right (**p < 0.01, ***p < 0.001, n = 4). d, (Top) Fraction of P0 mouse neurons responding to Hm1a versus SGTx1 (**p < 0.01). (Bottom) Ratiometric calcium responses elicited by SGTx1 (500 nM) in the presence and absence of ICA-121431 (500 nM). e, Dose-response curves for Hm1a inhibition of fast inactivation in oocytes expressing Nav1.1, Nav1.2 or Nav1.3. Sustained current at the end of a 100 ms pulse is normalized to peak current to quantify magnitude of the effect. EC50 for hNav1.1 = 38 nM, hNav1.2 = 236 nM and hNav1.3 = 220 nM. f, Representative traces from oocytes expressing hNav subtypes in response to a saturating dose (on hNav1.1) of purified Hm1b during a 100 ms depolarization. g, rKv2.1 chimeras containing different Nav1.9 S3b-S4 motifs were tested for sensitivity to hHm1a (100 nM). Representative traces (top) and summary data (bottom) show a lack of toxin sensitivity for each chimera. h, (Top left) Representative currents from oocytes expressing mKv4.1 before (black) and after (red) bath application of Hm1a (5 μM). (Middle) Quantification of mKv4.1 blockade by synthetic or native Hm1a. (Top right) Comparison of sustained current during application of native or synthetic Hm1a (1 μM) shows similar effects on Nav1.1 inactivation. (Bottom) Representative traces (left) showing that outward currents in P0 TG mouse neurons are unaffected by Hm1a (500 nM). Scatter plot (right, n = 10) shows no significant difference). i, Percentage of Hm1a (500 nM)-responsive neurons in various culture conditions as assessed by calcium imaging (n = 3–4,*p < 0.05).
Extended Data Figure 2
Extended Data Figure 2. Hm1a selectivity depends on DIV S1-S2 and S3b-S4 regions
a, (Top) Alignments between Kv2.1 and hNav1.1 S3b-S4 regions from each domain (as indicated) with sequence of chimeras shown below each alignment. (Bottom) G-V relationships from chimeric channels expressed in oocytes in the absence (black) and presence (colors) of Hm1a (100 nM). b, Sequence alignment of hNav1.1 and rNav1.4 showing putative transmembrane segments (green) and regions swapped in chimeric channels (grey). c, (Top) Using the background of Nav1.4 chimera containing the S3b-S4 and S5-S6 regions of Nav1.1, individual residues were mutated in the S1-S2 loop to the cognate residue in Nav1.1. The D1376T and Y1379S point mutants in the chimeric rNav1.4 channel reveal an increase in peak current after 100 nM Hm1a application (red) relative to untreated controls (black). Filled circles denote G-V relationships, where oocytes were depolarized for 50 ms in 5mV steps from a holding potential of −90mV. Open circles denote steady-state inactivation (I/Imax) relationships, where oocytes were depolarized from −90mV to +5mV in 5mV increments for 50 ms preceeding a 50 ms step to −15mV. (Middle) Dot plot detailing percent increase in peak conductance of each point mutant in response to 100 nM Hm1a treatment. Each point represents a single oocyte; red bars indicate 95% confidence interval. Mutations highlighted in orange (D1376T and Y1379S) are statistically different from S3b-S4/S5-S6 control (*p < 0.01). The Q1372E mutant did not generate currents. (Bottom) Alignment of DIV S1-S4 regions from relevant mouse and human Nav isoforms. Orange highlights location of residues in the S1-S2 loop that putatively contribute to the toxin effect. d, (Left) Stylized DIV with transmembrane segments represented as circles and extracellular loops as bars (black for native rNav1.4 channel and green for portions transplanted from hNav1.1). (Middle) Traces displaying effect of Hm1a on each chimera depolarized to −15 mV from a holding potential of −90 mV. (Right) Conductance-voltage (G/Gmax) and steady-state inactivation (I/Imax) relationships of each channel and chimera before and after toxin (black and red, respectively) across a voltage range spanning −90 mV to 0 mV from a holding potential of −90 mV in 5 mV increments. Scale bars as in Fig. 2. e, Dot plots displaying the effect of 100 nM Hm1a on peak current (left) and persistent current (right). Data in the left plot were generated by dividing peak conductance after Hm1a application by the peak conductance before. Right plot shows persistent current divided by peak current before (black) or after (red) toxin addition. Persistent current was determined by averaging current from the final millisecond of depolarization to 0 mV from a holding potential of −90 mV. Vertical bars indicate 95% confidence interval.
Extended Data Figure 3
Extended Data Figure 3. Nav1.1 is expressed by myelinated, non-C fiber sensory neurons
a, Representative images showing expression of various molecular markers and their overlap with Nav1.1 transcripts. Markers include immunohistochemical staining for calcitonin gene related peptide (CGRP) and tyrosine hydroxylase (TH) and in situ histochemistry for TRPM8 and 5-HT3 ion channel transcripts, Quantification of overlap for these markers is shown in Fig. 3. b, Quantification of the number of toxin-responsive cells in P0 mouse TG cultures as assessed by calcium imaging (leftmost column) and the percentage of toxin-sensitive cells that responded to other agonists (mCPBG, AITC, capsaicin, and menthol activate 5-HT3, TRPA1, TRPV1 and TRPM8 channels, respectively), or bound the lectin IB4. c, Table including conduction velocity and Von Frey thresholds for skin-nerve experiments presented in Fig. 3d.
Extended Data Figure 4
Extended Data Figure 4. Control experiments related to Figure 4
a, Representative DRG sections from peripherin-Cre adult mouse showing neurons that express Cre recombinase as visualized using a floxed-stop YFP reporter mouse. In situ hybridization histochemistry shows overlap with Nav1.1 transcripts (right panel). b, Quantification of overlap between YFP and Nav1.1. c, Comparison of ATF3 induction in DRG following sciatic nerve ligation (SNI) or intraplantar Hm1a injection. SNI induced ATF3 expression in >50% of DRG neurons whereas ATF3 induction after Hm1a injection was indistinguishable from vehicle (measured 1 or 3 days post-injection). d, Peripherin-Cre x floxed Nav1.1 mice were compared with WT littermates in the rotarod test. No significant differences were observed.
Extended Data Figure 5
Extended Data Figure 5. A subset of colonic afferents does not express functional Nav1.1
a, (Left) Representative ex vivo colonic single fiber recording from an Hm1a (100 nM)-non-responsive high-threshold fiber from a healthy mouse (arrows indicate application and removal of 2g Von Frey hair stimulus). (Middle) Group data showing lack of Hm1a-mediated responses from a subset (9/15) of fibers. (Right) Group data showing a population (5/10) of healthy, high-threshold mechanoreceptor colonic afferents unaltered by ICA-121432 either in the presence or absence of Hm1a (100 nM). b, (Left) Representative whole–cell current clamp recording of a retrogradely traced colonic DRG neuron in response to 500 ms current injection at rheobase. Recordings were made from the same neuron of a healthy control mouse before and after incubation with Hm1a (10 nM). Horizontal scale bar = 250 ms; vertical scale bar = 20 mV. (Middle and Right) Group data show no effect from Hm1a application on electrical excitability in a sub-population (6/11) of colonic DRG neurons. c, (Left) Representative high-threshold mechanoreceptive colonic fibers from CVH mice showing no change after application of Hm1a (100 nM). (Middle) Group data from Hm1a-non-responsive colonic fibers (4/11). (Right) Group data showing a subpopulation of CVH colonic afferents (3/10) unaltered by ICA-121432 either in the presence or absence of Hm1a. d, (Left) Representative Hm1a-non-responsive colonic DRG neuron in whole-cell current clamp. (Middle and Left) Group data show electrical excitability is unaltered by Hm1a in a subset (4/11) of CVH colonic DRG neurons.
Figure 1
Figure 1. Hm1a selectively targets Nav1.1 in sensory neurons
a, Togo Starburst tarantula, H. maculata (image courtesy of B. Rast, ArachnoServer ). b, Average ratiometric calcium responses from Hm1a (500nM)-sensitive embryonic rat DRG neurons with or without TTX (500 nM). Note persistence of toxin responses in the absence of TTX (top images). c, Representative whole-cell patch clamp recording from Hm1a-sensitive P0 mouse TG neuron. All (15/15) Hm1a responsive neurons displayed similar effect of toxin on sodium current inactivation. Currents elicited during repeated steps to −30 mV (Vh = −90 mV, scale bar = 1nA, 5ms). d, (Left) Average Hm1a-evoked calcium response in the presence of ICA-121431 (500nM) and after washout (n = 11; responses to Hm1a alone are shown in grey). (Right) Quantification of maximum Hm1a-evoked responses with or without ICA-121431 (n = 25). e, Currents from oocytes expressing hNav channels in the absence (black) or presence (red, 100nM) of Hm1a elicited by repeated pulses (0.2–1Hz) to −30mV (Nav1.1–1.7) or 0 mV (Nav1.8) for 100ms (Vh = −90mV). Scale bar = 100nA, 25ms. f, (Top panels) Representative current clamp recording from mouse TG neuron in the absence (black) or presence (red) of Hm1a (500nM). (Bottom) Quantification of action potentials (APs) elicited by a 1s, 20pA current injection before or after exposure to Hm1a (500nM, n = 4) with representative APs shown at right. Average AP width increased in the presence of Hm1a by 28.3% ± 8.4% (p < 0.05, n = 4). *p < 0.05 and ***p < 0.001, Student’s t-test. Error bars represent mean ± SEM.
Figure 2
Figure 2. Hm1a targets S3b-S4 and S1-S2 loops in DIV to inhibit fast inactivation
a, Representative traces from oocytes expressing hNav1.1 without (black) or with (red) Hm1a (100nM). Single exponential fits to inactivation time course (broken lines) and tau values (right) show toxin-induced slowing (**p < 0.01 at each voltage, 2-way ANOVA with post-hoc Tukey’s). b, Kv2.1 (far left) and chimeras containing S3b-S4 motif from each hNav1.1 domain repeat (DI-DIV, as indicated) were tested for sensitivity to Hm1a (100nM). Currents are shown during 50ms depolarization to −30mV. Scale bar = 200nA; 10ms. c, rNav1.4, hNav1.1 and chimeric channels containing S1-S2, S3b-S4, and/or S5-S6 were tested for Hm1a sensitivity. See Extended Data Figure 2 for quantitation and details of chimera design.
Figure 3
Figure 3. Nav1.1 is expressed by myelinated, non-C fiber neurons in sensory ganglia
a, Representative DRG sections showing immunoreactivity for neurofilament 200 (NF200), binding of isolectin B4 (IB4), and in situ histochemistry for TRPV1, Nav1.7, or Nav1.1 transcripts, as indicated. Arrows and asterisks indicate cells with overlapping and non-overlapping signals, respectively. b, Size distribution for all DRG neurons (grey bars, 514 cells counted) or Nav1.1-expressing cells (black bars, 324 cells counted). c, Quantification of overlap between histological markers (≥164 cells counted for each condition; 9–12 independent sections from ≥3 mice). d, Representative traces from AM fibers recorded in skin-nerve preparation show increased firing following application of Hm1a (1μM) with quantification at right. Hm1a significantly increased firing during all forces tested, achieving statistical significance at 50 and 100mN (*** p < 0.001 with 2-way ANOVA, # p < 0.05 with Bonferonni post-hoc, n = 23, 23 and 18 fibers for vehicle and 13, 13 and 10 fibers for Hm1a at 15, 50 and 100 mN forces, respectively).
Figure 4
Figure 4. Hm1a elicits non-inflammatory pain and bilateral mechanical allodynia
a, Comparison of licking/biting behavior following intraplantar injection (10μl) of vehicle (PBS) (n = 6) versus Hm1a (5μM) (n = 10, **p < 0.01). Behavior was unaffected by ablation of TRPV1 fibers (V1abl, n = 5) but significantly reduced in peripherin-Cre x Floxed-Nav1.1 (CKO) mice (*p < 0.05, n = 11). b, (Top) Representative histological sections and quantification of c-Fos immunoreactivity in spinal cord dorsal horn following intraplantar vehicle or Hm1a (5 μM) injection (n = 27 sections from 3 mice, ***p < 0.001). c, Capsaicin- or Hm1a-injected paws (right) next to uninjected contralateral controls (left). (Top right) Relative thickness of injected versus uninjected paws. (Bottom right) Evans blue dye (EBD) extravasation following capsaicin or Hm1a injection (*p < 0.05). (d) Latency of paw withdrawal from noxious heat stimulus measured after intraplantar injection of vehicle or Hm1a (500nM). e, Mechanical response thresholds measured in paws ipsilateral (light grey) or contralateral (dark grey) to vehicle or toxin (500nM) injection (n = 5 for WT Veh, V1abl Hm1a and WT Hm1b; n = 7 for WT Hm1a; n = 9 for CKO Hm1a; **p < 0.01, ***p < 0.001, ****p < 0.0001). f, Mechanically-evoked currents were observed from all adult mouse DRG neurons exhibiting sensitivity to Hm1a but not capsaicin (bottom), and not from those sensitive to both (top) (stimulus range from 1–9 micron displacement). Kinetic properties of mechanically-evoked currents in Hm1a responders were variable. Error bars represent mean ± SEM. P values based on unpaired two-tailed Student’s t-test (panels b and c) or one-way ANOVA with post-hoc Tukey’s test (panels a, d and e).
Figure 5
Figure 5. Colonic afferents display increased sensitivity to Hm1a in a model of IBS
a, (Left) Representative ex vivo single fiber recording from an Hm1a (100nM)-responsive high-threshold mechanoreceptive fiber from a healthy control mouse (arrows indicate application and removal of 2g Von Frey hair stimulus). (Middle) Group data from Hm1a-sensitive fibers (6/15, defined as ≥15% increase over baseline; **p < 0.01; see Extended Data Fig. 5 for examples and group data from Hm1a-nonresponsive fibers. (Right) Group data from a population (5/10) of ICA-121432 (500nM)-sensitive afferents (****p < 0.0001). b, (Left) Representative whole–cell current clamp recording of a retrogradely traced colonic DRG neuron in response to 500ms current injection at rheobase (the minimum current injection required to elicit action potential firing). Recordings were from the same neuron of a healthy control mouse before and after incubation with Hm1a (10nM). Scale bars = 250 ms, 20 mV. (Middle) Group data show significant reduction in rheobase following Hm1a application in a sub-population (5/11) of neurons (*p < 0.05). Hm1a-responsive neuron defined as exhibiting ≥10% change in rheobase from baseline control. (Right) Hm1a increased the number of action potentials observed at 2x rheobase in these neurons, but not to a level that reached statistical significance. c, (Left) Responses from high-threshold colonic fibers from CVH mice before and after application of Hm1a (100nM). (Middle) Group data from Hm1a-responsive fibers (4/11, ***p < 0.001). (Right) Group data from ICA-121432-sensitive fibers (7/10, **p < 0.01). d, (Left) Representative Hm1a-responsive colonic DRG neuron in whole-cell current clamp. Addition of Hm1a reduced rheobase (top traces) and increased action potential firing at 2x rheobase (bottom traces). (Middle and right) Group data from Hm1a-responsive CVH neurons (7/11) showing toxin-mediated decrease in rheobase (middle, ***p < 0.001) or increase in action potential firing at 2x rheobase (right, *p < 0.05, **p < 0.01).

References

    1. Basbaum AI, Bautista DM, Scherrer G, Julius D. Cellular and molecular mechanisms of pain. Cell. 2009;139:267–284. - PMC - PubMed
    1. Dib-Hajj SD, Yang Y, Black JA, Waxman SG. The NaV1.7 sodium channel: from molecule to man. Nat Rev Neurosci. 2013;14:49–62. - PubMed
    1. Faber CG, et al. Gain-of-function NaV1.8 mutations in painful neuropathy. Proc Natl Acad Sci U S A. 2012;109:19444–19449. - PMC - PubMed
    1. Fertleman CR, et al. SCN9A mutations in paroxysmal extreme pain disorder: allelic variants underlie distinct channel defects and phenotypes. Neuron. 2006;52:767–774. - PubMed
    1. Hoeijmakers JG, Faber CG, Merkies IS, Waxman SG. Painful peripheral neuropathy and sodium channel mutations. Neurosci Lett. 2015;596:51–59. - PubMed

Publication types

MeSH terms

Substances