. 2016 Jun 16;534(7607):341-6.
doi: 10.1038/nature18288. Epub 2016 Jun 8.

Dual targeting of p53 and c-MYC selectively eliminates leukaemic stem cells

Affiliations

Dual targeting of p53 and c-MYC selectively eliminates leukaemic stem cells

Sheela A Abraham et al. Nature. .

Abstract

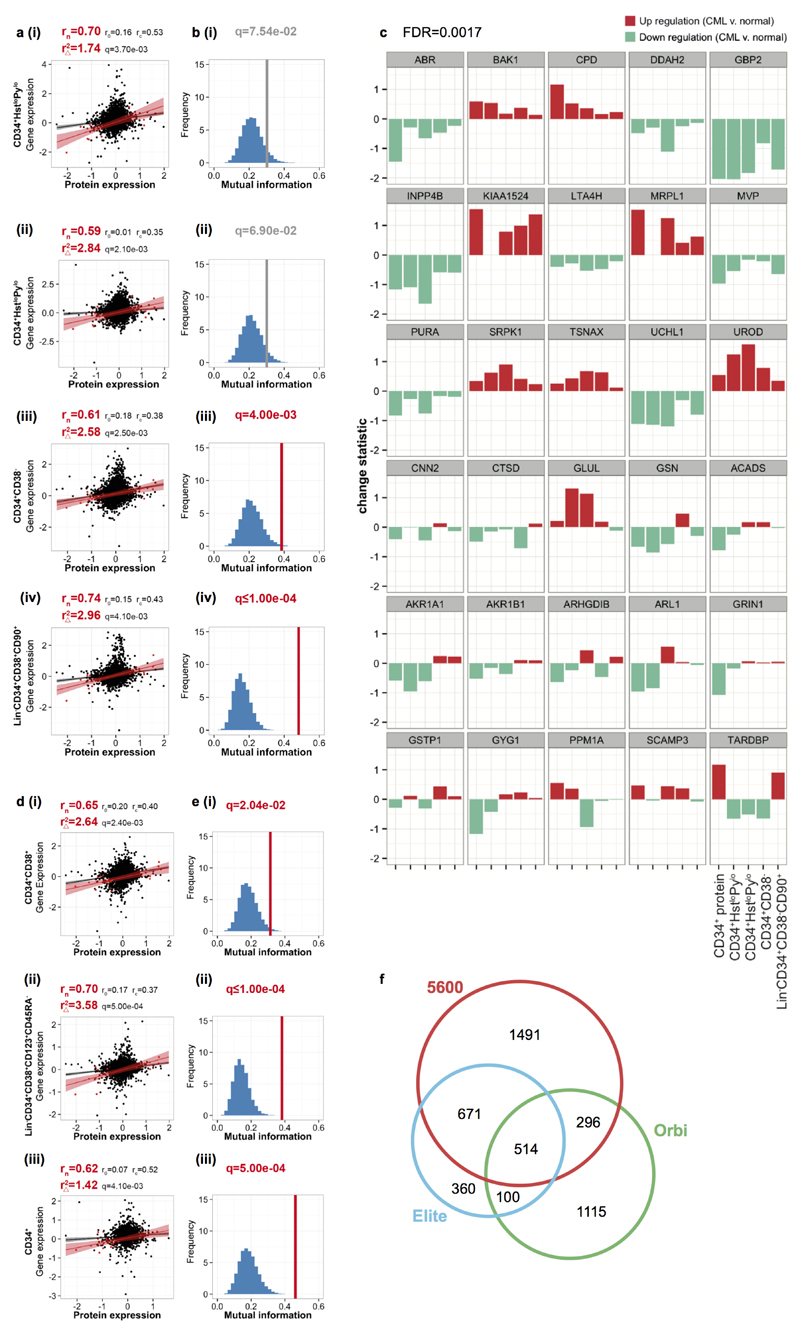
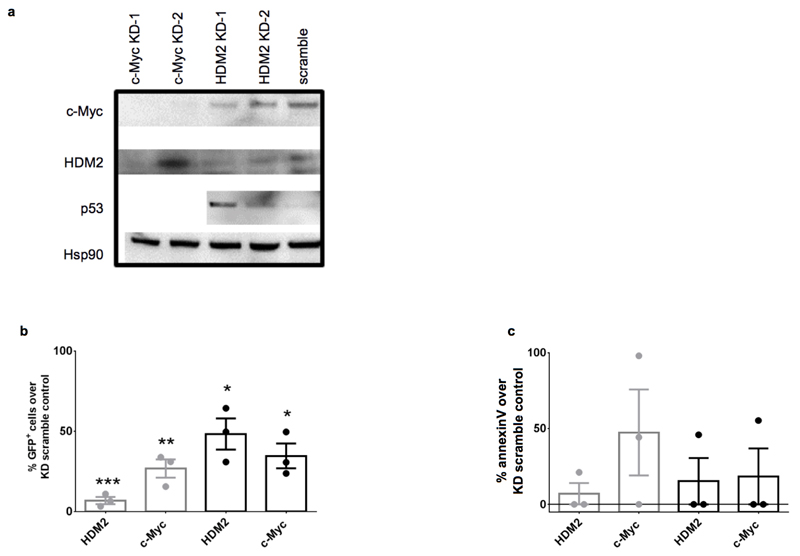
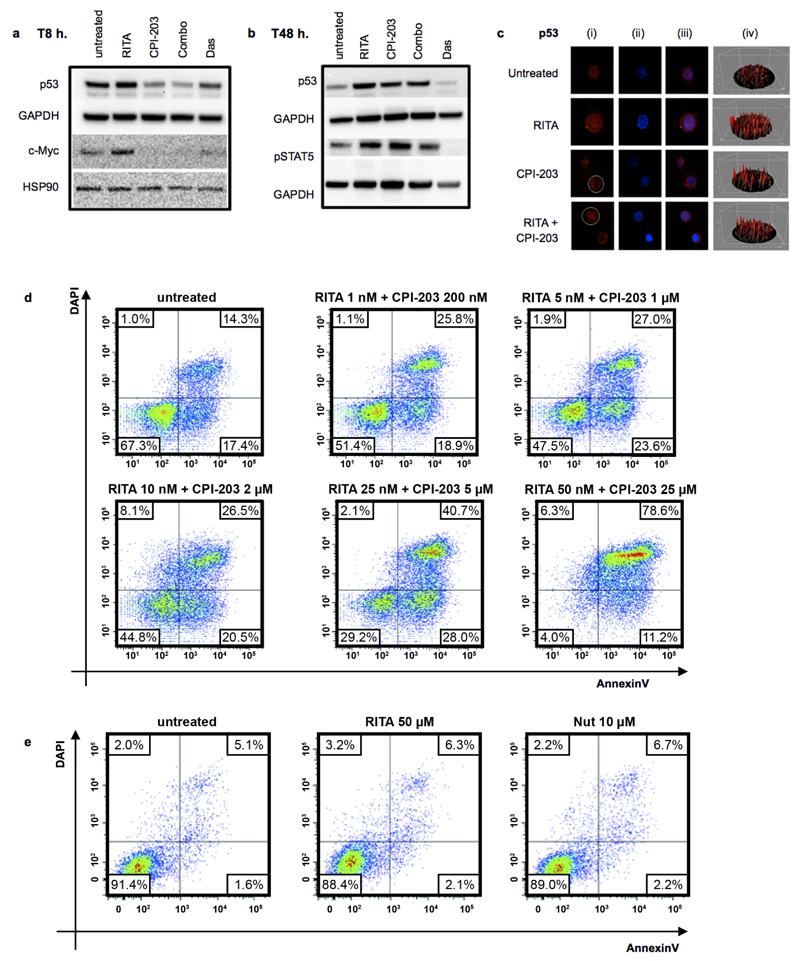
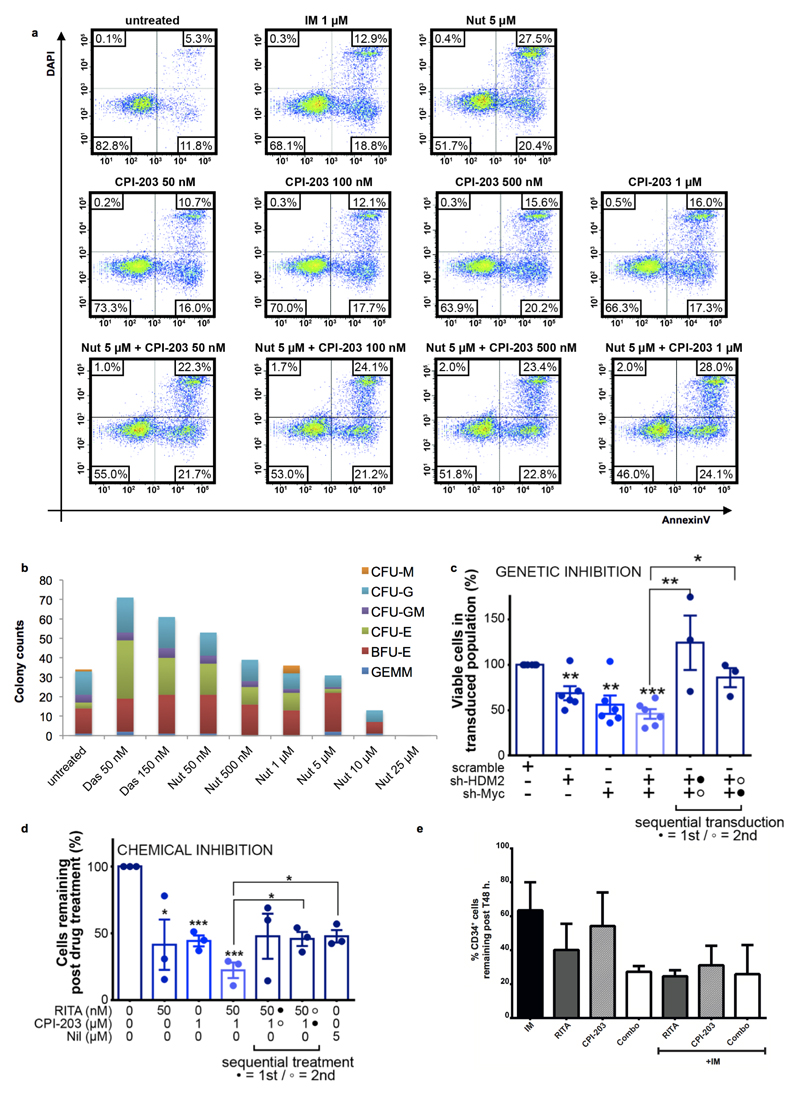
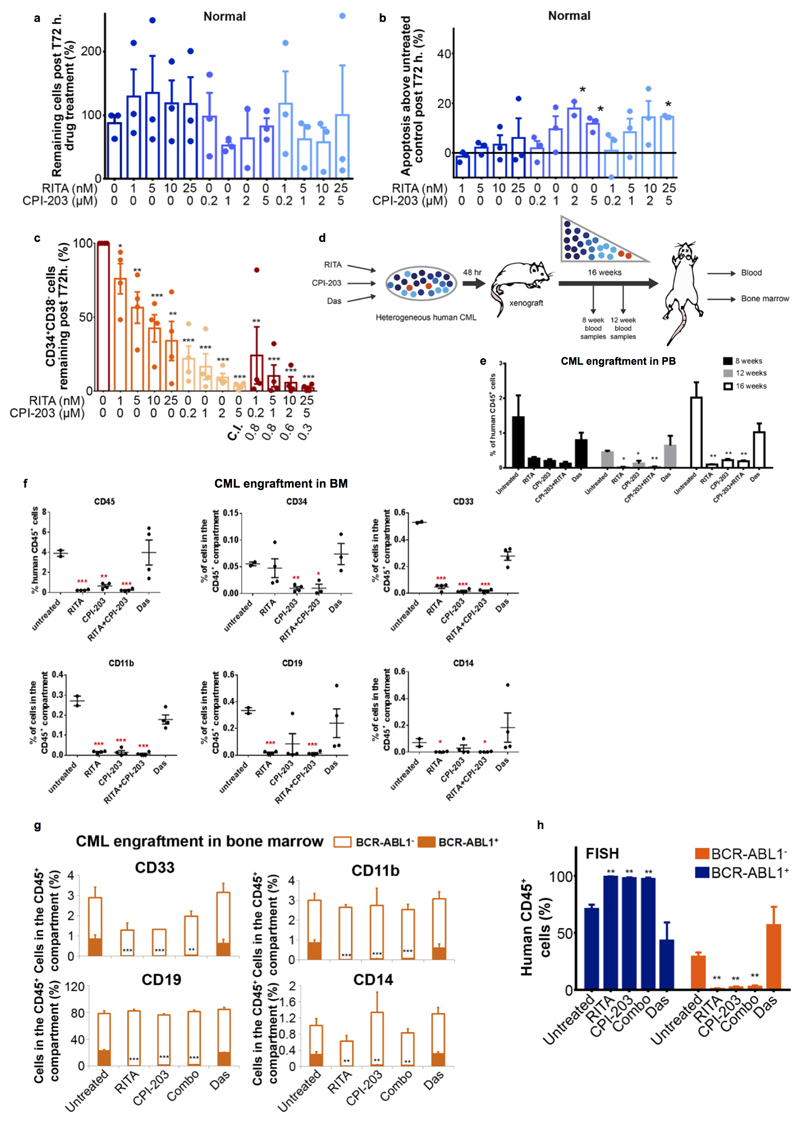
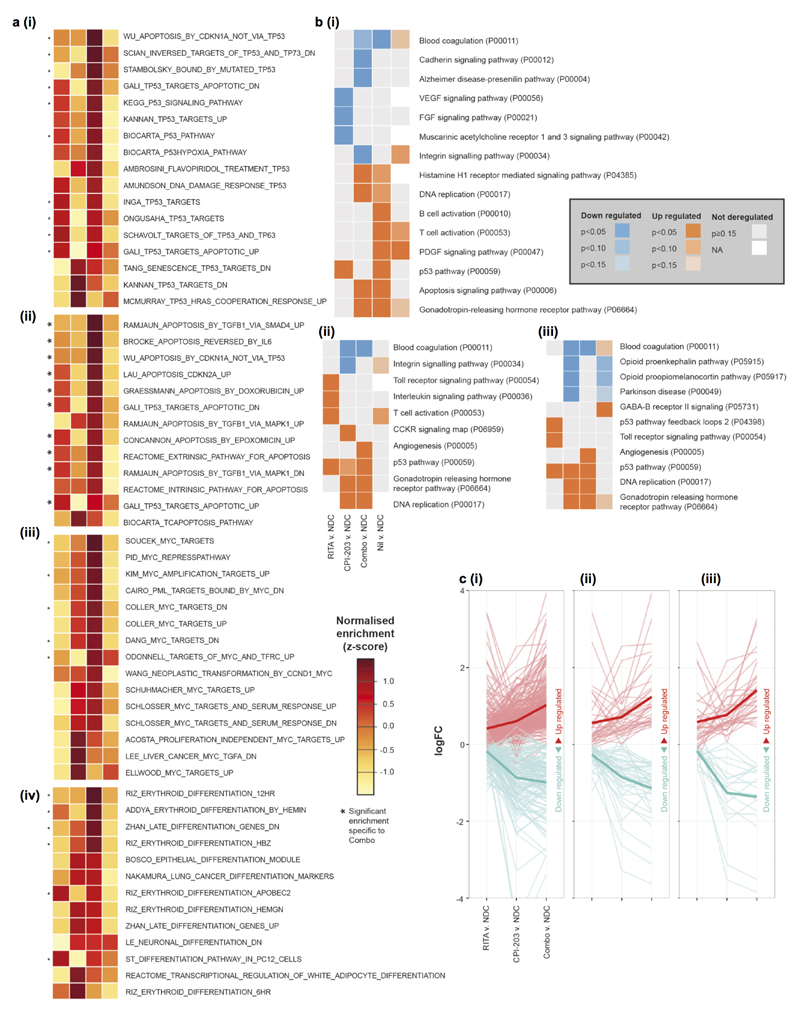
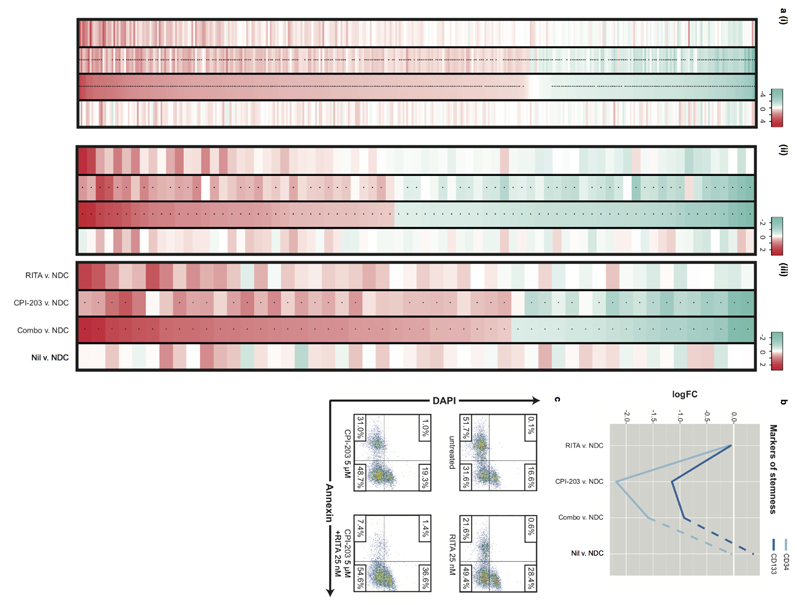
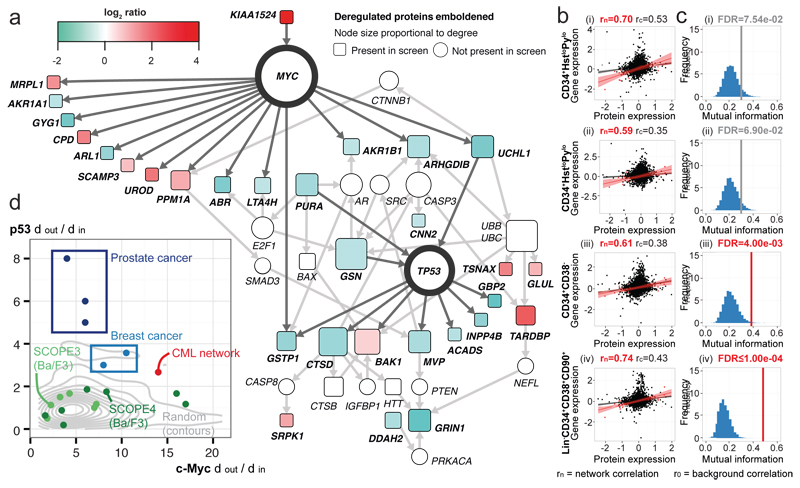
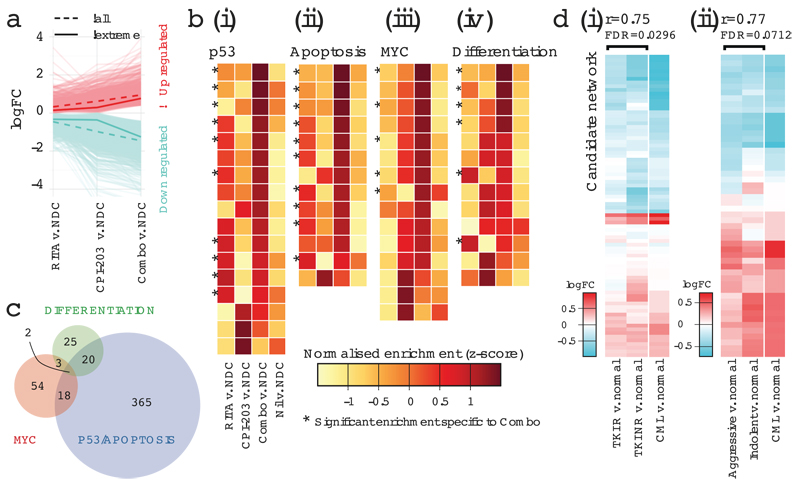
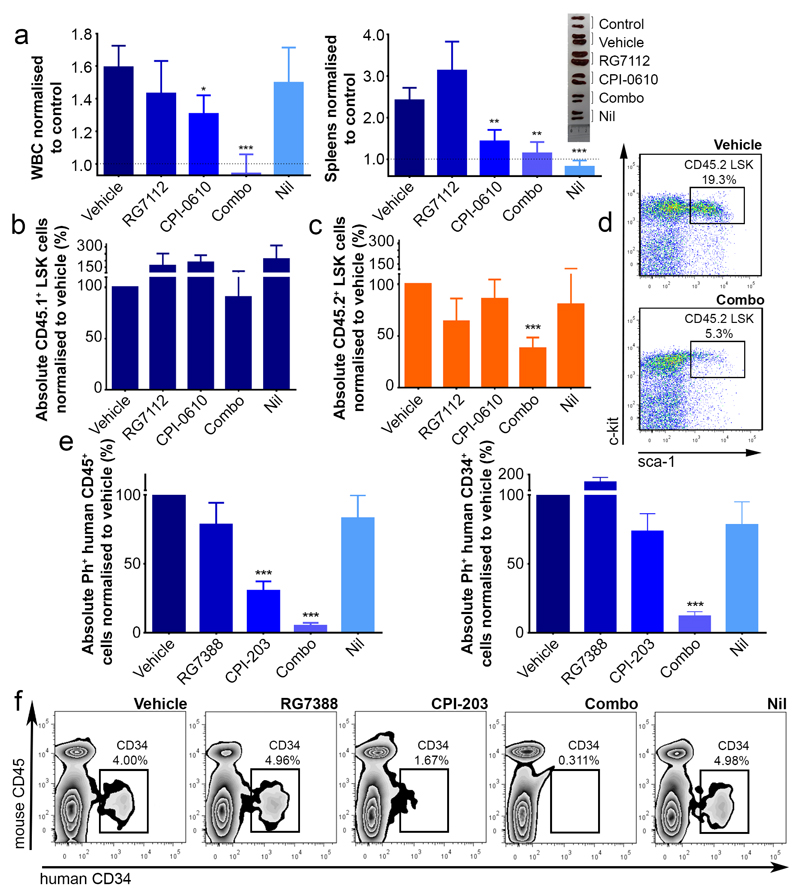
Chronic myeloid leukaemia (CML) arises after transformation of a haemopoietic stem cell (HSC) by the protein-tyrosine kinase BCR-ABL. Direct inhibition of BCR-ABL kinase has revolutionized disease management, but fails to eradicate leukaemic stem cells (LSCs), which maintain CML. LSCs are independent of BCR-ABL for survival, providing a rationale for identifying and targeting kinase-independent pathways. Here we show--using proteomics, transcriptomics and network analyses--that in human LSCs, aberrantly expressed proteins, in both imatinib-responder and non-responder patients, are modulated in concert with p53 (also known as TP53) and c-MYC regulation. Perturbation of both p53 and c-MYC, and not BCR-ABL itself, leads to synergistic cell kill, differentiation, and near elimination of transplantable human LSCs in mice, while sparing normal HSCs. This unbiased systems approach targeting connected nodes exemplifies a novel precision medicine strategy providing evidence that LSCs can be eradicated.


Conflict of interest statement

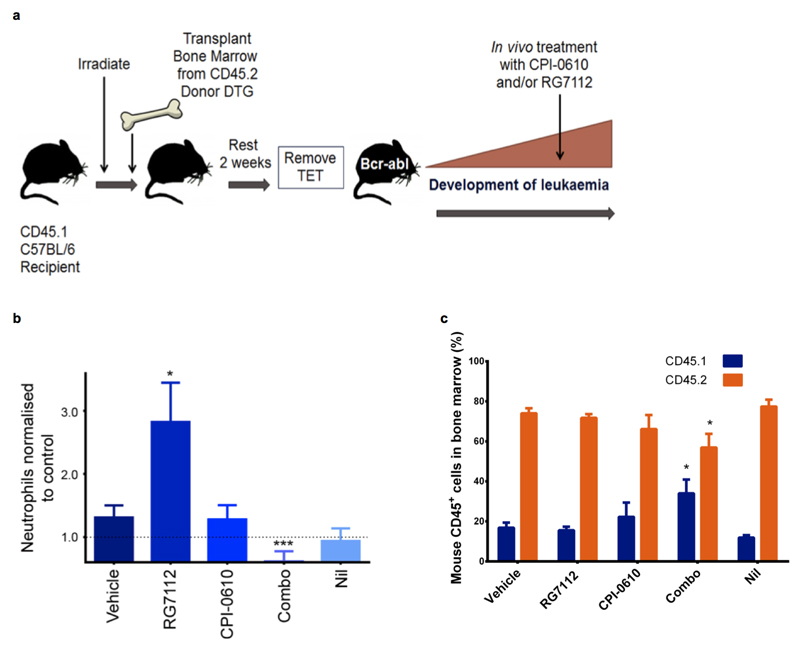
Competing Interest Declaration–The work presented in Fig. 6 was in part supported by funding from Constellation Pharmaceuticals and Roche.

Figures

Extended Data Figure 1
Extended Data Figure 1. BCR-ABL1 drives a proteomic signature mediated by p53 and c-Myc.
a-b, These figures are equivalent to Fig. 1b-c with additional information regarding the correlations calculated from the complete list of 58 candidate proteins (rc) in addition to the correlations for the candidate network (rn) and the background (r0). Also shown is the gain in r2 obtained for the candidate network as compared to the r2 obtained for the candidate list as a whole (r2Δ). FDR calculated from 10,000 resamplings. c, Expression changes of the network components (shown as bar plots) in the context of quiescent and primitive CML cells; data shown in each panel (L-R) are (1) CD34+ protein log2 ratios; (2) CD34+HstloPylo transcript logFC (E-MTAB-2508); (3) CD34+HstloPylo transcript logFC (GSE24739); (4) CD34+CD38 logFC (E-MTAB-2581); and (5) LinCD34+CD38CD90+ logFC (GSE47927). Down-/up-regulation are indicated by turquoise/red respectively. Where multiple probesets were found for individual genes, the probeset corresponding to the maximal log ratio was selected. d-e, Correlation of the candidate network in progenitor (CD34+) CML cells: (i) CD34+CD38+ progenitor (ii) common myeloid progenitor LinCD34+CD38+CD123+CD45RA (iii) CD34+ cells. As in a-b, correlations for the background (r0), candidate list (58 proteins, rc) and candidate network (Fig. 1a, rn) are shown. Also shown is the gain in r2 obtained for the candidate network as compared to the r2 obtained for the candidate list as a whole (r2Δ). FDR calculated from 10,000 resamplings; MI statistics corresponding to FDRs<0.05 are colored red (otherwise results are grey). f, A Venn diagram showing the overlap in protein identification of the three MS instruments: ABSciex Q-STAR® Elite (Elite), Thermo LTQ Orbitrap Velos (Orbi) and ABSciex TripleTOF 5600 (5600).
Extended Data Figure 2
Extended Data Figure 2. Validation of network candidates.
a, HDM2 and c-Myc knockdown using shRNA constructs. Western blots of c-Myc, HDM2, p53 and Hsp90 in HeLa cells transduced with lentiviral constructs specific for either c-Myc (2 constructs), HDM2 (2 constructs) or scrambled control (1 construct). b-d, CML CD34+ cells were transduced with either lentiviral (GFP) shRNA constructs to HDM2 (constructs 1, 2), c-Myc (constructs 1, 2) or scramble control (1 construct). b, Transduced viable GFP+ cells (assessed as AnnexinV-/DAPI-/GFP+ percentages multiplied by the absolute cell count) are presented as a percentage of CML CD34+ cells transduced with scramble control (n=3 PS). c, Early apoptosis levels (assessed as AnnexinV+/DAPI-/GFP+) post transduction of CML CD34+ cells (n=3 PS) as described in b. Statistical significance was calculated by a two-tailed student t test and error bars represent the SEM.
Extended Data Figure 3
Extended Data Figure 3. RITA and CPI-203 synergize to eliminate CML CD34+ cells.
a-b, Western blots of CML CD34+ cells untreated or treated with 50nM RITA; 1µM CPI-203; the combination of 50nM RITA and 1µM CPI-203 or 150nM Das for a, 8h. and b, 48h. c, p53 (red, nucleus in blue) 24h. post treatment in CML CD34+ cells. d, RITA, CPI-203 and combination drug treatment eliminates CD34+ CML cells through mechanisms likely dependent on apoptosis; after 72 h. of drug treatment apoptosis levels were assessed (AnnexinV/DAPI) using flow cytometry techniques. e, RITA or Nutlin3 (Nut) cannot induce death of K562 cells that lack p53. K562 cells were treated with either 50 µM RITA or 10 µM Nutlin3 (Nut) and after 72 h. of drug treatment, apoptosis levels were assessed (AnnexinV/DAPI) using flow cytometry techniques.
Extended Data Figure 4
Extended Data Figure 4. RITA and CPI-203 synergize to eliminate CML CD34+ cells continued.
a, CD34+ CML cells were treated with Nutlin3 and CPI-203 for 72 h. with apoptosis levels assessed (AnnexinV/DAPI) using flow cytometry techniques. b, Treatment of CD34+ CML cells with Nutlin3 results in the elimination of early and late progenitor cells as assessed by functional colony forming capacity of drug-treated CML cells. c, Sequential drug treatments (n=3 PS; drug one for 24h. then both for 48h.). d, Sequential knockdown treatments (n=3 PS; knockdown one for 24h. then both for 48h.), mean ± s.e.m. (P values: two-tailed student t test; *p<0.05, **p<0.01, ***p<0.001). e, CML CD34+ primary samples were pre-treated or not with IM (1 µM) for 8 h. followed by RITA (50 nM), CPI-203 (1 µM) or the combined treatment (RITA+CPI-203) for 72 h. (right 3 columns). Cell counts were obtained using trypan blue exclusion.
Extended Data Figure 5
Extended Data Figure 5. RITA and CPI-203 selectively eliminate LSC.
a, Viable cell counts (n=3 PS); b, apoptosis in normal CD34+ cells (n=3 PS) in response to RITA and/or CPI-203. c, Gated CML CD34+CD38 cells 72h. Post-treatment (n=4 PS). d, Ex-vivo protocol for CML/cord blood CD34+ cells in NSG mice (n=5 mice/arm). e-f, Targeting p53 and c-Myc in CML eliminates NSG repopulating leukaemic stem cells. CML CD34+ cells were treated with RITA (70 nM) and/or CPI-203 (1 µM) or Das (150 nM) for 48 h. and recovered cells were injected intravenously into 8-12-week old, sub-lethally irradiated (2.5 Gy) NSG mice (2-4 mice per arm). e, Percentage of human CD45+ cell levels in peripheral blood (PB) at 8, 12 and 16 weeks. f, Percentages of human CD45, CD34, CD33, CD11b, CD19 and CD14 positive cells in the bone marrow at 16 weeks. g, CML BM analyses CD33, CD11b, CD19 and CD14 from a CML sample determined to engraft both BCR-ABL positive and negative cells. h, D-FISH analyses of (g) BM human engraftment studies performed twice (2 PS) with a minimum of n=6 mice/ arm; mean ± s.e.m. (P values: two-tailed student t test; *p<0.05, **p<0.01, ***p<0.001).
Extended Data Figure 6
Extended Data Figure 6. Mechanism of LSC elimination and clinical scope
a, Enrichment of (i) p53; (ii), apoptosis; (iii), MYC; (iv), differentiation MSigDB signatures in the four treatment arms (columns named as per b). Figures a (i)-(iv) here are equivalent to Fig. 5b (i)-(iv), but with named MSigDB signatures. b, Enrichment of PANTHER pathways in the four treatment arms. Pathway enrichment calculated from (i) the top 1500 genes, as ranked by increasing p value; (ii), only those genes exhibiting an absolute FC of >0.5 in each arm; (iii), only those genes exhibiting a p value of >0.05 in each arm. c, Assessing molecular synergy of the combined RITA+CPI-203 treatment, as compared to the individual RITA and CPI-203 arms of the RNA-seq experiments in the three in silico functional signatures: (i) p53/apoptosis; (ii) MYC and (iii) differentiation. Mean expression is shown as a solid line.
Extended Data Figure 7
Extended Data Figure 7. Mechanism of LSC elimination and clinical scope continued.
a, Gene expression patterns (logFC) shown for the members of the three broad signatures identified in silico: (i) p53/apoptosis; (ii) MYC and (iii) differentiation (*=q<0.05). Corresponding Expression data provided in Supplementary Tables 5-7. b, Differential expression of CD34 and CD133 (markers of stemness) in the four arms of the RNA-seq experiment. c, Apoptosis levels assessed (AnnexinV+/DAPI) using flow cytometry on a TKI-NR CD34+ sample after 72 h. treatment with RITA and CPI-203 as indicated.
Extended Data Figure 8
Extended Data Figure 8. RG7112 and CPI-0610 as a combination decrease BCR-ABL+ cells
a, DTG mice in vivo treatment: b, neutrophils – normalised to control (·····). c, Bone marrow (BM) cells stained for CD45.1/2. Drug treatment arms (minimum of n=7 mice) mean ± s.e.m. (P values: two-tailed student t test; *p<0.05, **p<0.01, ***p<0.001).
Figure 1
Figure 1
p53 and c-Myc network in CML regulation. (a) Network analysis reveals c-Myc and p53 central in a putative CML network. (b) Correlation between proteomic/transcriptomic deregulation in primitive (i-ii) CD34+HstloPylo (G0) (iii) CD34+CD38 (iv) LinCD34+CD38CD90+ CML cells (●=all protein/genes; ●=network). (c) Gene/protein MI for the CML network (red FDR<0.05; grey FDR<0.10); FDR calculated using 10,000 re-samplings (blue histogram). (d) The out:in degree ratio for p53 and c-Myc in haematological PTK-regulated cell lines; other primary cancers and random protein networks.
Figure 2
Figure 2
Validation of proteomic network. (a) Network proteins, p53 and c-Myc western blots using CML and normal CD34+ cells. For gel source data, see Supplementary Figure 1. (b) Network proteins validated by IF in CML and normal CD34+ cells labelled (i) green or red (ii) nucleus (blue) using DAPI (iii) overlays of images (iv) 3D fluorescent signal. (c) CML CD34+ cells post HDM2, c-Myc, or scramble kd (n=6 PS). (d) Apoptosis post kd (n=4 PS). (e) CFC from kd (n=3 PS). Values normalised to scrambled control, mean ± s.e.m. (P values: two-tailed student t test; *p<0.05, **p<0.01, ***p<0.001).
Figure 3
Figure 3
Modulation of p53 and c-Myc demonstrates CML sensitivity. (a) Drug titrations: cell viability with combination indices (C.I.) (n=3 PS), (b) apoptosis (n=3 PS). (c) CFSE/CD34 labelled cells. Cell divisions are multi-coloured. Representative of n=3 PS. (d) CFC from treated cells. Representative of n=3 PS. (e) Averaged CFC (n=3 PS). One experiment represented in (d), mean ± s.e.m. (P values: two-tailed student t test; *p<0.05, **p<0.01, ***p<0.001).
Figure 4
Figure 4
p53/c-Myc abrogation in normal/primitive CML cells. (a) CFSE/CD34 labelled CML cells. (b) Recovery of CFSEmax CML cells after 5 days treatment (n=3 PS). (c) BM analyses of human CML, replicated twice (2 PS), with a minimum of n=6 mice/arm. (d) BM analyses of human Cord Blood replicated once n=5 mice/arm; mean ± s.e.m. (P values: two-tailed student t test; *p<0.05, **p<0.01, ***p<0.001).
Figure 5
Figure 5
Mechanism and clinical relevance of treatment. (a) Molecular synergy for 100nM RITA, 1µM CPI-203 and RITA+CPI-203 (Combo) 24h. treatment; mean (μ) expression of ‘all’ and ‘extreme’ synergistic genes summarized as indicated. (b) Enrichment of (i) p53 (ii) apoptosis (iii) MYC (iv) differentiation MSigDB signatures. (c) Gene membership of three functional signatures. (d) Comparison of transcriptional profiles of (i) R/NR-CML (TKI-responder/TKI-non-responder) vs. normal and (ii) Aggressive/Indolent CML vs. normal for our candidate network (Fig. 1a).
Figure 6
Figure 6
Targeting p53 and c-Myc in CML elicits synergistic kill in BCR-ABL1+ LSC. (a) WBC, spleen weights – normalised to control (·····) (experiments replicated twice, minimum n=7 mice/arm; vehicle=no drug control). (b-d) BM stained for CD45.1/2 and further gated on LinSca-1+c-Kit+ (LSK). Drug treatments (experiments replicated twice, minimum n=5 mice/arm). (e-f) NSG mice in vivo treatment: BM stained for human Ph+ CD45+ (left) and further gated on CD34+ cells (right). (g) representative CD34+ dotplots (experiments replicated twice (2 PS), minimum n=9 mice/arm); mean ± s.e.m. (P values: two-tailed student t test; *p<0.05, **p<0.01, ***p<0.001).

Comment in

References

    1. O’Hare T, Zabriskie MS, Eiring AM, Deininger MW. Pushing the limits of targeted therapy in chronic myeloid leukaemia. Nat Rev Cancer. 2012;12:513–526. doi: 10.1038/nrc3317. - DOI - PubMed
    1. Druker BJ, et al. Activity of a specific inhibitor of the BCR-ABL tyrosine kinase in the blast crisis of chronic myeloid leukemia and acute lymphoblastic leukemia with the Philadelphia chromosome. N Engl J Med. 2001;344:1038–1042. doi: 10.1056/NEJM200104053441402. - DOI - PubMed
    1. Graham SM, et al. Primitive, quiescent, Philadelphia-positive stem cells from patients with chronic myeloid leukemia are insensitive to STI571 in vitro. Blood. 2002;99:319–325. - PubMed
    1. Mahon FX, et al. Discontinuation of imatinib in patients with chronic myeloid leukaemia who have maintained complete molecular remission for at least 2 years: the prospective, multicentre Stop Imatinib (STIM) trial. The lancet oncology. 2010;11:1029–1035. doi: 10.1016/S1470-2045(10)70233-3. - DOI - PubMed
    1. Corbin AS, et al. Human chronic myeloid leukemia stem cells are insensitive to imatinib despite inhibition of BCR-ABL activity. J Clin Invest. 2011;121:396–409. doi: 10.1172/JCI35721. - DOI - PMC - PubMed

Publication types

MeSH terms