. 2016 Nov 1;22(21):5337-5348.
doi: 10.1158/1078-0432.CCR-15-2973. Epub 2016 Jun 8.

Inhibition of SOAT1 Suppresses Glioblastoma Growth via Blocking SREBP-1-Mediated Lipogenesis

Affiliations

Inhibition of SOAT1 Suppresses Glioblastoma Growth via Blocking SREBP-1-Mediated Lipogenesis

Feng Geng et al. Clin Cancer Res. .

Erratum in

Abstract

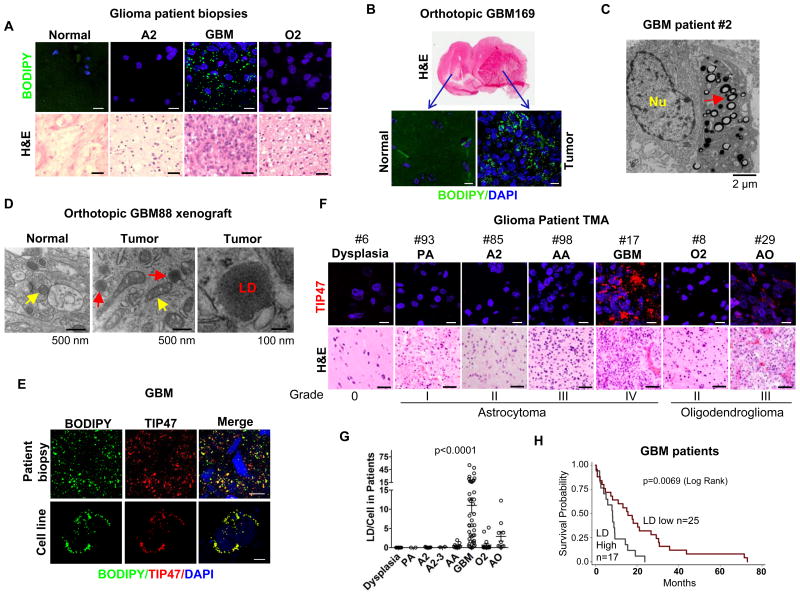
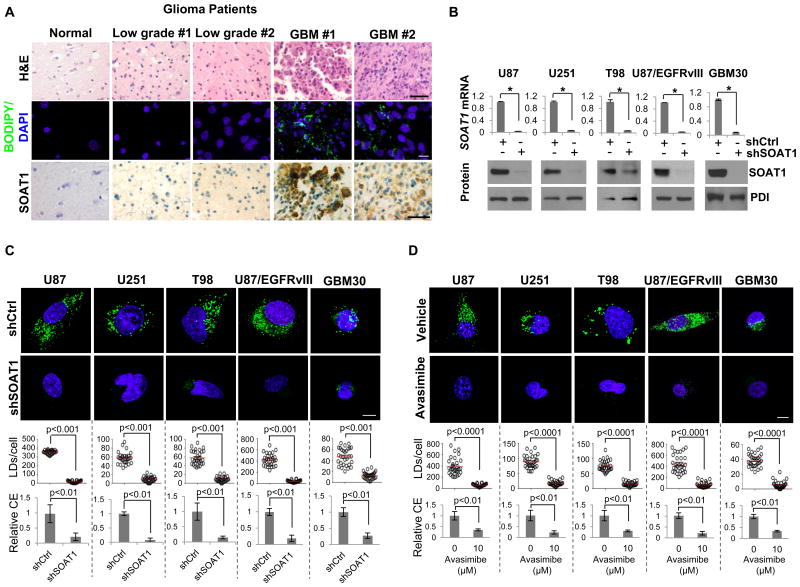
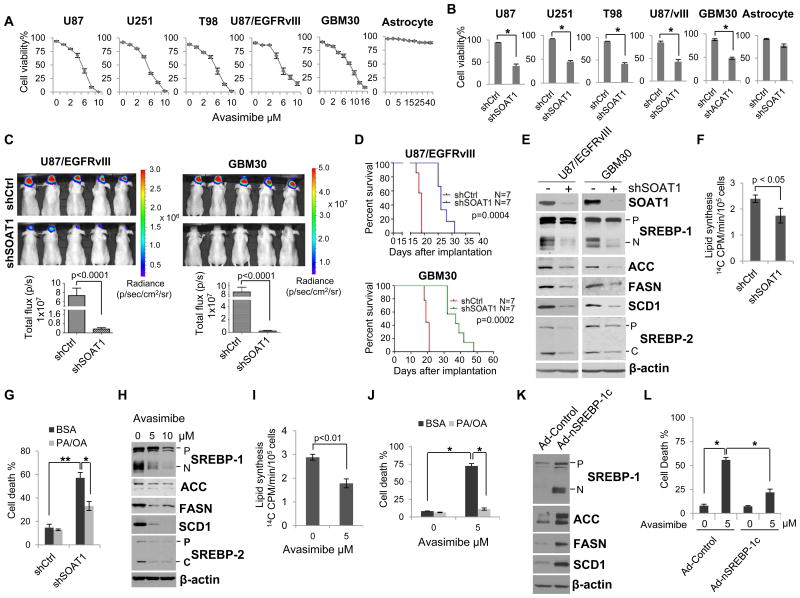
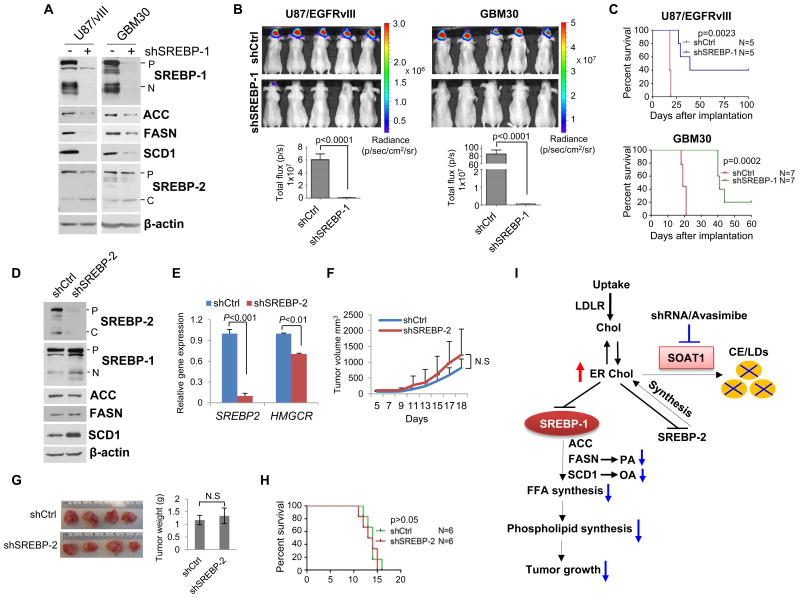
Purpose: Elevated lipogenesis regulated by sterol regulatory element-binding protein-1 (SREBP-1), a transcription factor playing a central role in lipid metabolism, is a novel characteristic of glioblastoma (GBM). The aim of this study was to identify effective approaches to suppress GBM growth by inhibition of SREBP-1. As SREBP activation is negatively regulated by endoplasmic reticulum (ER) cholesterol, we sought to determine whether suppression of sterol O-acyltransferase (SOAT), a key enzyme converting ER cholesterol to cholesterol esters (CE) to store in lipid droplets (LDs), effectively suppressed SREBP-1 and blocked GBM growth.

Experimental design: The presence of LDs in glioma patient tumor tissues was analyzed using immunofluorescence, immunohistochemistry, and electronic microscopy. Western blotting and real-time PCR were performed to analyze protein levels and gene expression of GBM cells, respectively. Intracranial GBM xenografts were used to determine the effects of genetically silencing SOAT1 and SREBP-1 on tumor growth.

Results: Our study unraveled that cholesterol esterification and LD formation are signature of GBM, and human patients with glioma possess elevated LDs that correlate with GBM progression and poor survival. We revealed that SOAT1 is highly expressed in GBM and functions as a key player in controlling the cholesterol esterification and storage in GBM. Targeting SOAT1 suppresses GBM growth and prolongs survival in xenograft models via inhibition of SREBP-1-regulated lipid synthesis.

Conclusions: Cholesterol esterification and storage in LDs are novel characteristics of GBM, and inhibiting SOAT1 to block cholesterol esterification is a promising therapeutic strategy to treat GBM by suppressing SREBP-1. Clin Cancer Res; 22(21); 5337-48. ©2016 AACR.


Conflict of interest statement

The authors declare that there are no any conflicts of interest for this manuscript.

Figures

Figure 1
Figure 1. Lipid droplets are signature of GBM and inversely correlates with patient survival
A-B, Representative confocal microscopy images of cryosections of tissue biopsies from glioma patients (A) or from primary GBM169 orthotopic mouse model (B) stained with BODIPY 493/503 (green) and DAPI (blue) (upper panels). Tumor tissues were also stained by H&E (lower panels). Abbreviations, A2: grade II astrocytoma; GBM: glioblastoma; O2: grade II oligodendroglioma. Scale bar, 10 μm for fluorescence imaging, 50 μm for H&E staining. C-D, Representative electron micrographs of tumor tissues from GBM patients (C), or primary GBM88 orthotopic xenograft mouse model (D). E, Representative fluorescent microscopy images of GBM patient tissues and U251 cells stained with BODIPY 493/503 (green), TIP47 antibody (red) and DAPI (blue). Scale bar, 10 μm. F-G, Representative images of tissue samples from a tissue microarray (TMA), containing low to high grade of glioma patient samples (over 100 patients) and details please see Supplemental Table 1, stained by TIP47 (red) and DAPI (blue) (F). Data shown in panel G represent dot blot of quantification of LDs/cell in each sample in the TMA. LDs stained by TIP47 in each patient sample were quantified by ImageJ software and analyzed by GraphPad Prism and one-way ANOVA, P < 0.0001 (G). Scale bar, 10 μm for fluorescence imaging, 50 μm for H&E staining. PA, pilocytic astrocytoma; AA, anaplastic astrocytoma (grade III); AO, anaplastic oligodendroglioma (grade III). H, Kaplan-Meier analysis of overall survival of GBM patients stratified on the basis of LD number in each clinical sample. The mean of LD number in total GBM patients is 11 LDs/cell. Patients with more than this number were grouped as high LD group (n = 17), less than this number as low LD group (n = 25). GBM patient survival between low and high LDs was analyzed by log-rank test, p = 0.0069.
Figure 2
Figure 2. Inhibition of cholesterol esterification via targeting SOAT1 blocks LD formation
A, human tissues from glioma patients were stained by H&E (upper panel), BODIPY 493/503 (green)/DAPI (blue) (middle panel) or immunohistochemistry (IHC) via using SOAT1 antibody (lower panel). Scale bar, 50 μm for H&E (upper panel) and IHC staining (lower panel), 10 μm for fluorescence imaging (middle panel). B, Relative SOAT1 gene expression analyzed by real-time RT-PCR (upper panel) and its protein level analyzed by western blot (lower panel) in different GBM cell lines and GBM30, primary GBM patient-derived cells, infected with shRNA-expressing lentivirus against SOAT1 for 48 hr. Significance for gene expression (upper panel) was determined by an unpaired Student's t test (mean ± SD, n = 3). *p < 0.001. SOAT1 protein was detected from membrane extracts of GBM cells (please see details in Materials and Methods). Protein disulfide-isomerase (PDI), an ER-resident protein, was used as internal control. C-D, Top panels show representative live confocal microscopy images of indicated GBM cells knocked down for SOAT1 (48 hr) (C) or treated with SOAT inhibitor avasimibe (10 μM) for 24 hr (D), after staining by BODIPY 493/503 (green) and Hoechst 33342 (nuclear, blue). Scale bar, 10 μm. Bottom represents quantification of LDs/cell quantified by ImageJ software in over 30 cells (mean ± SEM, n = 30), and relative CE levels measured by CE measuring kit (mean ± SD, n=3), respectively. Significance was determined by an unpaired Student's t test.
Figure 3
Figure 3. Inhibition of SOAT1 suppresses GBM growth via blocking SREBP-1-regulated fatty acid synthesis
A- B, GBM cells or normal astrocyte were treated with SOAT inhibitor avasimibe at different doses for 3 days (A) or knockdown of SOAT1 for 5 days (B), cell number were then counted after trypan blue staining and cell viability was analyzed via live cells dividing total cell numbers (mean ± SD, n = 3). Significance was determined by an unpaired Student's t test. * P < 0.001. C, In vivo luminescent imaging of mice bearing intracranial U87/EGFRvIII-luciferase or GBM30-luciferase cells in athymic nude mice on day 15 after intracranially implanting the indicated GBM cells (upper panel). Lower panel shows the quantification of luminescence signal intensity from intracranial tumor on day 15 after implanting the indicated GBM cells. Statistical significance was analyzed by an unpaired Student's t test (mean ± SEM, n = 7). D, Kaplan-Meier analysis shows the overall survival of U87/EGFRvIII- or GBM30-bearing orthotopic mouse with shSOAT1 knockdown in comparison to scramble shRNA control and analyzed by log-rank test (n =7). E, Western blot analysis of total cell lysates from U87/EGFRvIII or primary GBM30 cells after knockdown of SOAT1 for 48 hr. P: SREBP-1 or SREBP-2 precursor, which is full length of SREBP protein; N: N-terminal cleavage form of SREBP-1 which translocates into nuclei acting as transcription factor; C: C-terminal cleavage form of SREBP-2 which remains in cytoplasmic. F, 14C-labeled glucose was added to U87/EGFRvIII cells for 2 hr after knockdown of SOAT1 for 48 hr, lipids were then extracted and measured by scintillation counter. Significance was determined by an unpaired Student's t test (mean ± SD, n = 3). G, The mixture of palmitate (PA, 10 μM) and oleic acid (OA, 15 μM), which were conjugated with lipid-free BSA, were added into U87/EGFRvIII cells 24 hr post knockdown of SOAT1, and cell death percentage was analyzed by counting live and dead cell number after trypan blue staining at day 5. Significance was determined by an unpaired Student's t test (mean ± SD, n = 3). * P < 0.01, ** P < 0.001. H, Western blot analysis of total cell lysates from U87/EGFRvIII cells after avasimibe treatment for 24 hr. The abbreviations of P, N and C are same as panel E. I, 14C-labeled glucose was added into U87/EGFRvIII cells for 2 hr after avasimibe treatment for 24 hr, lipids were then extracted and measured by scintillation counter. Significance was determined by an unpaired Student's t test (mean ± SD, n = 3). J, U87/EGFRvIII cells were treated with avasimibe (5 μM) with/without addition of PA (10 μM) and OA (15 μM) for 3 days, and cell number were counted after trypan blue staining. Significance was determined by an unpaired Student's t test (mean ± SD, n = 3). *p < 0.001. K, Western blot analysis of the total cell lysates from U87/EGFRvIII cells overexpressing adenovirus-mediated SREBP-1c N-terminal fragment (aa 1-461, Ad-nSREBP-1c) for 24 hr. L, U87/EGFRvIII cells were infected with Ad-control or Ad-nSREBP-1c virus for 24 hr, and then treated with avasimibe (5 μM) for 48 hr, cell number were counted after trypan blue staining. Significance was determined by an unpaired Student's t test (mean ± SD, n = 3). *p < 0.001.
Figure 4
Figure 4. Inhibition of SREBP-1 suppresses GBM tumor growth
A-C, U87/EGFRvIII or primary GBM30 cells stably expressing luciferase were infected with shRNA-expressing lentivirus for 48 hr to knockdown the expression of SREBP-1. Western blotting was performed to analyze the total cell lysates by using indicated antibodies (A). Cells were analyzed for in vivo growth after intracranial implantation into nu/nu mice (1 × 10⁵ cells/mouse). Luminescent images were taken on day 15 (B, upper panel) and luminescence signal intensity in mice were quantified (mean ± SEM, n = 7) (B, lower panel). Mouse overall survival was analyzed by Kaplan-Meier plot (C). Statistical significance was analyzed by log-rank test. p = 0.0023. D-E, Western blot analysis of total cell lysates (D) or real-time PCR analysis (E) of U87/EGFRvIII cells after silencing of SREBP-2 using shRNA lentivirus in comparison with control virus infection (shCtrl). HMG-CoA reductase (HMGCR), a downstream target of SREBP-2 was also analyzed by real-time PCR (E). F-G, 1×10⁶ U87/EGFRvIII cells stably expressing shSREBP-2 or shControl were implanted into mouse flanks. Tumor size was measured every other day (F) and was imaged and weighted after isolation from mouse flanks on day 18 (G). Statistical significance was analyzed by an unpaired Student's t test (mean ± SEM, n = 6). N.S: No significant difference. H, 1×10⁵ U87/EGFRvIII cells stably expressing shControl (shCtrl) or shSREBP-2 were implanted into mouse intracranially and mouse overall survival was analyzed by Kaplan-Meier plot and log-rank test. p > 0.05 between two groups. I, Schematic model illustrates the functional interplay between SOAT1, LDs and SREBP-1 in lipid metabolism and tumorigenesis of GBM. Increased CE and LDs are signatures of GBM. Inhibition of SOAT1 blocks CE synthesis and LD formation. This leads to an accumulation of cholesterol in the ER membrane, and consequently triggers feedback inhibition on SREBP-1 and SREBP-2 function. Suppression of SREBP-1 by targeting SOAT1 leads to the reduction of fatty acid synthesis (PA and OA) and phospholipid formation that restrains GBM tumor growth. Chol, cholesterol; FFA, free fatty acids; PA, palmitate; OA, oleic acid.

References

    1. Menendez JA, Lupu R. Fatty acid synthase and the lipogenic phenotype in cancer pathogenesis. Nat Rev Cancer. 2007;7:763–77. - PubMed
    1. Guo D, Bell EH, Chakravarti A. Lipid metabolism emerges as a promising target for malignant glioma therapy. CNS Oncology. 2013;2:289–99. - PMC - PubMed
    1. Guo D. SCAP links glucose to lipid metabolism in cancer cells. Mol Cell Oncol. 2016;3 - PMC - PubMed
    1. Guo D, Reinitz F, Youssef M, Hong C, Nathanson D, Akhavan D, et al. An LXR agonist promotes GBM cell death through inhibition of an EGFR/AKT/SREBP-1/LDLR-dependent pathway. Cancer Discov. 2011;1:442–56. - PMC - PubMed
    1. Guo D, Prins RM, Dang J, Kuga D, Iwanami A, Soto H, et al. EGFR signaling through an Akt-SREBP-1-dependent, rapamycin-resistant pathway sensitizes glioblastomas to antilipogenic therapy. Sci Signal. 2009;2:ra82. - PMC - PubMed

MeSH terms