. 2016 Jun 8;19(6):826-36.
doi: 10.1016/j.chom.2016.05.007.

The Response of Acinetobacter baumannii to Zinc Starvation

Affiliations

The Response of Acinetobacter baumannii to Zinc Starvation

Brittany L Nairn et al. Cell Host Microbe. .

Abstract

Zinc (Zn) is an essential metal that vertebrates sequester from pathogens to protect against infection. Investigating the opportunistic pathogen Acinetobacter baumannii's response to Zn starvation, we identified a putative Zn metallochaperone, ZigA, which binds Zn and is required for bacterial growth under Zn-limiting conditions and for disseminated infection in mice. ZigA is encoded adjacent to the histidine (His) utilization (Hut) system. The His ammonia-lyase HutH binds Zn very tightly only in the presence of high His and makes Zn bioavailable through His catabolism. The released Zn enables A. baumannii to combat host-imposed Zn starvation. These results demonstrate that A. baumannii employs several mechanisms to ensure bioavailability of Zn during infection, with ZigA functioning predominately during Zn starvation, but HutH operating in both Zn-deplete and -replete conditions to mobilize a labile His-Zn pool.


Figures

Figure 1
Figure 1. ZigA is required for full growth in low Zn and during infection
(A) ZigA protein expression was assessed in WT and ΔzigA in LB or LB plus 20 µM TPEN or in 250 µg/mL CP. (B) WT or ΔzigA were grown in the absence or presence of 250 µg/mL CP plus or minus Zn or Mn. Graph depicts % growth at 8 h. *p < 0.0001 as determined by Student’s t test. (C) WT or ΔzigA were grown in the absence or presence of 500 µg/mL S100A12 plus or minus Zn or Cu. Graph depicts % growth at 8 h. *p < 0.05 as determined by Student’s t test. (D) Growth of WT + vector, ΔzigA + vector, and ΔzigA + pzigAMyc was monitored in LB or LB plus 40 µM TPEN. Graph depicts % growth at 8 h. *p < 0.05 as determined by Student’s t test. (E, F) WT or S100A9−/− mice were infected intranasally with WT and ΔzigA in a competition experiment. At 36 h, lungs (E) and livers (F) were removed, homogenized, and CFU were enumerated. *p < 0.05 as determined by Kruskal-Wallis with Dunn’s multiple comparisons (see Figure S1).
Figure 2
Figure 2. ZigA is a COG0523 group 1 member that clusters with the hut operon
(A) Conserved residues and motifs of the ZigA subfamily; positions correspond to the ZigA sequence numbering. (B) A subset of the COG0523 group 1 sequences with the addition of the paralog from another COG0523 subgroup found in A. baumannii (A1S_0934) were used to generate a phylogenetic tree; clustering with the hut operon or folE2 encoding a non-Zn requiring paralog of GTP cyclohydrolase, GTP cyclohydrolase 1b, is noted. (C) Gene neighborhoods of ZigA in two A. baumannii species and in A. baylyi ADP1 showing the positions of the Zur and HutC binding site in A. baumannii AB0057. (D) Enzymatic pathway of His degradation. (E) Expression of zigA and A1S_0934 in CP-treated A. baumannii as assessed by qRT-PCR. * p < 0.05 as determined by Student’s t test.
Figure 3
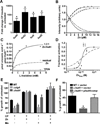
Figure 3. ZigA is a Mg- and Zn-binding GTPase
(A) Zn-bound ZigA (closed circles) or apo-ZigA (with 0.1 mM TPEN (open circles)) (2 µM) was incubated with the indicated [GTP] for 1.5 h (see Figure S2), followed by quantitation of the released inorganic phosphate (Pi). The continuous lines through the data are fits to the Michaelis–Menten equation. For Zn-bound-ZigA, Km (GTP) = 150 (± 60) µM, kcat = 2.1 (± 0.3) × 10−3 s−1. For apo-ZigA, kcat = 3.0 (±0.2) × 10−4 s−1 with Km constrained to the value for Zn-ZigA. (B) Recombinant ZigA was analyzed by ICP-MS for associated Mg, Mn, Fe, Cu, and Zn concentrations. *p < 0.05 as determined by one-way ANOVA. (C) Duplicate binding isotherms (mean and range shown for each data point) obtained from titrating Zn into a mixture of metal-free apo-ZigA (5.0 µM protomer) and mf2 (2.0 µM) competitor. Filled symbols, emission intensity with excitation at 333 nm; open symbols, excitation at 378 nm. The continuous line represents a global non-linear, least-squares fit to a 2:1 Zn:ZigA protomer model, with KZn1≥10 M−1 (lower limit) and KZn2 = 2.6 (±0.4) × 10 M−1. (D) ZigA was subjected to chromatography on Sephadex G200 in the apo-state (black, solid line); + 2.0 protomer mol•equiv of Zn (black, dashed); + 2.0 protomer mol•equiv of Zn + 3 mM Mg2+•GDP (blue, long-dash); + 3 mM Mg2+•GDPNP (red, dashed line); + 2.0 protomer mol•equiv of Zn + 3 mM Mg2+•GDPNP (red, solid). The absorbance at 19 mL corresponds to added nucleotide (defines the included volume). Dimer: 100 kDa measured (92.8 kDa expected); monomer: 64 kDa measured (46.4 kDa expected).
Figure 4
Figure 4. HutH binds Zn and is important for growth in low Zn conditions
(A) Gene expression of hutH, hutU, hutI, and hutG in CP-treated A. baumannii as assessed by qRT-PCR. *p<0.05 as determined by Student’s t test. (B) Representative binding isotherms obtained from titrating Zn into a mixture of apo-HutH (5.1 µM, circles; 8.5 µM, triangles) and mf2 (2.0 µM) competitor. Filled symbols, emission intensity with excitation at 333 nm; open symbols, excitation at 378 nm. The continuous line represents a global non-linear, least-squares fit to a 1:1 Zn:ZigA protomer model, with KZn1= 5.0 (± 0.2) × 10 M−1. (C) HAL activity was measured using an LC-based assay to detect urocanic acid. HAL activity (0.5 µM HutH) as a function of L-His in the presence of saturating Zn (filled circles); residual Zn (0.1 µM) in the assay buffer (open circles); in the presence of 0.15 mM TPEN (closed triangles). The continuous lines through the data points represent a fit to the Michaelis-Menten equation with the optimized: Km=0.7 (±0.1) mM, with maximal velocities, Vmax=0.15 (±0.01) s−1 for Zn-saturated HutH and 0.045 (±006) s−1 for residual Zn. (D) HutH (0.5 µM) HAL specific activity (kcat, s−1) was measured at excess total Zn, but with varying [Zn]free, buffered with 0.25 mM EGTA at 5.0 mM L-His (≈8-fold over the Km). The continuous line through the data represent a fit to a simple cooperative Hill binding model with nH=4 leading to ≈30-fold activation by Zn (kcat: 0.16 (+/−0.01) s−1 (+Zn); kcat: 6.0 (+/−3.0) × 10−3 s−1 (–Zn)). KZn for HutH activation is 8.5 × 10⁹ M−1Dashed line, fit to a non-cooperative Zn-activation model. (E) WT, ΔzigA, and ΔhutH were grown in the absence or presence of 250 µg/mL CP plus or minus Zn or Mn. Graph depicts % growth at 8 h. *p<0.05 as determined by two-way ANOVA. (F) WT + vector, ΔhutH + vector, and ΔhutH + phutHcomp were grown in the absence or presence of 40 µM TPEN. The graph depicts % growth at 8 h. *p < 0.05 as determined by Student’s t test (see Figures S3–S4).
Figure 5
Figure 5. ZigA and HutH impact a His-Zn pool
(A, B) WT, ΔzigA, ΔhutH, and ΔhutU were grown the presence of (A) 250 µg/mL CP or (B) 500 µM ZnCl2, and intracellular His levels were assessed by mass spectrometry. *p < 0.05 as determined by Student’s t test. (C) WT, ΔzigA, and ΔhutH were grown in LB or LB plus 1.25 mM ZnCl2, depicted as % growth at 12 h. *p < 0.0001 as determined by Student’s t test. (D) WT, ΔzigA, and ΔhutH were grown in LB plus 1.25 mM ZnCl2 and 1 mM of L-His or D-His were added to the cultures. Graph depicts % growth of each strain in the treated condition compared to LB at 8 h. (E) WT, ΔzigA, and Δzur were grown in M9 media with 50 mM His as a sole carbon source in Zn replete or deplete (no Zn added) conditions. *p < 0.05 as determined by two-way ANOVA. (F) Intracellular Zn levels in WT, ΔzigA, and ΔhutH in CP-treated vs. untreated cells as measured by ICP-MS. *p<0.05 as determined by Student’s t test. (G) Expression of Zur-regulated genes in ΔzigA in the absence of CP compared to WT as assessed by qRT-PCR. *p<0.05 as determined by Student’s t test (see Figure S5).
Figure 6
Figure 6. The His-Zn pool is affected by the HutT His importer
(A) WT, ΔzigA, ΔhutH, and ΔhutT were grown in the absence or presence of 250 µg/mL CP. Graph depicts % growth at 8 h. *p < 0.05 as determined by two-way ANOVA. (B) WT + vector, ΔhutT + vector, and ΔhutT + phutTcomp were grown in the absence or presence of 40 µM TPEN. Graph depicts growth at 8 h. *p < 0.05 as determined by Student’s t test. (C) WT, ΔzigA, ΔhutH, ΔhutU, and ΔhutT were grown in M9 media with a titration of His or acetate as a sole carbon source. *p < 0.05 as determined by Student’s t test. (D) WT, ΔzigA, ΔhutH, ΔhutT, and ΔznuB were grown in LB or LB plus 1.25 mM ZnCl2. Graph displays % growth at 12 h. *p < 0.0001 as determined by Student’s t test. (E) Zn uptake was evaluated following growth plus or minus CP for WT or ΔhutT after 30 min incubation with Zn70, and ICP-MS analysis of intracellular Zn70 shown as net intensity mean. *p < 0.05 as determined by Student’s t test. (F) Uptake of His-Zn complexes in CP-treated cells was assessed for WT and ΔhutT incubated for 30 min with Zn70-His complexes and the intracellular Zn70:Zn66 ratio measured by ICP-MS. *p < 0.05 as determined by Student’s t test (see Figure S6).

Similar articles

Cited by

References

    1. Andreini C, Banci L, Bertini I, Rosato A. Zinc through the three domains of life. J. Proteome Res. 2006;5:3173–3178. - PubMed
    1. Attin T, Becker K, Hannig C, Buchalla W, Wiegand A. Suitability of a malachite green procedure to detect minimal amounts of phosphate dissolved in acidic solutions. Clin. Oral Investig. 2005;9:203–207. - PubMed
    1. Bender RA. Regulation of the histidine utilization (hut) system in bacteria. Microbiol. Mol. Biol. R. 2012;76:565–584. - PMC - PubMed
    1. Blaby-Haas CE, Flood JA, Crecy-Lagard V, Zamble DB. YeiR: a metal-binding GTPase from Escherichia coli involved in metal homeostasis. Metallomics. 2012;4:488–497. - PMC - PubMed
    1. Bruins MR, Kapil S, Oehme FW. Microbial resistance to metals in the environment. Ecotoxicol. Environ. Saf. 2000;45:198–207. - PubMed

MeSH terms

LinkOut - more resources