. 2016 Jul 12;7(28):43124-43149.
doi: 10.18632/oncotarget.8988.

Wnt-beta-catenin pathway signals metastasis-associated tumor cell phenotypes in triple negative breast cancers

Affiliations

Wnt-beta-catenin pathway signals metastasis-associated tumor cell phenotypes in triple negative breast cancers

Pradip De et al. Oncotarget. .

Abstract

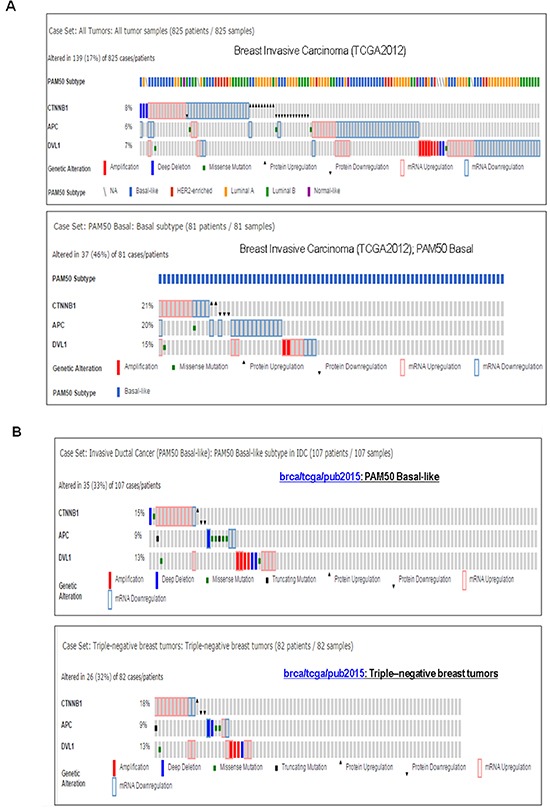
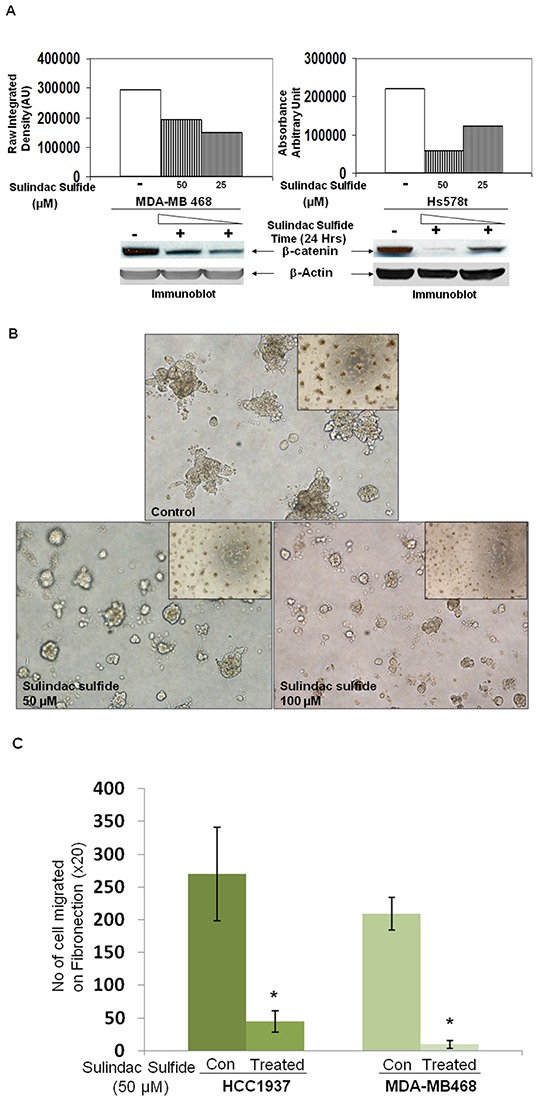
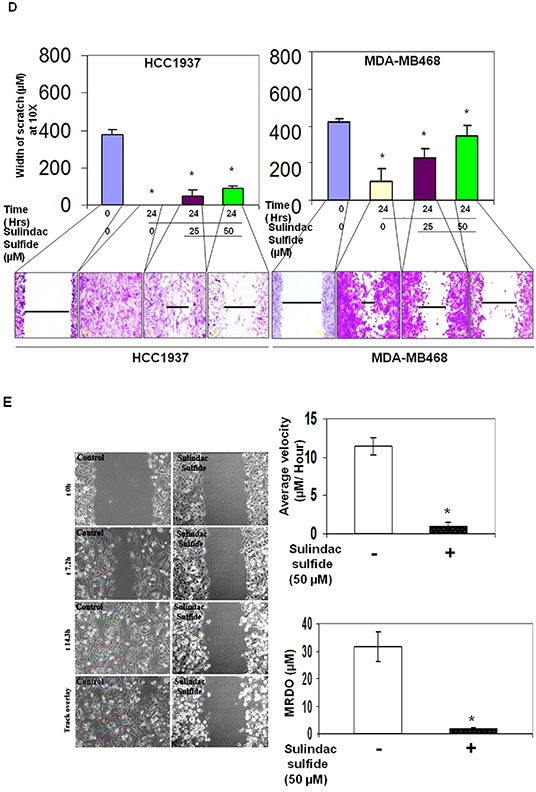
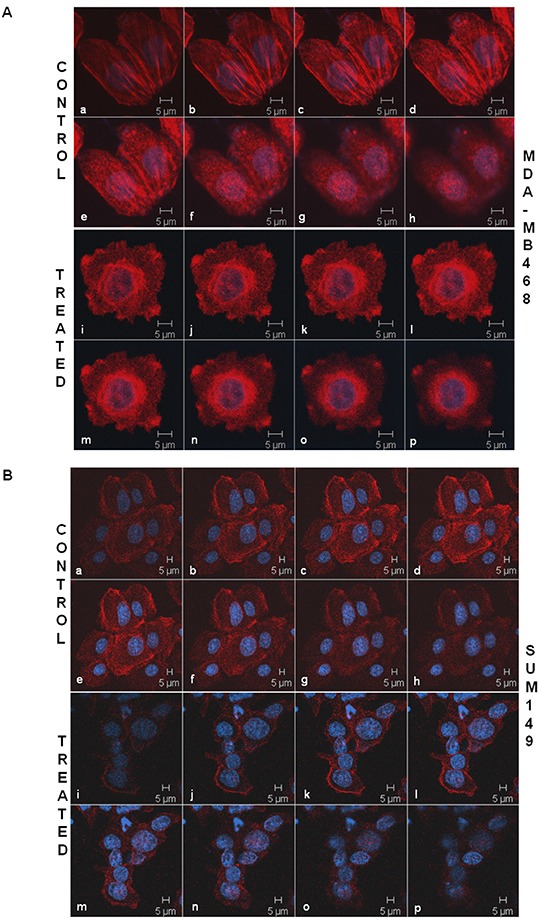
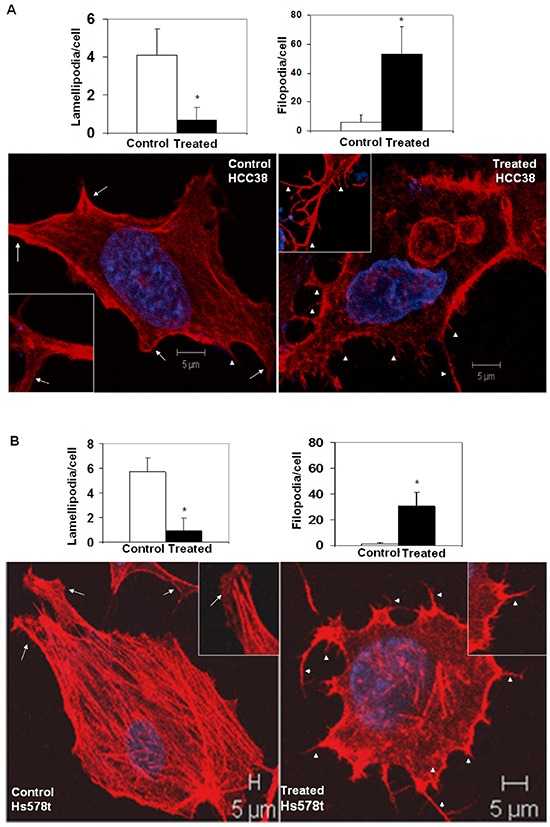
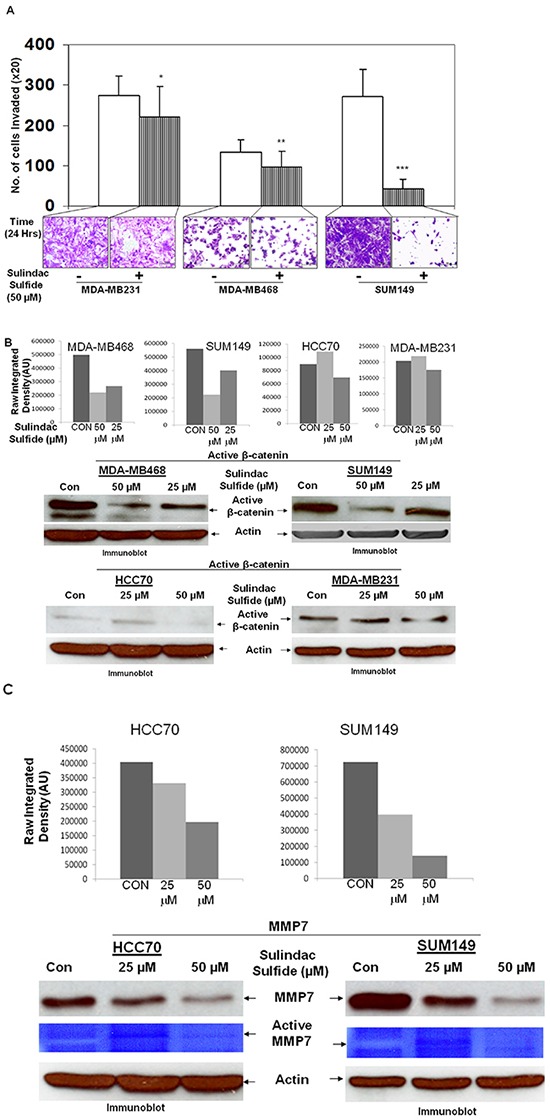
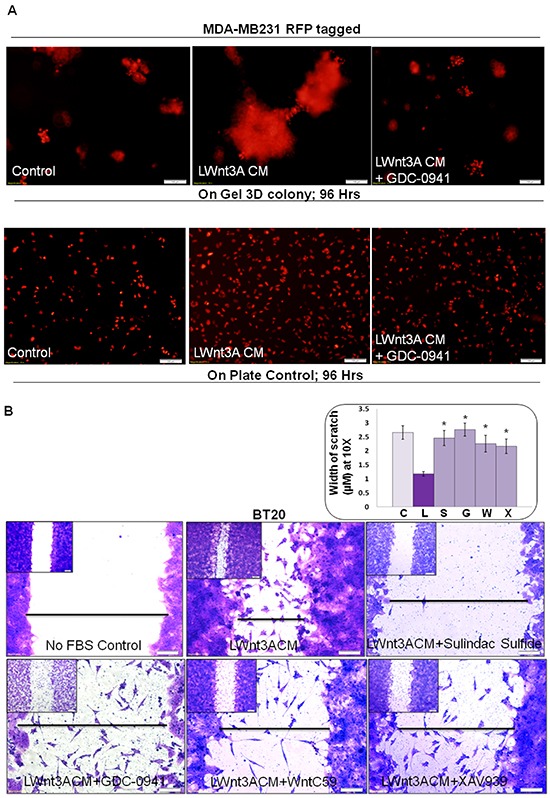
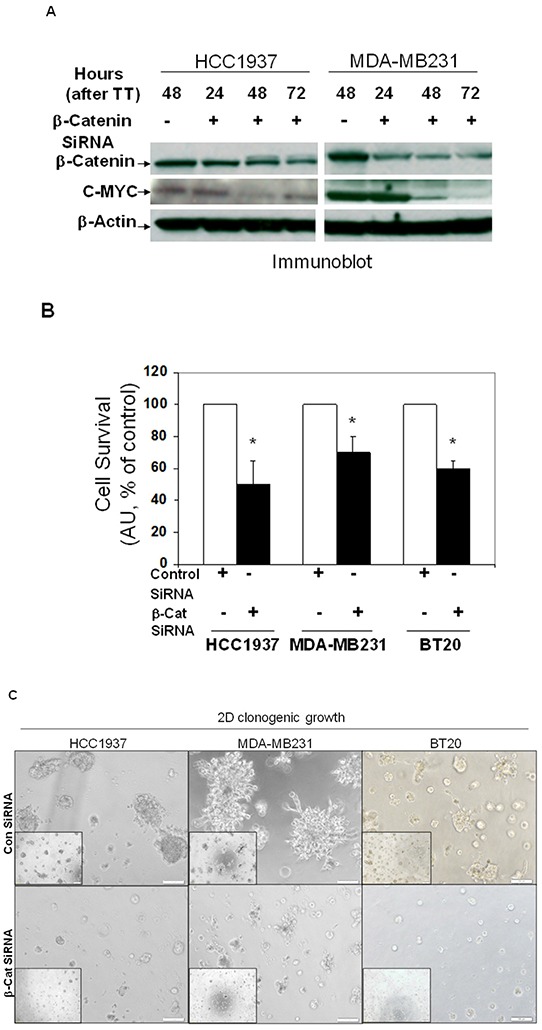
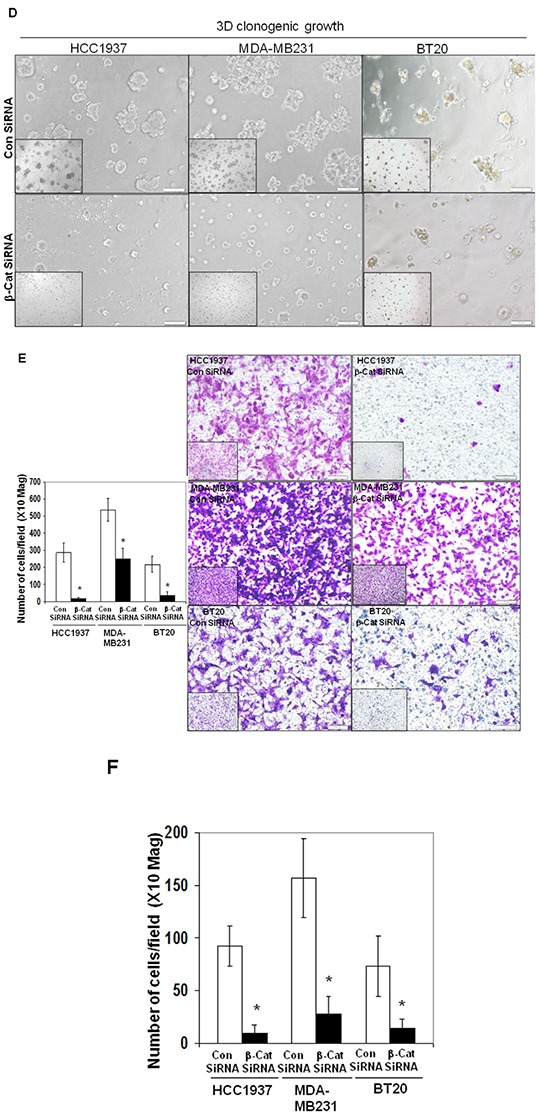
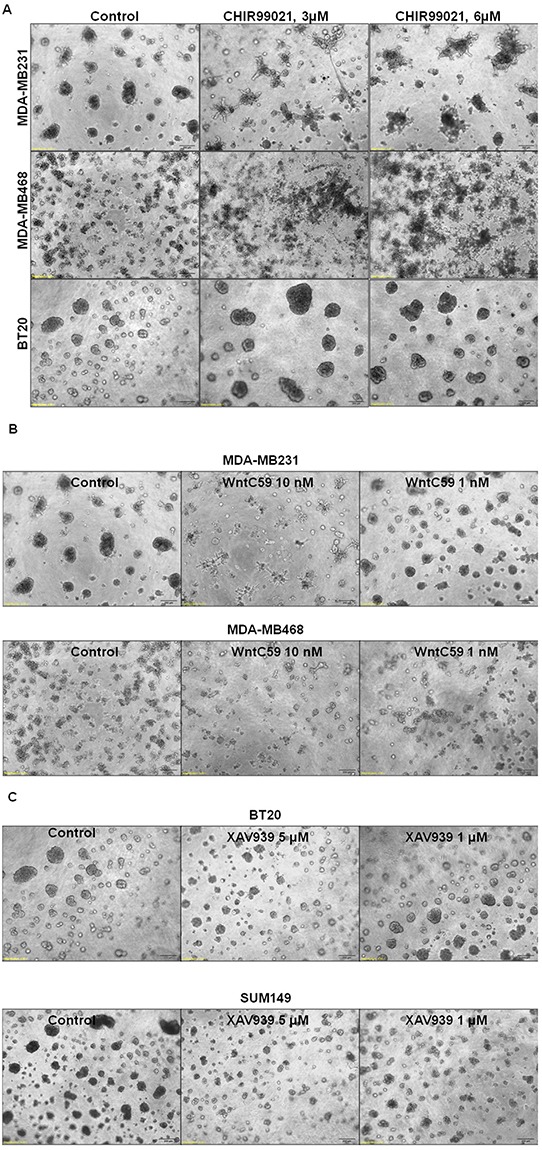
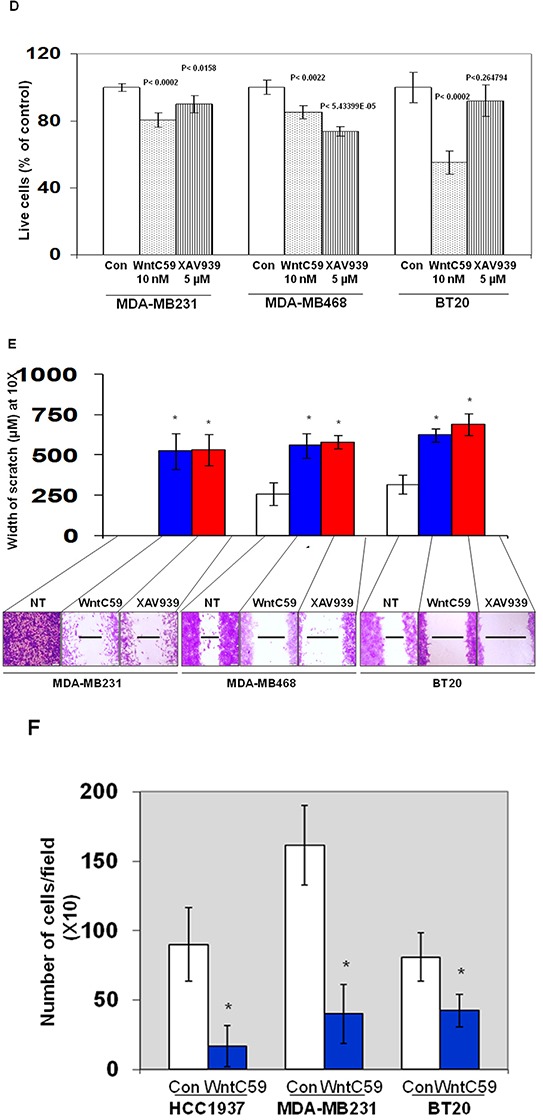
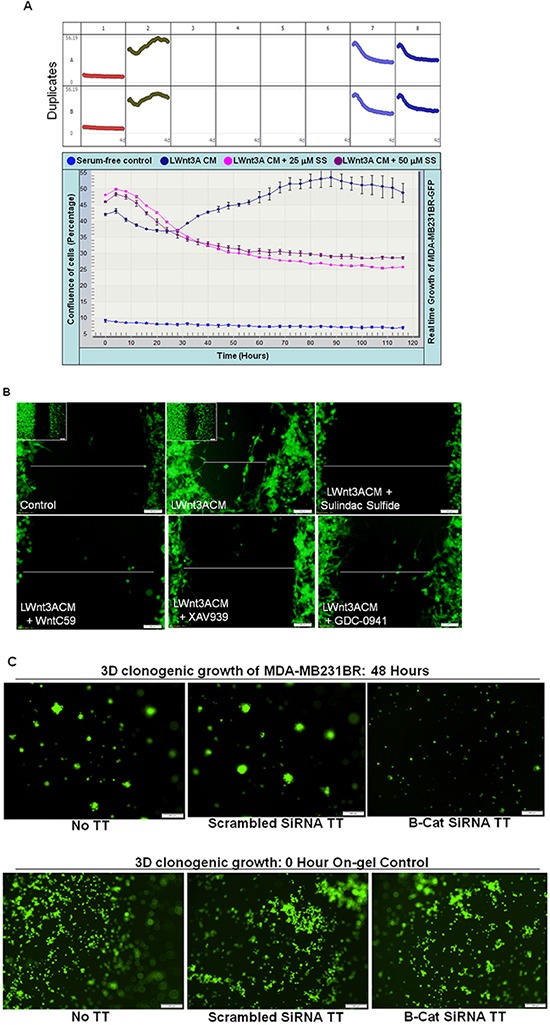
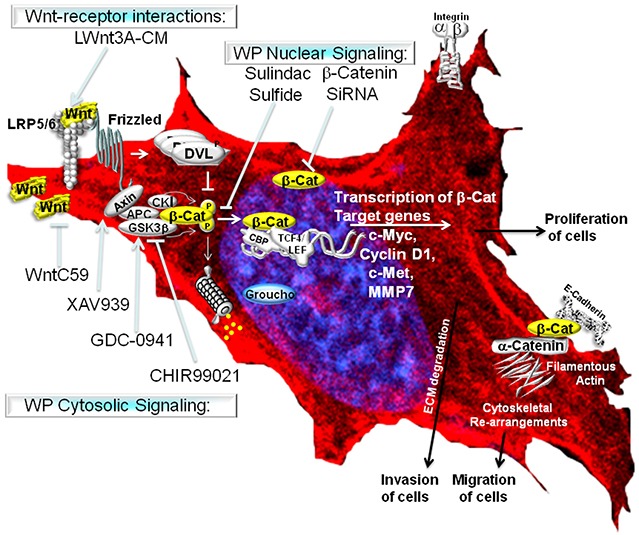
Tumor cells acquire metastasis-associated (MA) phenotypes following genetic alterations in them which cause deregulation of different signaling pathways. Earlier, we reported that an upregulation of the Wnt-beta-catenin pathway (WP) is one of the genetic salient features of triple-negative breast cancer (TNBC), and WP signaling is associated with metastasis in TNBC. Using cBioPortal, here we found that collective % of alteration(s) in WP genes, CTNNB1, APC and DVL1 among breast-invasive-carcinomas was 21% as compared to 56% in PAM50 Basal. To understand the functional relevance of WP in the biology of heterogeneous/metastasizing TNBC cells, we undertook this comprehensive study using 15 cell lines in which we examined the role of WP in the context of integrin-dependent MA-phenotypes. Directional movement of tumor cells was observed by confocal immunofluorescence microscopy and quantitative confocal-video-microscopy while matrigel-invasion was studied by MMP7-specific casein-zymography. WntC59, XAV939, sulindac sulfide and beta-catenin siRNA (1) inhibited fibronectin-directed migration, (2) decreased podia-parameters and motility-descriptors, (3) altered filamentous-actin, (4) decreased matrigel-invasion and (5) inhibited cell proliferation as well as 3D clonogenic growth. Sulindac sulfide and beta-catenin siRNA decreased beta-catenin/active-beta-catenin and MMP7. LWnt3ACM-stimulated proliferation, clonogenicity, fibronectin-directed migration and matrigel-invasion were perturbed by WP-modulators, sulindac sulfide and GDC-0941. We studied a direct involvement of WP in metastasis by stimulating brain-metastasis-specific MDA-MB231BR cells to demonstrate that LWnt3ACM-stimulated proliferation, clonogenicity and migration were blocked following sulindac sulfide, GDC-0941 and beta-catenin knockdown. We present the first evidence showing a direct functional relationship between WP activation and integrin-dependent MA-phenotypes. By proving the functional relationship between WP activation and MA-phenotypes, our data mechanistically explains (1) why different components of WP are upregulated in TNBC, (2) how WP activation is associated with metastasis and (3) how integrin-dependent MA-phenotypes can be regulated by mitigating the WP.

Keywords: LWnt3ACM stimulation; Wnt-pathway modulators; brain-metastasis specific TNBC cells; integrin-directed migration; matrigel-invasion.


Conflict of interest statement

The authors declare no conflicts of interest.

Figures

Figure 1
Figure 1. Alterations of WP genes in TNBC and basal-like BC subtypes
A. Oncoprints showing alterations in WP associated CTNNB1, APC and DVL1 in Breast Invasive Carcinoma (upper panel) and Breast Invasive Carcinoma; PAM50 Basal-like (lower panel). The patient selected were, (1) Breast Invasive Carcinoma; TCGA 2012 (825 patients/825 samples), and (2) Breast Invasive Carcinoma (TCGA 2012); PAM50 Basal (81 patients/81 samples). B. Oncoprints showing alterations in CTNNB1, APC and DVL1 in PAM50 Basal-like brca/tcga/pub2015 (upper panel) and triple-negative breast tumors brca/tcga/pub2015 (lower panel). The oncoprints are generated using 107 patients/107 samples for PAM50 Basal-like and 82 patients/82 samples for Triple-negative breast tumors. Advanced cancer genomic data visualization is obtained with the help of “The Onco Query Language (OQL)”. Oncoprints (different levels of zoom) have been generated using cBioPortal. Individual genes are represented as rows, and individual cases or patients are represented as columns. Protein level obtained from IHC staining (cBioPortal).
Figure 2
Figure 2. Effect of sulindac sulfide on (A) the expression of total beta-catenin protein, (B) the clonogenic 3D growth, (C) fibronectin-mediated migration by transwell assay, (D) fibronectin-mediated migration by scratch assay and (E) motility descriptors of real-time movement of live TNBC cells
A. Cells were treated with sulindac sulfide (25 μM and 50 μM) and total beta-catenin levels were determined by WB. B. Cells were treated with sulindac sulfide (25 μM and 50 μM) and their 3D clonogenic growth was tested. C. Sulindac sulfide treatment blocked fibronectin-mediated migration of HCC1937 and MDA-MB468 in a transwell assay (*p< 0.05). D. Sulindac sulfide treatment dose-dependently (25 μM and 50 μM) inhibited migration of HCC1937 and MDA-MB468 TNBC cells in the scratch assay (*p< 0.05). E. Sulindac sulfide (50 μM) also blocked (*p< 0.05) the trajectory of the movement of MDA-MB231 cells as measured by the nuclear tracking paths of the migrating live cells semi-quantified by two motility descriptors, average velocity (Upper bar diagram on the left) and MRDO, maximum relative distance from the origin (Upper bar diagram on the right). Vehicle-treated (control) and sulindac sulfide treated cells are imaged in real time. Nuclear tracking paths of the migrating cells are shown as track overlays. Bars represent Mean ± S.D. of the average velocity (μM/Hour) and MRDO (μM) of the cells in the presence (dark vertical bar) and absence (open bar) of sulindac sulfide. *p<0.01.
Figure 3
Figure 3. Sulindac sulfide treatment caused a loss of the cytoskeletal architecture of the filamentous actin in MDA-MB468 A. and SUM149 B. cells
TNBC cells were stained with phalloidin 555 for the confocal microscopy to test the effect of sulindac sulfide on the cytoskeletal architecture of the filamentous actin. The cells were stained with DAPI as a counterstain. Cells are imaged using Zeiss LSM 510 Metasystem. Successive Z-sections across cells were represented in the picture (consecutive photomicrographs) to demonstrate the effect of sulindac sulfide (photomicrographs i-p) on the organization of the filamentous actin as compared to the respective controls (photomicrographs a-h).
Figure 4
Figure 4. Sulindac sulfide treatment altered podia-parameters (lamellipodia and filopodia) of HCC38 A. and Hs578t B. cells
TNBC cells were cultured on fibronectin-coated coverslips. Control and sulindac sulfide treated (50 μM) cells were fixed in warm reconstituted PHEMO buffer before they were stained with phalloidin 555 and counterstained with DAPI. Filopodia (short arrowheads) and lamellipodia (arrows) were identified under a confocal microscope (Z-sections) as presented in the inset of individual cells. The semi-quantification was performed using ten randomly chosen fields from 4 independently performed experiments (*p<0.01).
Figure 5
Figure 5. Effect of Sulindac sulfide treatment on fibronectin-mediated invasion (A), levels of active beta-catenin (B) and expression/function of MMP7, a transcriptional target of active beta-catenin (C) in different TNBC cells
A. Sulindac sulfide (50 μM) blocked fibronectin-mediated invasion of MDA-MB231, MDA-MB468 and SUM149 TNBC cells through matrigel in the transwell invasion assay (**p< 0.05; ***p< 0.0001; *p< 0.07). B. Sulindac sulfide dose-dependently (25 μM and 50 μM) blocked the transcriptionally active form of beta-catenin in MDA-MB468, SUM149, HCC70 and MDA-MB231 TNBC cells. The expression of active beta-catenin was semi-quantified using ImageJ. C. Sulindac sulfide dose-dependently (25 μM and 50 μM) decreased both the levels of the MMP7 protein as well as its function (casein zymogram from secreted MMP7 in the conditioned media) in HCC70 and SUM149 TNBC cells. The expression of MMP7 protein was semi-quantified using ImageJ.
Figure 6
Figure 6. Effect of pan-PI3K inhibitor GDC-0941, sulindac sulfide, WntC59 and XAV939 on LWnt3ACM stimulated 3D-ON-TOP growth in MDA-MB231Red (A) and fibronectin-directed migration in BT20 (B) cells
A. GDC-0941 (1 μM) blocked LWnt3ACM stimulated 3D-ON-TOP growth at 96 hours in MDA-MB231Red TNBC cells. The “on plate” controls were included as the internal control to show the culture condition of the survival of the cells at 96 hours as the experiments were conducted under no FBS condition. The experiments were conducted under FBS-free condition since the LWnt3ACM was collected under no FBS condition. B. Sulindac sulfide, GDC-0941, WntC59 and XAV939 abrogated LWnt3ACM stimulated fibronectin-directed migration at 24 hours in BT20 cells. Low magnification pictures were presented as insets. The distance between scratches (n=4) was semi-quantified from 10 randomly chosen fields and presented as bar-diagram where FBS-free control (C) was compared with LWnt3ACM stimulated (L). The increase in the migration in the LWnt3ACM stimulated cells (as measured by the decrease in the width of the scratches) was compared with LWnt3ACM stimulated plus sulindac sulfide (S), LWnt3ACM stimulated plus GDC-0941(G), LWnt3ACM stimulated plus WntC59 (W), LWnt3ACM stimulated plus XAV939 (X) (*p< 0.05).
Figure 7
Figure 7. SiRNA mediated downregulation of beta-catenin and c-MYC proteins in TNBC cells (A) caused a decreased cell survival (B), blocked clonogenic 2D growth (C), blocked 3D ON-TOP growth. (D), inhibited fibronectin-directed transwell migration (E) and inhibited matrigel invasion (F)
A. HCC1937 and MDA-MB231 cells were transiently transfected with beta-catenin siRNA and control siRNA for different time points. Actin was used as the loading control. c-MYC levels were determined after transient transfection of beta-catenin siRNA. Downregulation of beta-catenin was tested as the reference. B. Effect of downregulation of beta-catenin was tested on the proliferation of HCC1937, MDA-MB231 and BT20 cells by cell TiterGLO following transient transfection of beta-catenin siRNA for 72 hours. Data presented as % of the live cell (*p< 0.05). C. Effect of downregulation of beta-catenin following transient transfection of beta-catenin siRNA was tested on the 2D clonogenic growth of HCC1937, MDA-MB231 and BT20 cells. D. Effect of downregulation of beta-catenin following transient transfection of beta-catenin siRNA was tested on the 3D clonogenic growth of HCC1937, MDA-MB231 and BT20 cells. Cells were plated for the clonogenic assay 24 hours following the transfection and clonogenicity were tested for 72 hours. E. Effect of downregulation of beta-catenin following transient transfection of beta-catenin siRNA (for 24 hours) was tested on the fibronectin-directed migration of HCC1937, MDA-MB231 and BT20 cells in a transwell. Migrated cells were stained with crystal violet before counting under a microscope (10 random fields) (*p< 0.05). Low-magnification images were presented as insets. F. Effect of siRNA-mediated down regulation of beta-catenin on matrigel invasion was tested in HCC1937, MDA-MB231, and BT20 cells following transient transfection of beta-catenin siRNA for 24 hours. Invaded cells were stained with crystal violet before counting under a microscope (10 random fields) (*p< 0.05).
Figure 8
Figure 8. Effect of WP modulators on clonogenic growth (A-C), cell survival (D), fibronectin-directed migration (E) and matrigel invasion (F) in different TNBC cells
A. WP activator, CHIR99021 upregulated while B. WP antagonists WntC59 and C. XAV939 downregulated 3D ON-TOP colony formation in MDA-MB231, SUM149, BT20 and MDA-MB468 cells. Two doses of WP activator CHIR99021 (3 μM and 6 μM), WP antagonists WntC59 (1 nM and 10 nM), and XAV939 (1 μM and 5 μM) were tested on the clonogenic growth of TNBC cells. Photomicrograph (X4 magnification) represents pictures of live cell colonies at the day 7 of treatment. D. Effect of Wnt-antagonists WntC59 (10 nM) and XAV939 (5 μM) on live MDA-MB231, MDA-MB468 and BT20 cells were tested by cell TiterGLO. The experiment was carried out in 10% FBS conditions. The effect was found to be more pronounced under 2.5 % FBS (data not shown). Statistical significance (p values) was presented on the respective bars. E. WP antagonists WntC59 (10 nM) and XAV939 (5 μM) blocked fibronectin-directed migration in MDA-MB231, MDA-MB468, BT20 cells (*p< 0.05). F. WntC59 (10 nM) downregulated matrigel invasion in HCC1937, MDA-MB231 and BT20 cells (*p< 0.05).
Figure 9
Figure 9. Effect of sulindac sulfide, WntC59, XAV939, GDC-0941 treatment and transient transfection of beta-catenin siRNA on real-time proliferation (A), fibronectin-directed migration (B) and clonogenic 3D growth (C) of brain metastasis-directed MDA-MB231BR TNBC cells
MDA-MB231BR cells were used to test the role of the WP directly in real time proliferation A. fibronectin-directed migration B. and 3D clonogenic growth C. under different study conditions e.g. physiological stimulation of the WP by LWnt3ACM and genetic perturbation of beta-catenin following transient transfection of beta-catenin siRNA. (A) Sulindac sulfide blocked LWnt3ACM stimulated proliferation of cells as measured by the percentage of the confluence of cells (mean Vs time). (B) LWnt3ACM stimulated fibronectin-directed migration for 24 hours was abrogated in the presence of WP modulators, WntC59 10 nM as well as XAV939 (5 μM), sulindac sulfide (50 μM) and GDC-0941 (1 μM). C. LWnt3ACM stimulated 3D clonogenic growth for 48 hours was abrogated following transient transfection of beta-catenin siRNA as compared to the transfection of scrambled siRNA.
Figure 10
Figure 10. WP controls metastasis-associated phenotypes in TNBC
The Wnt signaling pathway is activated following the binding of extracellular Wnt ligands (often secreted by the cell) to Frizzled transmembrane receptors. Canonical Wnt signaling causes the activation of beta-catenin-TCF complexes leading to the transcriptional activation of beta-catenin target genes (as stated in the discussion).

Similar articles

Cited by

References

    1. Perou CM, Sorlie T, Eisen MB, van de Rijn M, Jeffrey SS, Rees CA, Pollack JR, Ross DT, Johnsen H, Akslen LA, Fluge O, Pergamenschikov A, Williams C, Zhu SX, Lonning PE, Borresen-Dale AL, et al. Molecular portraits of human breast tumours. Nature. 2000;406:747–752. - PubMed
    1. Carey L, Winer E, Viale G, Cameron D, Gianni L. Triple-negative breast cancer: disease entity or title of convenience? Nature reviews Clinical oncology. 2010;7:683–692. - PubMed
    1. Reis-Filho JS, Tutt AN. Triple negative tumours: a critical review. Histopathology. 2008;52:108–118. - PubMed
    1. Dent R, Hanna WM, Trudeau M, Rawlinson E, Sun P, Narod SA. Pattern of metastatic spread in triple-negative breast cancer. Breast cancer research and treatment. 2009;115:423–428. - PubMed
    1. Carey LA. Directed therapy of subtypes of triple-negative breast cancer. The oncologist. 2011;16(Suppl 1):71–78. - PubMed

MeSH terms